BNB price is still consolidating above the $200 support zone against the US Dollar. It could start a decent increase if there is a close above the $220 resistance.
- BNB price is slowly moving higher toward the $220 resistance against the US Dollar.
- The price is now trading above $210 and the 100 simple moving average (4 hours).
- There is a key bullish trend line forming with support near $211.5 on the 4-hour chart of the BNB/USD pair (data source from Binance).
- The pair might gain bullish momentum if there is a daily close above $220.
BNB Price Remains In A Range
This past week, BNB price again retested the $200-$202 support zone. The bears made another attempt to clear the key $200 support, but they failed. A low was formed near $203 before the price started a decent increase, like Bitcoin and Ethereum.
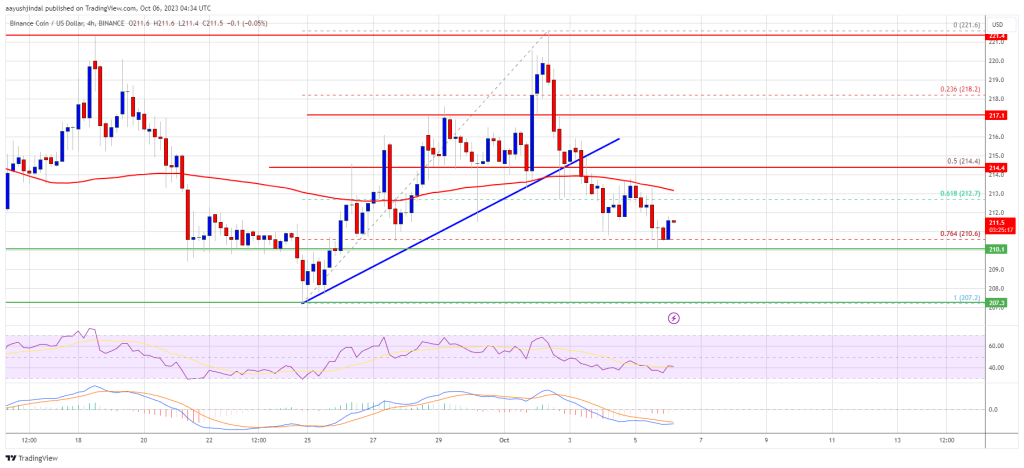
There was a move above the $210 and $212 levels. The price tested the main $220 resistance. A high is formed near $219.2 and the price is now consolidating above the 50% Fib retracement level of the upward move from the $203 swing low to the $220 high.
BNB is now trading above $210 and the 100 simple moving average (4 hours). There is also a key bullish trend line forming with support near $211.5 on the 4-hour chart of the BNB/USD pair.
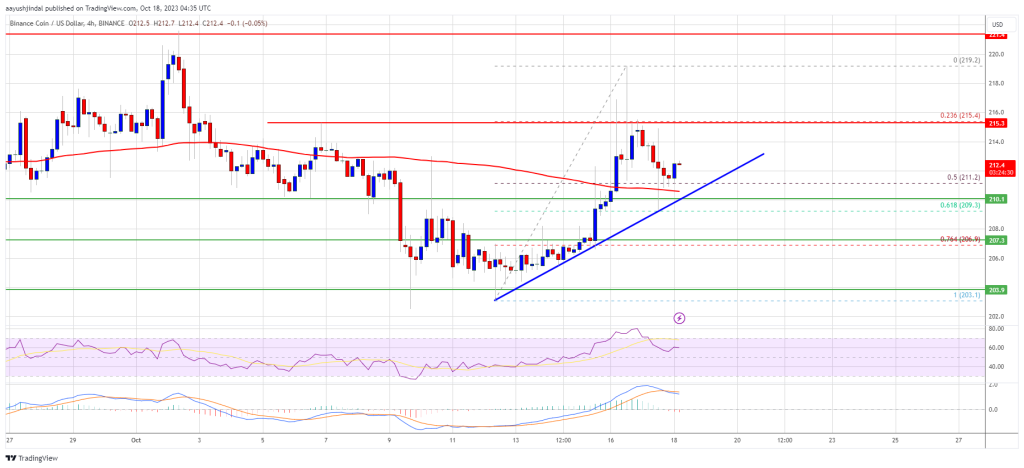
Source: BNBUSD on TradingView.com
If there is a fresh increase, the price could face resistance near the $215.5 level. The next resistance sits near the $220 level. A clear move above the $220 zone could send the price further higher. In the stated case, BNB price could test $235. A close above the $235 resistance might set the pace for a larger increase toward the $250 resistance.
More Losses?
If BNB fails to clear the $220 resistance, it could start another decline. Initial support on the downside is near the $211 level and the trend line. The next major support is near the $207 level or the 76.4% Fib retracement level of the upward move from the $203 swing low to the $220 high.
If there is a downside break below the $207 support, the price could drop toward the $202 support. Any more losses could initiate a larger decline toward the $185 level.
Technical Indicators
4-Hours MACD – The MACD for BNB/USD is losing pace in the bearish zone.
4-Hours RSI (Relative Strength Index) – The RSI for BNB/USD is currently above the 50 level.
Major Support Levels – $211, $207, and $202.
Major Resistance Levels – $215, $220, and $222.