Bitcoin ETF Breaks Records: BlackRock’s IBIT Joins Elite ‘$10 Billion Club’ Amidst Soaring Demand

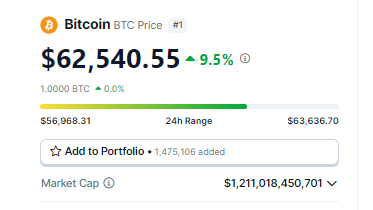
The demand for spot Bitcoin exchange-traded funds (ETFs) has surged since their recent approval on January 10, with BlackRock’s IBIT Bitcoin ETF leading the way. This ETF has reached impressive milestones in less than two months, attracting significant investor interest and opening doors for various market participants to invest in the largest cryptocurrency directly. 

As institutional and retail investors flock to these new investment vehicles, market experts predict a bullish trend and anticipate a potential price surge.

Bitcoin ETF Frenzy

According to Bloomberg ETF expert Eric Balchunas, BlackRock’s IBIT Bitcoin ETF has quickly joined the esteemed “$10 billion club,” reaching the milestone faster than any other ETF, including Grayscale’s Bitcoin Trust (GBTC), noting that only 152 ETFs out of 3,400 have crossed the threshold.

Balchunas notes that IBIT’s ascent to this club was primarily driven by significant inflows, which accounted for 78% of its assets under management (AUM). This reflects the growing appetite for Bitcoin exposure among investors seeking diversified and regulated investment options.

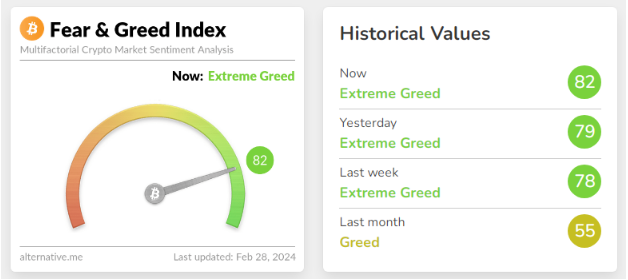
In particular, the current trajectory of the ETF market paints a picture of resilience and bullish sentiment in the market. Equity ETF flows, and leveraged trading levels are positive indicators, although they have not yet reached the euphoria seen in 2021, Balchunas notes. 

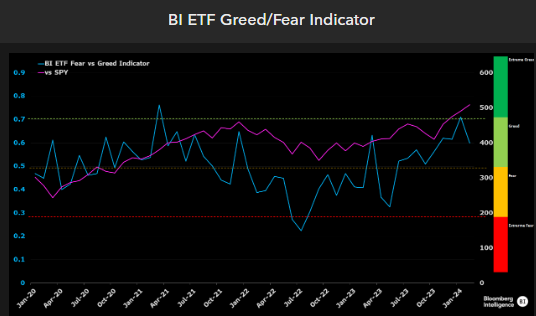
However, Bloomberg’s new BI ETF Greed/Fear Indicator, which incorporates various inputs, highlights the optimistic outlook shared by ETF investors, as seen in the chart below.

Bitcoin ETF

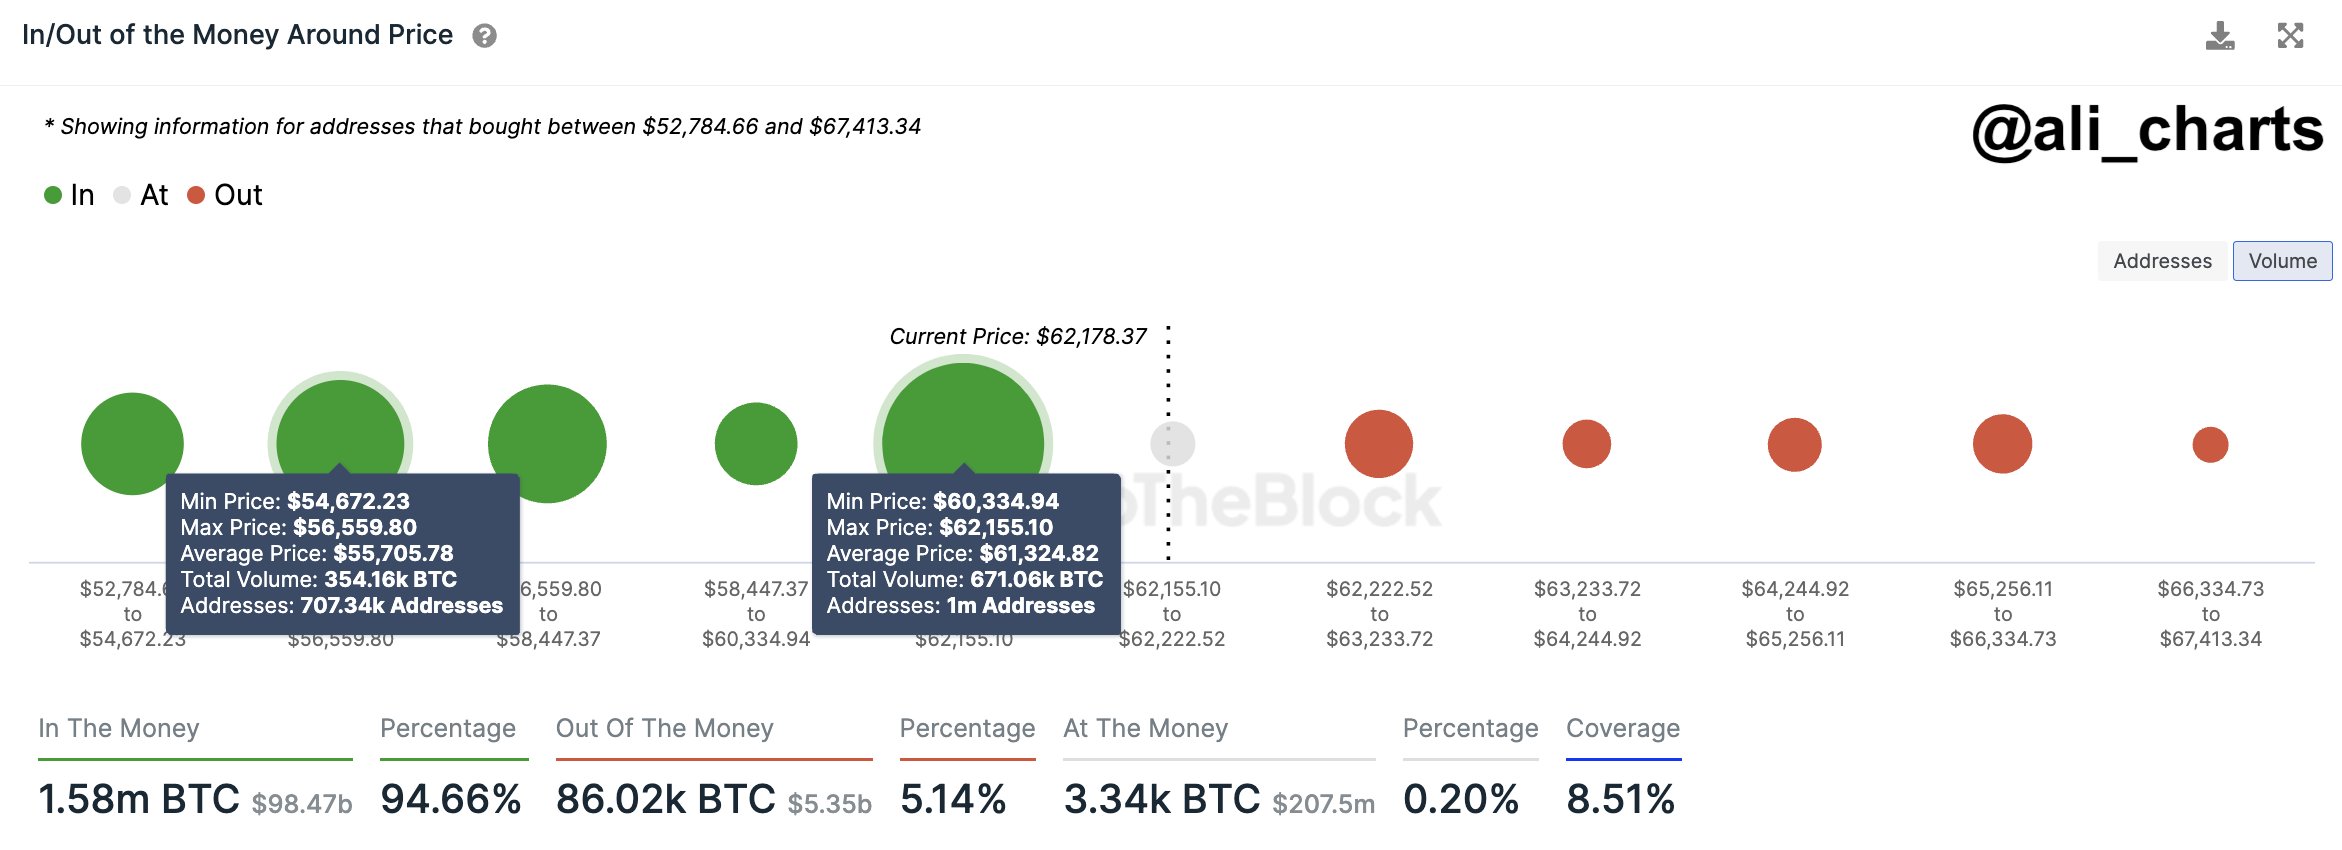
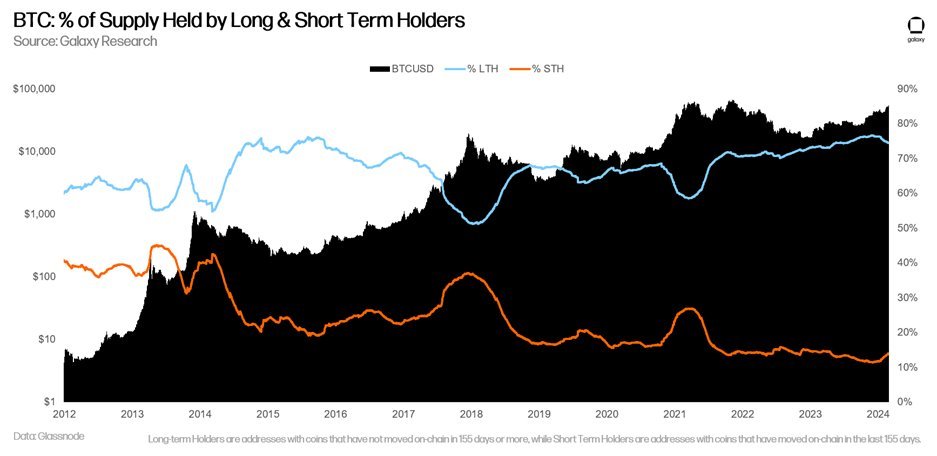
On this matter, crypto analyst “On-Chain College” went to social media X (formerly Twitter) to emphasize the significant demand for Bitcoin as evidenced by its rapid departure from exchanges. 

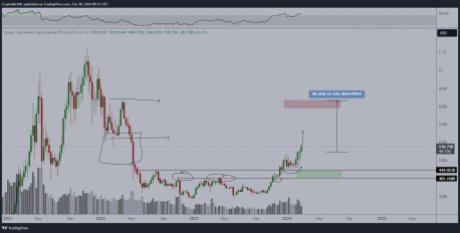
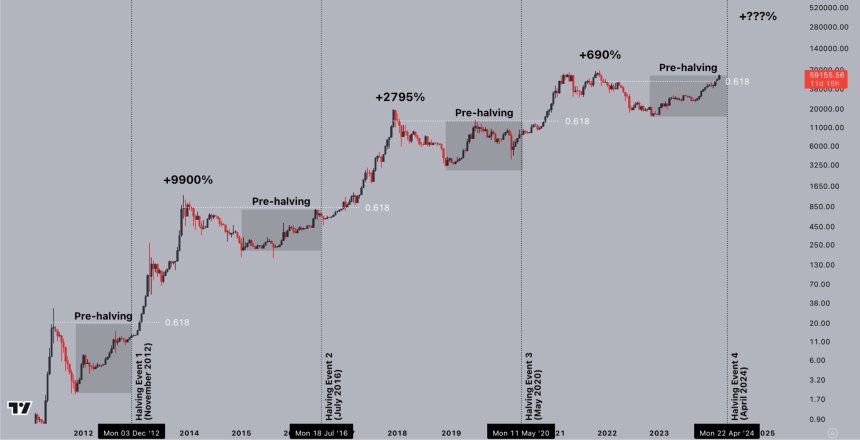
In its analysis, On-Chain College highlights that Bitcoin ETFs buy approximately ten times the daily amount of BTC mined. At the same time, the upcoming halving event will further reduce the mining supply. The analyst predicts when demand will exceed available supply, leading to potential upward price pressure.

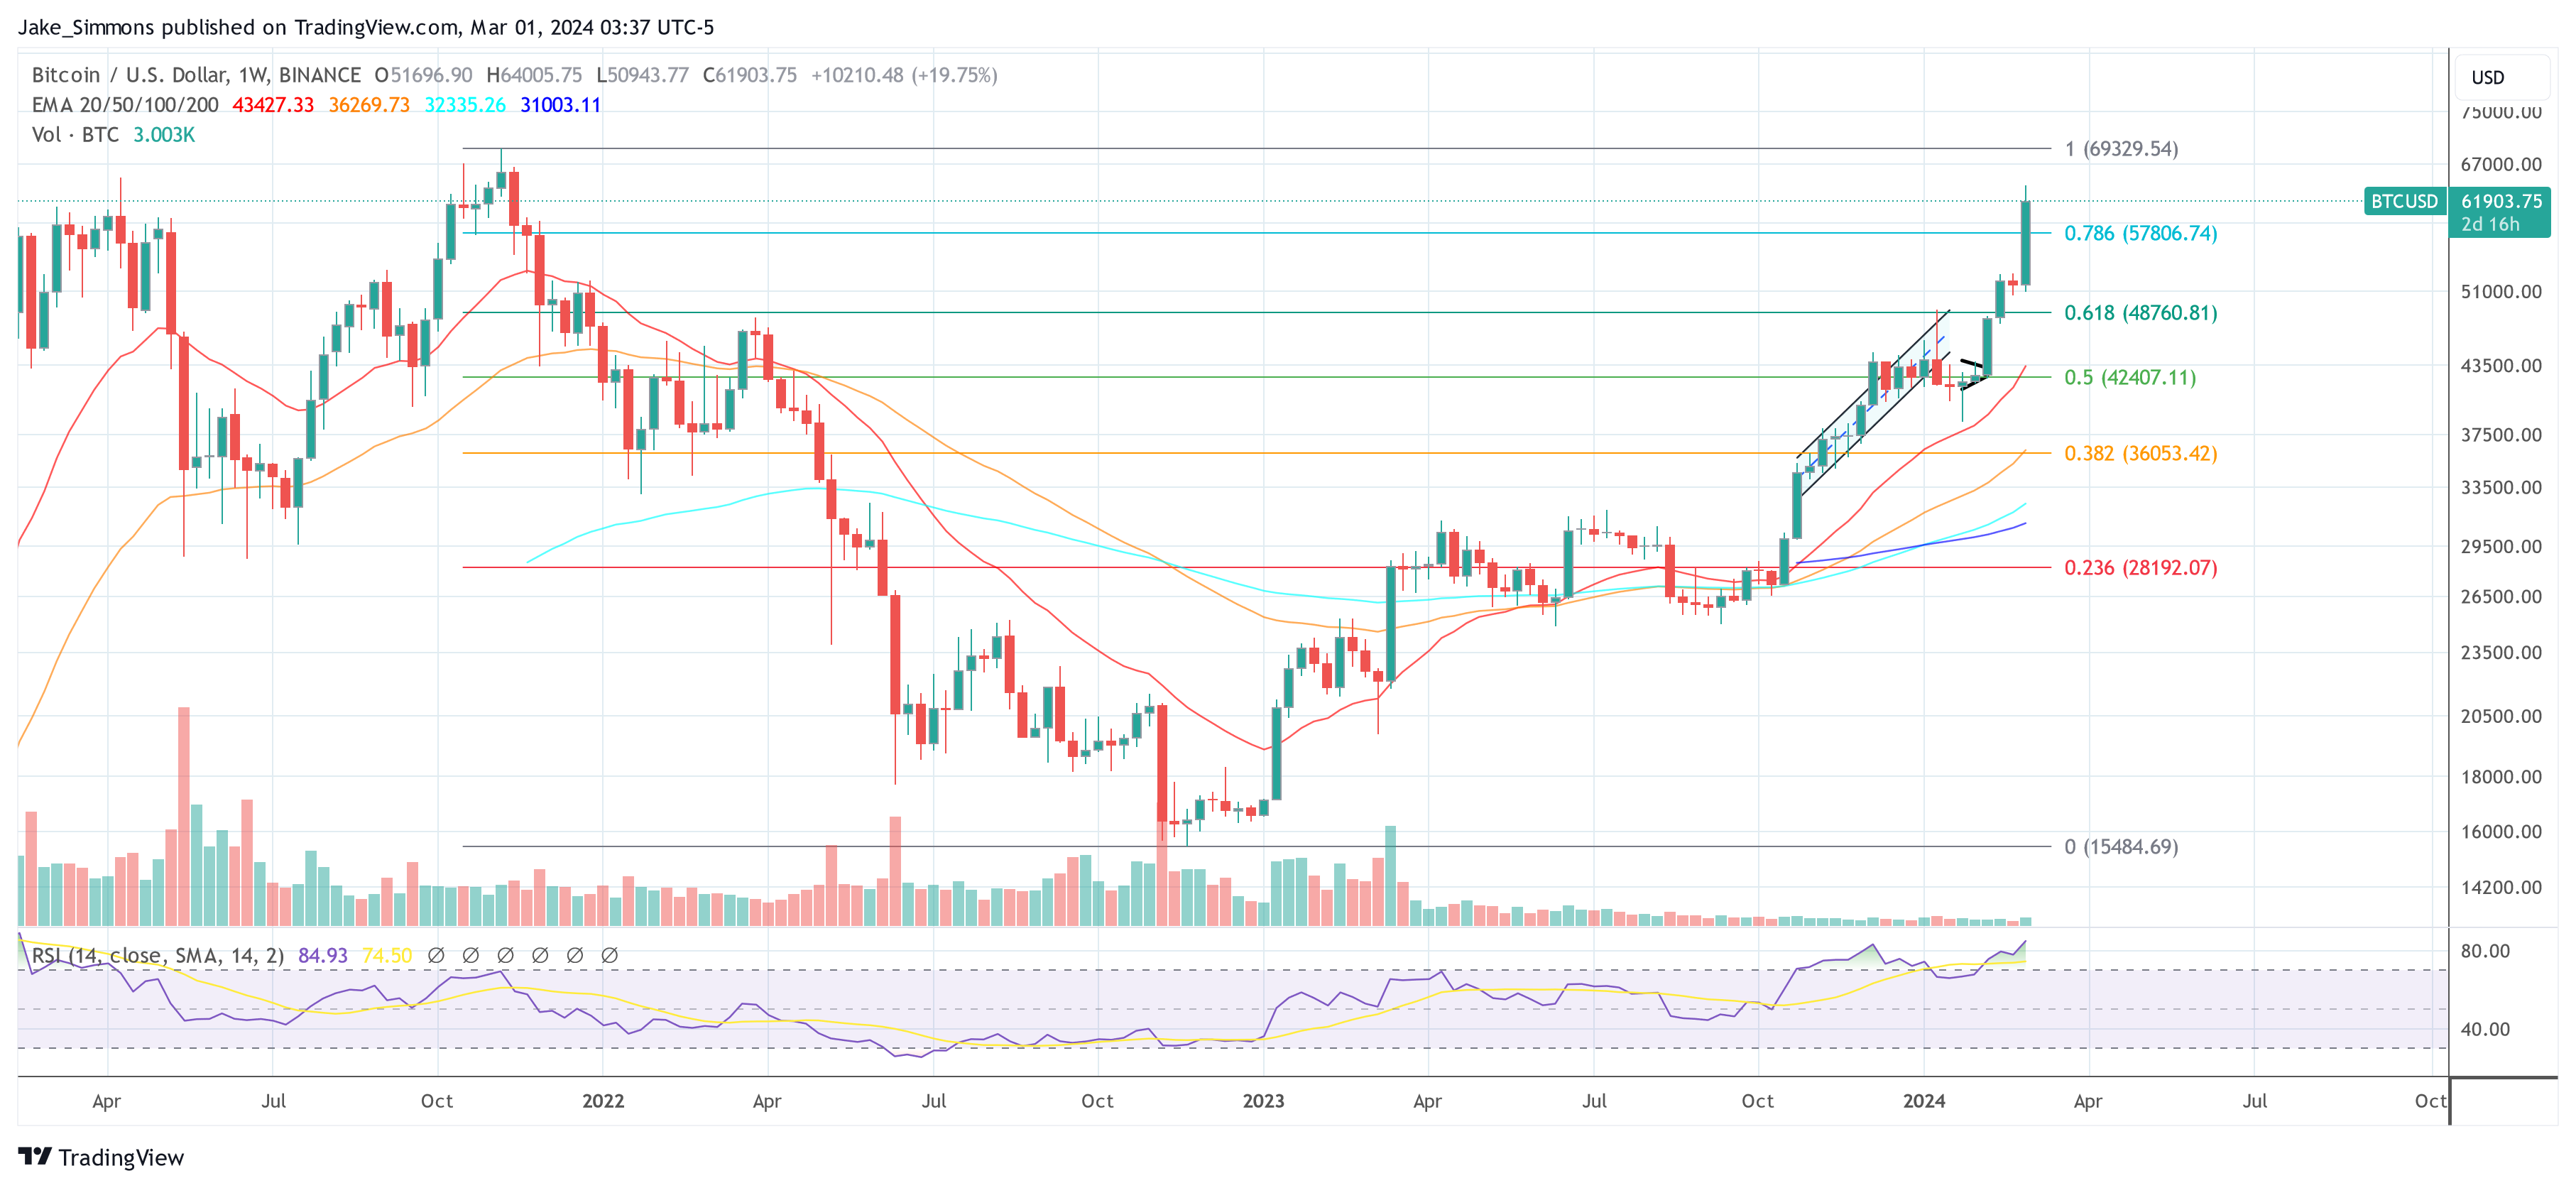
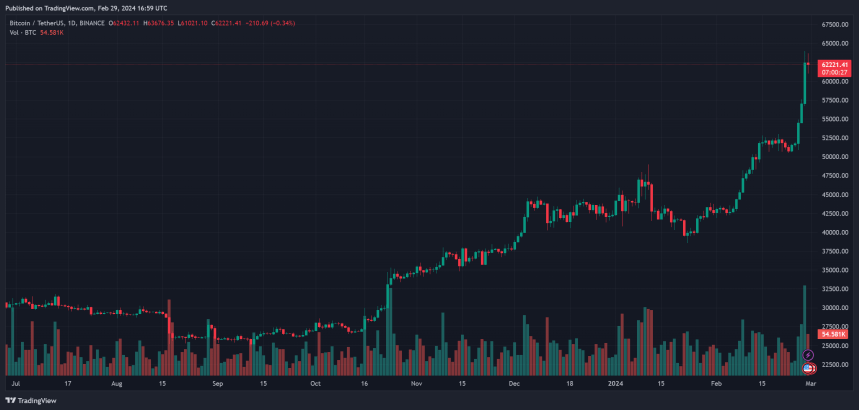
Highest Monthly Close Since 2021

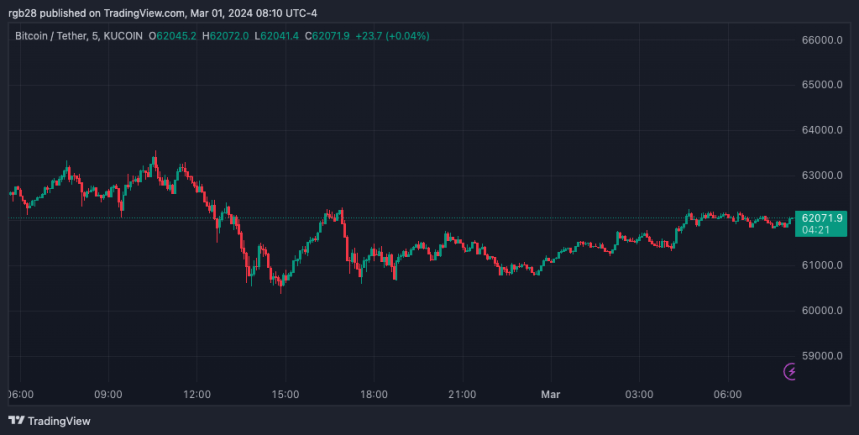
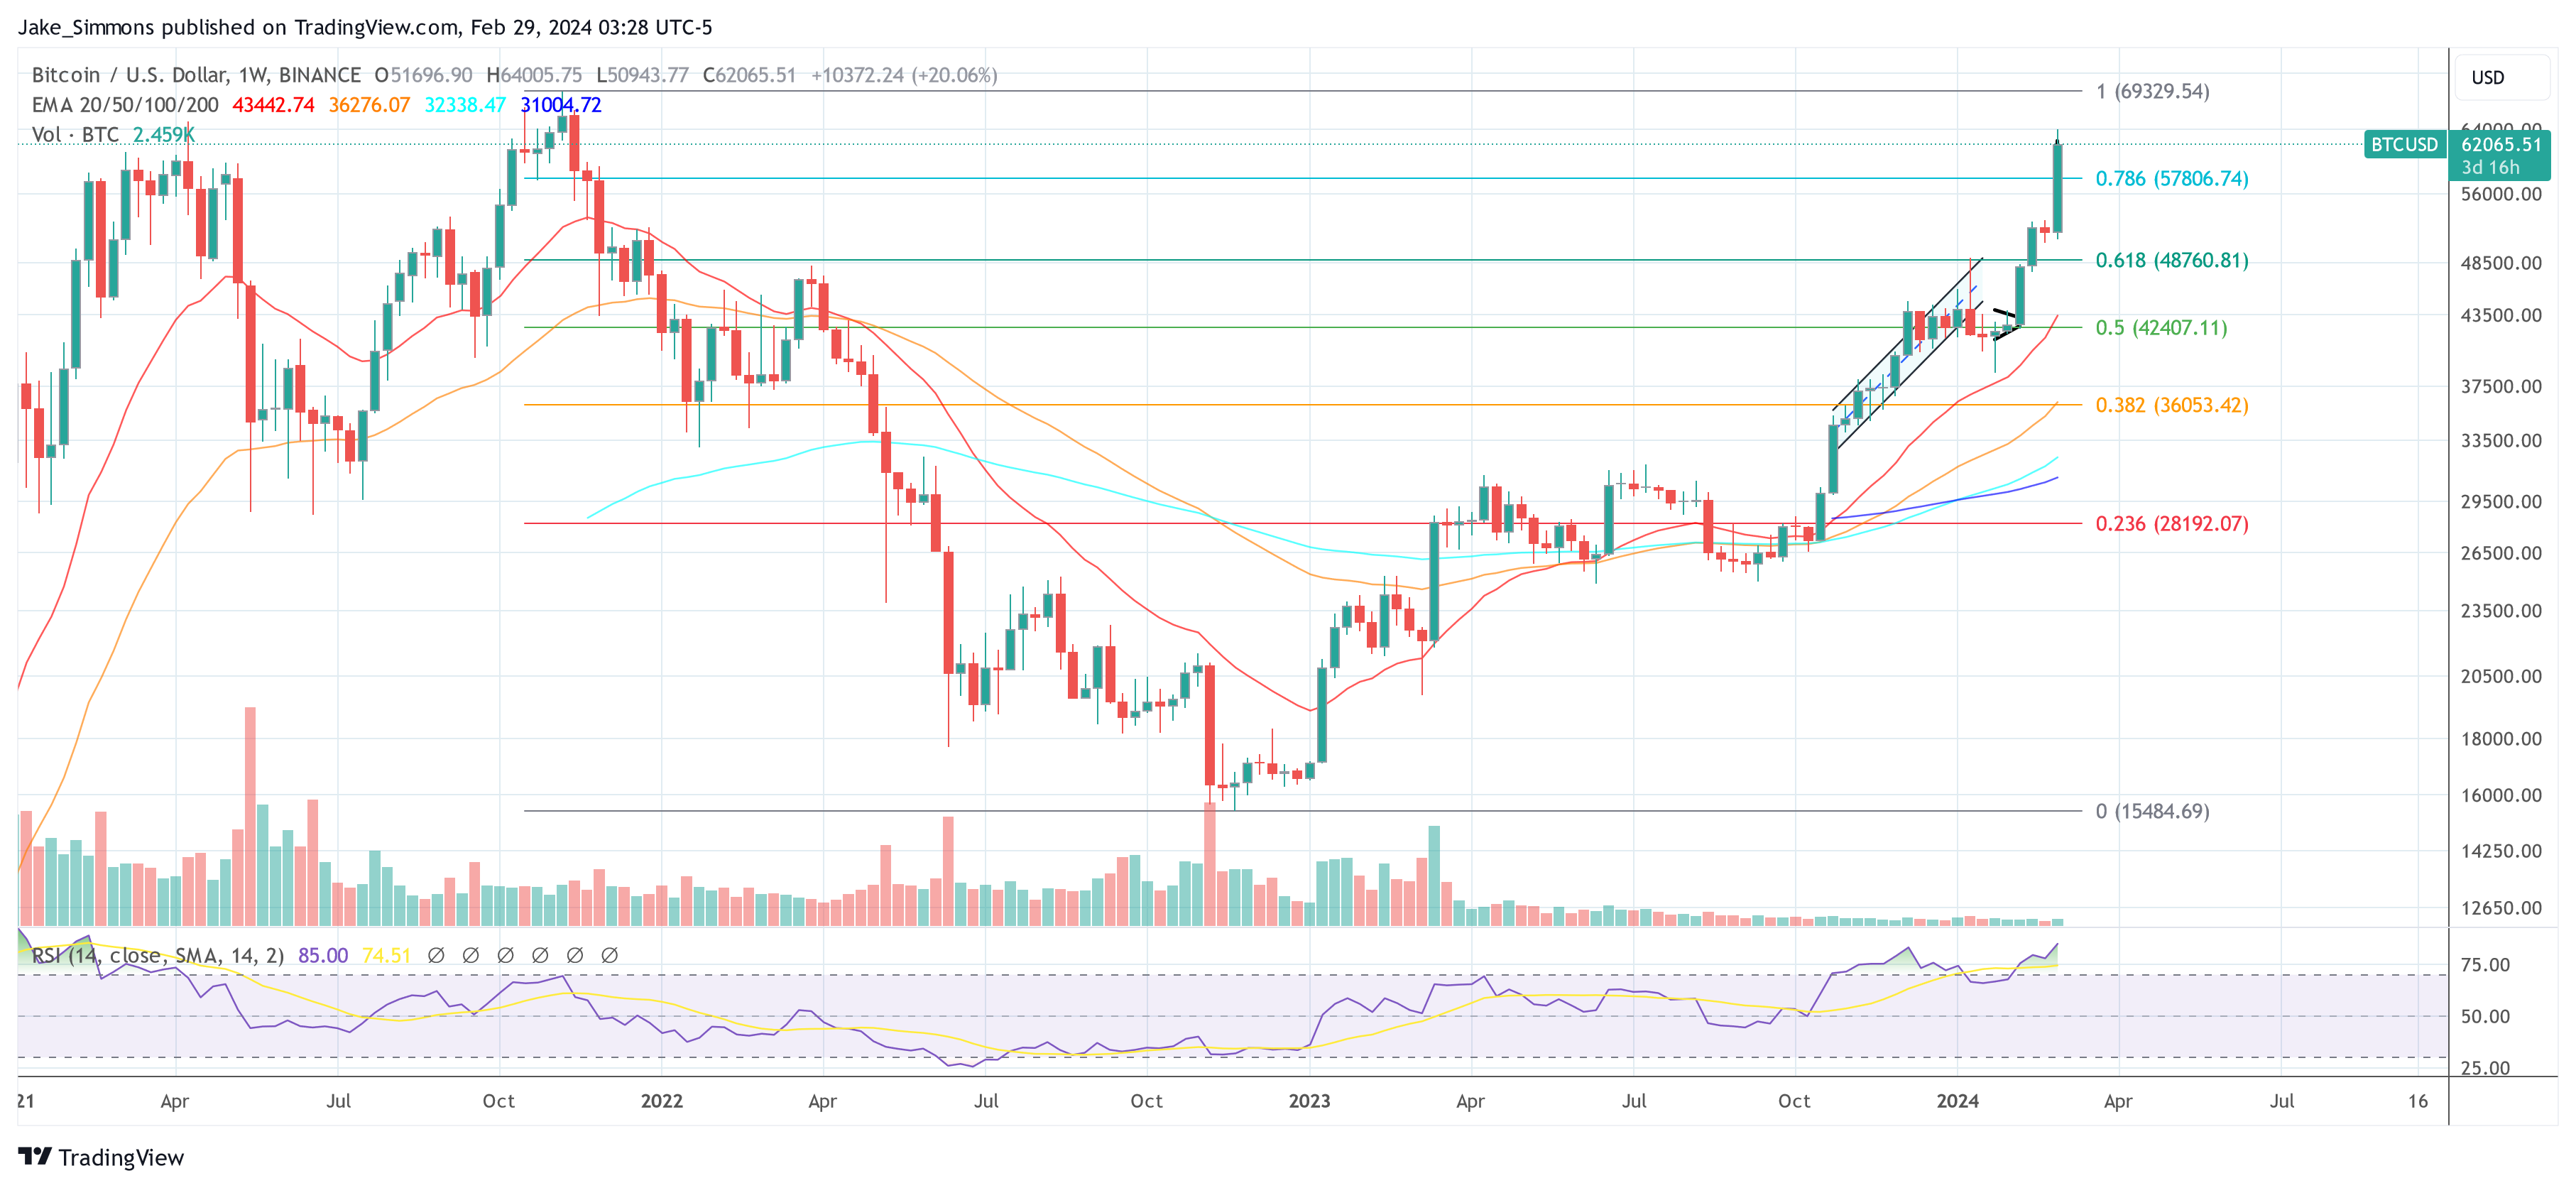
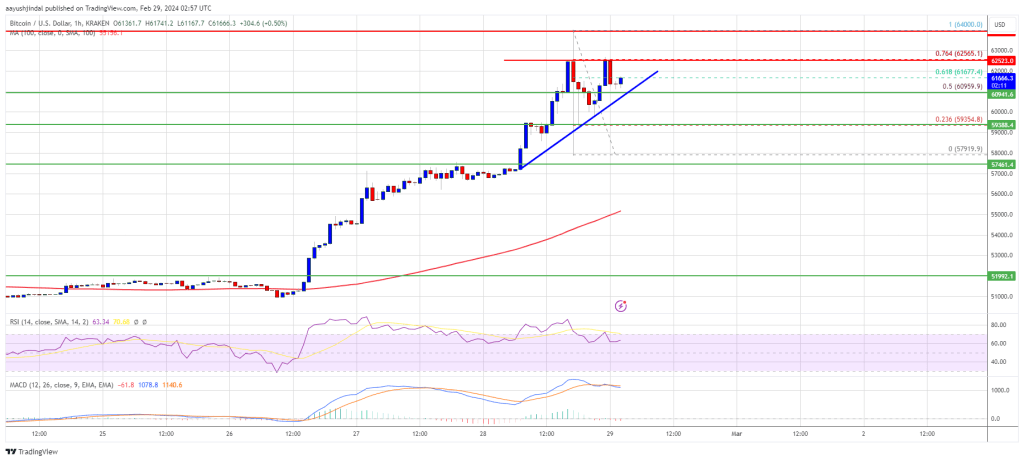
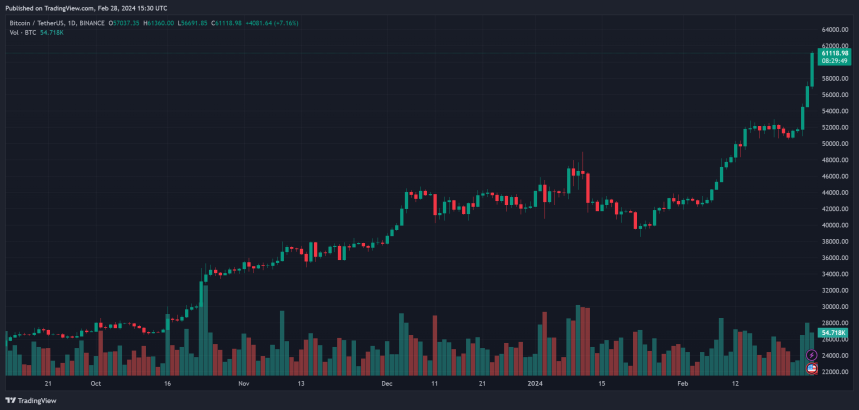
Bitcoin’s recent market performance has caught the attention of wealth manager Caleb Franzen, who highlights the significance of the highest monthly close since October 2021. 

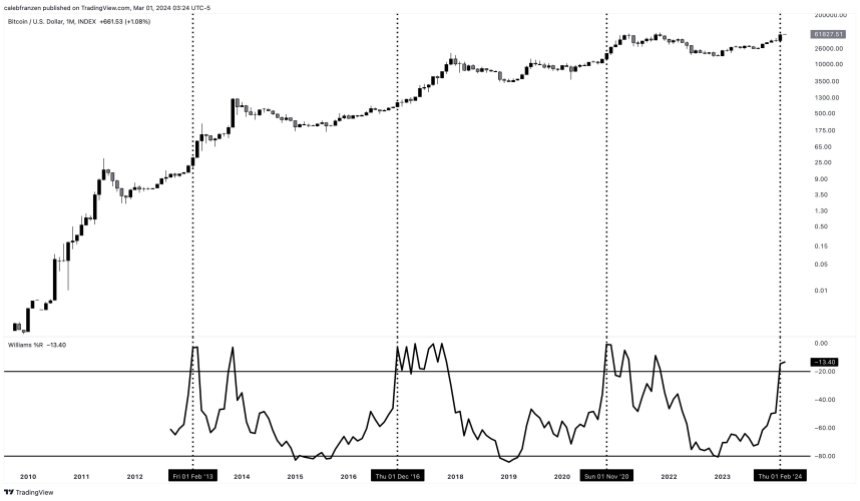
Franzen further emphasizes the bullish momentum by pointing out that the 36-month Williams%R Oscillator has closed above the overbought level for only the fourth time in history. Historical data reveals impressive returns following such signals, indicating the potential for substantial gains in the coming months. 

Bitcoin ETF

Additionally, Franzen notes the changing dynamics of the market, with increased institutional participation and the ease of retail onboarding through ETFs.

Franzen presents a compelling case for the bullish nature of overbought signals, urging market participants to view them as momentum indicators rather than signals to fade. Previous instances of overbought signals have resulted in significant Bitcoin price appreciation:

  • February 2013: +3,900% in 9 months
  • December 2016: +1,900% in 12 months
  • November 2020: +260% in 12 months

While acknowledging diminishing returns in each cycle, Franzen highlights the unprecedented level of institutional participation and the ease of retail access through ETFs. 

Even if Bitcoin were to match the +260% gain from the November 2020 signal, it would reach a price of $180,000, surpassing Franzen’s minimum cycle target of $175,000. 

Ultimately, Franzen notes that bull markets are typically characterized by a rising ETHBTC ratio and a falling BTC.D (Bitcoin dominance). While these characteristics have yet to manifest fully, Franzen suggests that a multi-quarter rally in the broader cryptocurrency market may be on the horizon.

Bitcoin ETF

Featured image from Shutterstock, chart from TradingView.com 

Crypto Market Slowdown Amid Rally? Prices Remain Strong With Bitcoin Above $62K

The crypto market has shown an incredible performance over the past week. Bitcoin has sustained momentum and risen above the $60,000 level, reaching $64,000.

The levels reached at the end of February have suggested to many investors that March could be an even more impressive month for the current bullish rally.

However, no prediction is set in stone, as many factors could swing investors’ sentiments and move the trends in the opposite direction. At the moment, the crypto market seems to have taken a small pause to catch its breath.

Crypto Market Momentarily Slows Down

The global crypto market reached a significant milestone for this bullish run a few days ago. As reported, the total crypto market cap hit $2T on February 27, an accomplishment not seen since April 2022.

As March begins, the market cap for the crypto market sits at $2.3 trillion, representing a 17.97% surge in the 7-day timeframe. This growth has surpassed the level established in early 2022 and potentially clears the path to the $2.4 trillion mark seen in December 2021.

Nonetheless, the market rise seemingly slowed down momentarily. The current market cap of $2.31 trillion represents a modest 1.32% decrease over the last day, according to CoinMarketCap data.

Similarly, the total crypto market trading volume was around $127.9 billion at writing time, registering a significant 35.77% drop from yesterday.

The data shows that Bitcoin and Ether have faced over 40% market activity decrease compared to the trading volume registered 24 hours ago. Similarly, some of the largest memecoins showed a slowdown in performance.

As the list below shows, Dogecoin (DOGE) registered a 5.9% price drop on the last day. Likewise, Shiba Inu’s (SHIB) price decreased by 5.8% in the same timeframe.

On the contrary, Solana (SOL) performed better on the last day than the top ten cryptocurrencies, registering a 4.1% price surge.  SOL’s $134 price places it alongside DOGE as the best-performing cryptocurrencies among the top ten in the last seven.

Among the largest gainers on the last day, PEPE reversed yesterday’s 12% price drop after registering a 10.9% growth during the past 24 hours. Similarly, the dog-themed memecoins dogwifhat (WIF) and (BONK) registered a price increase of 20,66% and 6.65%, respectively.

Bitcoin And Ether Remain Strong Amid The Market Volatility

Some analysts expect a significant halving-related drop in Bitcoin’s price. Meanwhile, the King of crypto has shown strong resistance above a massive support wall, as crypto analyst Ali Martinez suggests.

Over 1 million addresses are buying over 671,000 BTC within the $60,000 and $62,000 price range. Which, according to the analyst, highlights a strong investor confidence. This confidence could be a crucial support level and a cushion against a future price drop.

At writing time, the flagship cryptocurrency trades at around $62,052.71, which only accounts for a 1% decrease from the day before. BTC has increased over 21.8% in the last week, and it’s only 10.34% lower than its all-time high (ATH) of $69,000 registered in November 2021.

Likewise, it’s worth noting that Ether (ETH) has been showing a robust performance in the past few days amid the volatile crypto market. Maintaining its price range in the past 24 hours, the ‘king of altcoins’ registered only a 1.8% price decrease from yesterday. ETH currently trades at $3,411.88, representing a notable 16.2% rise in the past week.

BTC, BTCUSDT, Bitcoin

Bitcoin Safe From Drops Under $60,300? On-Chain Data Says So

On-chain data shows Bitcoin currently has a thick supply wall between the $60,300 and $62,155 levels that may prevent the asset from falling lower.

A Large Amount Of Bitcoin Was Bought Near Current Prices

As explained by analyst Ali in a new post on X, BTC has a major support wall just below it right now. In on-chain analysis, the strength of support and resistance levels is gauged through the amount of Bitcoin that the investors bought at them.

The chart below shows how the distribution of the investor cost basis has looked like for BTC across the price ranges near the current spot value:

Bitcoin Support

Here, the size of the dot represents the number of tokens that the addresses bought between the corresponding price levels. From the graph, it’s apparent that the $60,300 to $62,100 range has a particularly high density of coins right now.

Most of the price levels in this range lie just below the current spot price of the cryptocurrency, meaning that the investors who bought here would be making some profit, albeit only a slight one.

Generally, when the price retests the cost basis of such investors who were in profit prior to the retest (meaning that the price has approached their cost basis from above), a buying reaction may be produced by these addresses.

This is because holders like these may have reason to believe that if they were able to get into profits before, they might be able to do so again in the near future, so they may just accumulate on this “dip.”

Such a reaction can naturally provide support to the cryptocurrency. The scale of this support, however, is naturally not anything significant if only a few investors bought at the level to begin with. Narrow ranges that are thick with addresses, on the other hand, might just prove to be a source of noticeable support.

In the aforementioned price range near the current spot price, one million addresses acquired a total of about 671,000 BTC. “This accumulation zone highlights strong investor confidence and could serve as a crucial level of support for BTC, potentially cushioning against further drops,” notes the analyst.

While the price ranges under the current price are heavy with coins, it’s visible in the chart that this isn’t the case for the ranges above. Just like how supply wallets below can be a source of support, they can instead act as resistance when above.

The fact that the supply walls above are quite thin suggests that there wouldn’t be too many investors waiting to quickly exit at their break-even, and thus, selling pressure due to them should be low.

That said, it doesn’t mean there isn’t any impedance at all. Bitcoin is approaching all-time highs at this point, meaning that the vast majority of the supply is in profit. At these levels, mass selling for harvesting these gains can be the main challenge preventing the run from continuing.

BTC Price

At present, Bitcoin is trading around the $62,000 level, meaning that it’s right on the edge of the major support wall.

Bitcoin Price Chart

Bitcoin OTC Desks ‘Dried Up To 40 BTC’: What This Means

The availability of Bitcoin (BTC) on Over-the-Counter (OTC) desks has sharply decreased, with reports suggesting that at one point, only about 40 BTC were available for sale. This news has significant implications for the market and could herald a new era in BTC trading dynamics.

OTC Desks Had 40 Bitcoin Available On Wednesday

Caitlin Long, the CEO and founder of Custodia Bank, provided an eye-opening account of the current state of the OTC Bitcoin market. Through a series of posts on X (formerly Twitter), Long noted, “The #HODLgang has mostly held…I spent time in NYC over the past couple of days and it’s clear why the Bitcoin price spiked this week: there was almost no BTC available for sale on the big OTC desks.”

Echoing Long’s observations, Samuel Andrew, a noted figure in the crypto space, added, “OTC desks are nearly dried up. Very little Bitcoin available that’s easily accessible to meet demand. BlackRock and Fidelity are moving size in ways crypto has never seen before.” Long added:

Only ~40 BTC were available for sale at any price at one point on Wednesday, I was told by a credible source…

This scarcity of BTC on OTC desks is not an isolated incident but part of a broader trend indicating a significant shift in the market. Glassnode, a leading blockchain data and analytics firm, reported that Bitcoins held by OTC desks are at their lowest level in five years. Although Glassnode tracks only a portion of the OTC market, the data points to a clear trend of dwindling BTC availability.

What This Means For BTC Price

The implications of this trend are manifold. Firstly, it suggests a potential supply shock in the Bitcoin market, driven by increased demand from institutional investors and large corporations looking to add Bitcoin to their portfolios, as well as the introduction of spot Bitcoin ETFs. This supply shock could lead to a shift in price discovery from OTC desks to public exchanges, where the real market price of Bitcoin will be determined more transparently.

The shortage of Bitcoin on OTC desks also means that large investors and ETFs like BlackRock and Fidelity, who traditionally bought Bitcoin in bulk at a discount through these desks, may no longer have this option. This could further drive demand on public exchanges, potentially leading to significant price movements.

Analysts are already speculating on the possible outcomes of this situation. Alessandro Ottaviani, a prominent analyst, suggested, “After today, god candles ($10k in the daily), before the halving are possible and realistic.”

This sentiment was echoed by Francis Pouliot, CEO of Bull Bitcoin, who remarked on the self-correcting nature of the market: “OTC desks like http://BULLBITCOIN.COM never run out of Bitcoin. The price goes up, and people sell. If people don’t sell, the price goes up more.”

Adam Back, a Bitcoin OG and cypherpunk, provided a bullish outlook, stating, “$100k by halving day. People starting to believe. Bears, leveraged shorts rekt, scared-off, profit take limit orders moved upwards or just deleted to wait-and-see; OTC desks out of coins, daily $500m / 10k BTC ETF buy walls. This can gap upwards fast. 51 days to go [until Halving].”

In conclusion, the depletion of BTC supply on OTC desks marks a pivotal moment for the market. With the upcoming halving event in April and institutional interest at an all-time high, the stage is set for potentially unprecedented movements in the Bitcoin market.

At press time, BTC traded at $61,903.

Bitcoin price

Bitcoin Price Turns Attractive On Dips, 100 SMA Is The Key

Bitcoin price is correcting gains from the $64,000 resistance. BTC might find strong support near the $59,250 level or the 100 hourly SMA.

  • Bitcoin price is correcting gains below the $62,250 resistance zone.
  • The price is trading above $60,000 and the 100 hourly Simple moving average.
  • There was a break below a connecting bullish trend line with support at $62,850 on the hourly chart of the BTC/USD pair (data feed from Kraken).
  • The pair could correct lower toward $60,000 or even to the 100 hourly Simple moving average.

Bitcoin Price Starts Correction

Bitcoin price extended its rally above the $62,000 resistance zone. BTC even cleared the $63,200 level and tested the $64,000 zone. A new multi-week high was formed near $64,000 before the price started a downside correction.

The price traded below the $62,000 support. There was a spike below the 50% Fib retracement level of the upward move from the $57,846 swing low to the $53,549 swing high.

There was a break below a connecting bullish trend line with support at $62,850 on the hourly chart of the BTC/USD pair. Bitcoin is still trading above $60,000 and the 100 hourly Simple moving average.

Bitcoin Price

Source: BTCUSD on TradingView.com

Immediate resistance is near the $62,200 level. The next key resistance could be $62,850, above which the price could rise toward the $64,000 resistance zone. If the bulls remain in action, the price could even surpass $64,000 and test $65,000. Any more gains might send the price toward the $68,000 zone.

Are Dips Limited In BTC?

If Bitcoin fails to rise above the $62,200 resistance zone, it could continue to move down. Immediate support on the downside is near the $60,000 level and the 61.8% Fib retracement level of the upward move from the $57,846 swing low to the $53,549 swing high.

The first major support is $58,000 or the 100 hourly SMA. If there is a close below $58,000, the price could start a decent pullback toward the $56,500 zone. Any more losses might send the price toward the $55,000 support zone.

Technical indicators:

Hourly MACD – The MACD is now losing pace in the bullish zone.

Hourly RSI (Relative Strength Index) – The RSI for BTC/USD is now below the 50 level.

Major Support Levels – $60,000, followed by $58,000.

Major Resistance Levels – $62,200, $62,850, and $64,000.

JPMorgan Analysts Predict Bitcoin Crash To $42,000 Post-Halving – What You Need To Know

Bitcoin, the world’s largest cryptocurrency, faces a potential downturn in its price following the anticipated halving event scheduled for April, according to analysts at JPMorgan led by Nikolaos Panigirtzoglou.

This event occurs approximately every four years and is expected to slash miner rewards from 6.25 BTC per block to 3.125 BTC. As a result, JPMorgan analysts have warned that the Bitcoin price could drop toward $42,000 post-halving.

Reason Behind The Potential Crash To $42,000

The analysts attribute this potential decline to the reduced profitability for miners and the subsequent increase in BTC production costs. The analysts disclosed that the Bitcoin production cost has historically served as a “lower bound” for its prices, with the estimated range doubling post-halving to around $53,000.

Nonetheless, a potential 20% reduction in the BTC network’s hashrate looms is primarily attributed to the departure of less efficient mining rigs from the operational landscape.

Consequently, this scenario may drive the estimated production cost range to $42,000, calculated under an average electricity cost of $0.05 per kilowatt-hour (kWh).

According to the analyst, Bitcoin miners with “below-average electricity costs” and “more efficient equipment” are expected to fare better following the halving event. In contrast, those with “higher production costs” may struggle to remain profitable.

Consequently, analysts anticipate an increased concentration within the Bitcoin mining industry, with publicly listed miners likely to hold a higher share.

Moreover, there is the prospect of “horizontal integration” via “mergers and acquisitions” among miners spanning different regions, aiming to leverage “synergies and minimize” collective operational expenses.

Bitcoin Market Sentiments And Potential Surge

Meanwhile, as JPMorgan analysts suggest a potential drop in Bitcoin’s price post-halving, Hunter Horsley, CEO of Bitwise, remains optimistic about Bitcoin’s long-term outlook. Horsley predicts that the cryptocurrency will surge to $250,000 sooner than anticipated.

Meanwhile, many metrics within the BTC market signal a potential surge for Bitcoin. On-chain data reveals that the Bitcoin MVRV ratio has reached levels reminiscent of the parabolic bull run experienced in 2020, suggesting a forthcoming surge may be imminent.

Amid these varying forecasts and market sentiments, BTC trades at $63,391, marking a slight retracement from its recent peak above $64,000 – the highest level traded in the past two years.

Featured image from Unsplash, Chart from TradingView

Bitcoin Volatility Induces $700 Million Carnage In Crypto Futures

Data shows the cryptocurrency futures market has seen liquidations amounting to $700 million in the past day as Bitcoin has gone through its volatility.

Bitcoin Has Seen Intense Price Action In Past 24 Hours

The past day has been a bit of a rollercoaster for Bitcoin, with the asset registering sharp price action in both directions but ultimately going up as the bulls win out.

The chart below shows what the price action for the cryptocurrency has looked like recently.

Bitcoin Price Chart

From the graph, it’s visible that Bitcoin initially witnessed some sharp bullish momentum, in which the coin not only broke above the $60,000 level, but went up to touch the $64,000 mark.

This high, which is the peak for the year so far, only lasted briefly, however, as BTC crashed down spectacularly to under the $59,000 mark. The asset has since recovered to higher levels, now floating around $62,700.

The rest of the cryptocurrency sector has also gone through its volatility, with prices fluctuating across the coins. As is usually the case with such sharp price action, the futures market has suffered many liquidations.

Crypto Futures Market Has Gone Through A Squeeze In The Past Day

According to data from CoinGlass, the cryptocurrency futures market has witnessed the liquidation of contracts worth more than $700 million in the last 24 hours.

The table below displays the relevant information about the liquidations.

Bitcoin & Crypto Liquidations

It would appear that only $131 million of the liquidations came within twelve hours, suggesting that most of the flush was situated inside the preceding half-day period. This makes sense, as Bitcoin was most volatile inside this window.

It also seems that the long-to-short ratio in this liquidation event has been quite balanced, even though the price has increased in the past day. This would suggest that some aggressive longing occurred as Bitcoin approached $64,000, and the subsequent pullback wiped these top buyers.

The table below shows how the distribution has looked for the various symbols.

Bitcoin & Other Cryptos

As is generally the case, Bitcoin futures contracts have again been responsible for the largest portion of the total market liquidations, contributing around $270 million.

What’s different this time, however, is that this share, although the largest, isn’t even half the total liquidations. This could come down to the fact that speculators may now be playing around with altcoin positions after gaining confidence from the BTC price surge.

Dogecoin, the best performer among the top coins with its 34% jump, has occupied the largest share among the alts, with almost $51 million in liquidations.

FOMO Fuels Bitcoin’s 35% Jump, Options Flow Hints At Bigger Upswing

The price of Bitcoin seems on the brink of blasting past its all-time high (ATH) at the high area of its current levels. The cryptocurrency has been on a bull run due to the launch of spot Bitcoin Exchange Traded Funds (ETF), which officially onboarded institutions to the nascent sector.

As of this writing, Bitcoin (BTC) trades at around $62,900 with a 3% profit in the last 24 hours. In the previous week, the cryptocurrency recorded a critical 22% profit. It stood as one of the three top gainers in the top 10 by market cap, only surpassed by Solana (25%) and Dogecoin (57%) in the same period.

Bitcoin BTC BTCUSDT price

Bitcoin-Based Derivatives Hint At Further Gains

Data from the derivatives platform Deribit indicates a spike in long positions by Options operators. Since early February, these traders have accumulated important call (buy) contracts with a strike price above $65,000.

At first, as the report indicates, the increase in bullish positions was thought to be part of a Bitcoin “Halving” strategy. However, the BTC ETF Flows seem to be the key component behind the rally.

As cryptocurrency entered the $60,000 area, several operators rushed to accumulate call contracts, leading to a Fear Of Missing Out (FOMO) rally to its current levels. The chart below shows that the FOMO buying began when BTC breached the $57,000 level.

Bitcoin price BTC BTCUSDT chart 1 options flow

The spike in trading activity during yesterday’s session led to a significant jump in Implied Volatility (IV). Overleveraged positions further propelled the metric, Deribit stated:

The 62k to 64k surge was so quick, and with high leverage across the whole system, that when sales hit the market a cascade sent BTC down to 59k in 15mins, and some Alts (also massively leveraged) dropped 50% on some exchanges before promptly bouncing as BTC jumped to 61.5k.

As the market continues to experience sudden moves due to the high IV, there is little change in the market structure in the derivatives sector. In other words, Deribit still records a lot of bullish positions for the coming months, which suggests optimistic conviction by these players.

BTC Price On The Short Timeframe

Despite the bull run, the Bitcoin price could dip as euphoria takes over the market. According to economist Alex Krüeger, the spike in trading volume across the derivatives sector indicates the formation of a “local top.”

The analyst believes that retail has returned to the market driven by FOMO, which often hints at short-term predicaments for long traders. Krüger predicted further gains into the $70,000 area via his official X account and then a drop into the $55,000 area.

The analyst stated:

ATH are inches away. That’s price discovery territory. Thus very easy for things to get even crazier. This is just not where one opens new longs. Too easy to get a quick flush out of nowhere. Ideally we see funding cool down and price consolidate below ATH then break out.

Cover image from Dall-E, Chart from Tradingview

Justin Sun Moves $100M To Binance, Stacking Ethereum?

Justin Sun, the co-founder of Tron–a smart contracting platform for deploying decentralized applications (dapps), is once again moving and shuffling millions of dollars. According to Lookonchain data on February 29, Sun reportedly transferred 100 million USDT to Binance, days after moving huge sums earlier this week.

Justin Sun moves $100 million USDT to Binance | Source: Lookonchain via X

Justin Sun Holds Millions Of ETH: Will The Co-founder Buy More?

From February 12 to 24, a wallet associated with Sun acquired 168,369 ETH for an average price of $2,894. This purchase, valued at roughly $580.5 million, currently holds an unrealized profit of around $95 million. Profitability could increase considering the sharp demand for crypto, especially top coins like Bitcoin and Ethereum, in recent days.

Ethereum price trending upward on February 29 | Source: ETHUSDT on Binance, TradingView

The Ethereum price chart shows that ETH has been on a clear uptrend, rising from around $2,200 in early February to over $3,450 when writing. At this pace, and considering the institutional interest in potent crypto assets, including ETH, the odds of the second most valuable coin stretching gains will be highly likely.

As Bitcoin inches closer to $70,000, the probability of Ethereum also tracking higher toward its all-time high of around $5,000 will be elevated.

Since ETH already owns a big stash of coins, there is speculation that the co-founder will double down, buying even more coins. The crypto community will continue watching the address until this happens and there is solid on-chain data to support the purchase.

Spot Ethereum ETFs And The Dencun Upgrade Are Key Updates

So far, optimism is high, especially among the broader altcoin community. As Bitcoin races to register new all-time highs pumped by institutional billions, eyes will be on the United States Securities and Exchange Commission (SEC). There are multiple applications for a spot Ethereum exchange-traded fund (ETF). 

The agency has not provided a definitive timeline for approving or rejecting the derivative product. There is regulatory uncertainty around the status of ETH, a significant headwind that might delay or even prevent the timely authorization of this product.

Still, the community is looking forward to the next communication in May. If the spot Ethereum ETF is a go, the coin will likely rally to new all-time highs, following Bitcoin.

However, before then, eyes are on the expected implementation of Dencun. The upgrade addresses challenges facing Ethereum, including scalability. Through Dencun, Ethereum developers hope to lay the base for further throughput enhancements in the coming years.

With higher throughput, transaction fees drop, overly improving user experience. This upgrade might go a long way in cementing Ethereum’s role in crypto, wading off stiff competition from Solana and others, including the BNB Chain.

Crypto Expert Reveals Why Bitcoin Can Rise To $400,000

February was undoubtedly an amazing month for Bitcoin, with the cryptocurrency going on a 39% surge to cross over $60,000. Notably, price history has shown this is the second most profitable February in the history of Bitcoin and the most profitable February in 11 years. 

Indeed, many market players have anticipated this price surge to continue throughout 2024 as the next Bitcoin halving approaches. According to an analysis from trading expert Peter Brandt, the price of BTC is set to skyrocket to $400,000 after the next halving.

Crypto Expert Peter Brandt Predicts Bullish BTC Price Points After Halving

Bitcoin halvings, which slashes the mining reward for miners into two, are known to trigger massive bull runs before and after they are completed. Indeed, the pre-halving bull run seems to have repeated itself, as Bitcoin has jumped over multiple resistance levels since the beginning of January and is now nearing its all-time high of $69,000, which it reached in November 2021.

Brandt’s analysis is majorly based on gains after past halvings as a percentage of gains before halvings. Consequently, the analyst projected past price behavior into the future after April’s halving is completed. 

Per his analysis, BTC’S current cycle reached its low in November 2022 and is now at 75 bars (weekly bars). If the bull trend extends 75 bars after the next halving, a price high of $150,000 is estimated to occur in early October 2025. 

Brandt’s analysis also pointed out three different scenarios that occurred after the last three halvings. After the first halving in 2012, Bitcoin went on a 5x gain as a percentage of its pre-halving gains. If the same were to happen after 2024’s halving, Bitcoin could reach $275,000. 

Similarly, 2016’s halving saw Bitcoin going on an 8x gain of its pre-halving gains. If Bitcoin were to go on a similar 8x route, it could reach as high as $400,000 before the next market phase. Lastly, 2020’s halving produced a modest 2x return of its pre-halving gains. A 2x repeat applied to a BTC price of $50,000 would see the crypto reaching $100,000 at the end of the current market phase. 

Bitcoin Set To Keep Shining

At the time of writing, Bitcoin is trading at $62,600, up by 21.25% in the past seven days. From a technical perspective, Bitcoin looks prime to continue on its bull run in the current market cycle with virtually no resistance

On-chain fundamentals point to increased accumulation from traders. Data shows that even short-term holding whales are now sitting on over $7.3 billion in unrealized profit, but they still continue to hold. If this bullish sentiment continues, we could see Bitcoin reaching a new all-time high in March.

Bitcoin price chart from Tradingview.com

Bitcoin MVRV Hits Levels That Lead To Parabolic Bull Run In 2020

On-chain data shows the Bitcoin MVRV ratio is currently at the same high levels as those that led to the parabolic bull run back in 2020.

Bitcoin MVRV Ratio Has Shot Up As Latest Rally Has Occurred

As pointed out by CryptoQuant founder and CEO Ki Young Ju in a post on X, the MVRV ratio has just hit a value of 2.5. The “Market Value to Realized Value (MVRV) ratio” is a popular on-chain indicator that keeps track of the ratio between the Bitcoin market cap and the realized cap.

The “realized cap” here refers to a capitalization model for BTC that assumes that the real value of any token in circulation is not its current spot price (as the market cap takes it to be), but rather the value at which the coin was last transferred on the network.

The previous transaction for any coin may be considered the last time it changed hands, which implies that the price at the time would be its current cost basis. As such, the realized cap adds up the cost basis of every token in circulation.

This means that the realized cap essentially keeps track of the total amount of capital that the investors have used to purchase their Bitcoin. Since the MVRV ratio compares the market cap (that is, the value the investors are holding right now) against this initial investment, its value can tell us about the amount of profit or loss the investors as a whole are currently carrying.

Now, here is a chart that shows the trend in the Bitcoin MVRV ratio over the history of the cryptocurrency:

Bitcoin MVRV ratio

As is visible in the graph, the Bitcoin MVRV ratio has rapidly climbed up as the asset’s price has gone through its latest rally. In this surge, the metric has managed to exceed the 2.5 level.

When the ratio is greater than 1, it means that the market cap is higher than the realized cap right now, and thus, the overall market is holding its coins at some profit. A value of 2.5 implies the average wallet is currently carrying gains of 150%.

“In Nov 2020, MVRV was 2.5 at $18K, preceding the all-time high and parabolic bull run,” explains Ju. Back in that bull run, the peak of the first half of 2021 wasn’t hit until the MVRV ratio crossed the 3.7 mark, just like the two bull runs preceding it.

The top in November 2021, however, didn’t follow this pattern, as it formed close to the 3.0 level. It now remains to be seen which path Bitcoin would take in its current rally, if it is at all similar to either of these.

BTC Price

Following Bitcoin’s impressive 22% rally over the past week, the asset’s price is now trading around the $62,800 level, not very far from setting a new all-time high now.

Bitcoin Price Chart

Bitwise CEO Says Bitcoin At $250,000 Is Closer Than You Think

Hunter Horsley, the Chief Executive Officer (CEO) of crypto index fund manager, Bitwise, has stayed highly optimistic about the Bitcoin bullish outlook, predicting that the cryptocurrency will witness a rise to $250,000 sooner than most think.

BTC’S Road To $250,000

In a recent X (formerly Twitter) post on Wednesday, Horsley made a bold prediction about Bitcoin, foreseeing the cryptocurrency rising to new all-time highs never seen before. The CEO has stated that BTC could reach $250,000, jumping over four times its current price above $62,000. 

Furthermore, Horsley has expressed his belief that BTC could rival gold in the future. He anticipates that the fast-rising cryptocurrency would “eat into gold’s Total Addressable Market (TAM) faster than people expect.”

Highlighting Bitcoin’s formidable potential in relation to hold, on Wednesday, February 28, Spot Bitcoin ETFs dominated Gold ETFs in the market, with over $578 million flowing into Spot Bitcoin ETFs while gold ETFs experienced outflows of $17 million. These substantial inflows underscore the rising demand and potential superiority of Spot Bitcoin ETFs over gold ETFs

The Bitwise CEO has also revealed that Spot Bitcoin ETFs were BTC’S Initial Public Offering (IPO) moment. Consequently, these investment assets have enhanced BTC’S accessibility for both institutional and retail investors, increasing its exposure and propelling the market value forward by tenfold. 

While Horsley has not provided a specific timeline for his $250,000 Bitcoin prediction, the CEO has maintained a long-term bullish outlook for the cryptocurrency. He has also emphasized the need to invest in BTC, stating that “waiting was costly” and yesterday’s price should serve as a reminder to seize any opportunity to purchase Bitcoin.  

Bitcoin Shows No Signs Of Slowing Down

According to Horsley, Bitcoin is showing no signs of stopping its upward momentum anytime soon. The Bitwise CEO has revealed that the price of the cryptocurrency is likely to accelerate rather than slow down. 

At the time of writing, BTC is trading at a price of $62,142, reflecting a substantial 8.77% increase in just 24 hours. At one point yesterday, the cryptocurrency was trading above $57,000. However, after achieving unprecedented gains, Bitcoin has successfully crossed the coveted $60,000 price mark and is rapidly approaching its overall all-time high of $68,789 in November 2021. 

Horsley has disclosed that this rapid rise in Bitcoin’s price is largely attributed to the success of the Spot Bitcoin ETFs. He has highlighted the possibility of the entire United States capital markets investing in Spot Bitcoin ETFs for the first time, providing a massive opportunity to boost Bitcoin’s adoption and increase the value of the cryptocurrency.

Bitcoin price chart from Tradingview.com

Altcoins Season: Analyst Predicts 2x Surge Post-Bitcoin Rally

Amid the recent bullish sentiment around the crypto market, investors and traders anticipate that altcoins will attract notable gains post-Bitcoin rally.

Altcoins Poised For A 2X Surge After Bitcoin Rally

Michael Van De Poppe, a well-known cryptocurrency analyst, has shared his insights regarding altcoins with the community on the social media platform X (formerly Twitter). His predictions examine the potential for altcoins to rise in the near future.

Poppe started by highlighting that the market capitalization of Altcoin is presently “lagging behind” in this recent market rally. However, he noted that is what tends to happen when investors’ “strength is confined to Bitcoin alone.”

It is noteworthy that in the past, altcoins generally performed poorly whenever Bitcoin was in control of the market. But despite the performance of the tokens lately, Poppe’s optimism remains unwavering.

Altcoins

Due to this, the crypto analyst anticipates altcoins to rise by 2x in the short term. However, according to the expert, the uptick is expected to take place “once BTC’s rally stabilizes.”

The post read:

The Altcoin market capitalization is still lagging behind and that is usually what happens when strength is surrounded by Bitcoin alone. However, once Bitcoin is going to stabilize, it seems we will likely have a potential 2x on altcoins to come.

This hope stems from the notion that gains from Bitcoin might be transferred to alternative currencies. When this happens, altcoins such as Ethereum (ETH), Cardano (ADA), and XRP will be positioned for significant gains.

Van De Poppe’s insights have triggered a wave of speculation within the community, with members expressing excitement about the forecast. A pseudonymous X user responded by saying that it is “fascinating how the ebb and flow of altcoin market cap in BTC’s shadow.”

He further claimed that when BTC stabilizes, the 2x surge in value will be practically inevitable. In addition, he asserted that the perceptive observer will always be intrigued by the complex interplay between these assets.

Investment Shift Toward Alternative Cryptocurrencies

Even though altcoins are currently struggling to gain adoption from market investors and traders, several analysts are still bullish about the tokens, forecasting a notable rise in the landscape after Bitcoin’s surge has cooled down.

Poppe is just one of the crypto analysts who is bullish on these cryptocurrencies. Altcoin Rover, a crypto expert, has also expressed his optimism while noting an investment shift towards these tokens.

According to the analyst, he will be “selling his Bitcoin holdings to purchase several altcoins” poised for notable growth. Rover also clarified the possibility of significant gains for altcoins following BTC surpassing its all-time high.

The expert has pointed out a path investors should observe that leads to the “Altseason.” This path cited by Rover, which comprises four distinct phases, basically never changes. 

Crypto Market Cap

Where Are We In This Bitcoin Cycle? Galaxy Lead Researcher Answers

In a comprehensive analysis shared via X (formerly Twitter), Alex Thorn, the Head of Firmwide Research at Galaxy, delved into the intricacies of the current Bitcoin market cycle, answering the question “Where Are We In This Bitcoin Cycle?” As Bitcoin trades robustly around $62,000, with a notable spike to $64.000 yesterday, the crypto landscape is witnessing unprecedented dynamics, marked by a surge in ETF inflows, strategic acquisitions by corporate entities, and a palpable shift in investor sentiment towards digital assets.

Thorn emphasized how different this cycle is:

Effectively, the bull runs of 2017 and 2020 hadn’t yet begun at this stage in Bitcoin’s supply schedule.

52 days before 2nd Halving (9-JUL-16) BTCUSD $455.22 (-59.86% from ATH)
52 days before 3rd Halving (11-MAY-20) BTCUSD $6,174 (-68.56% from ATH)
52 days before 4th Halving (20-APR-24) BTCUSD $59,330 (-12.16% from ATH)

Why This Bitcoin Cycle Is Different

Central to his analysis is the record-breaking influx of capital into spot Bitcoin ETFs, with Thorn highlighting, “The BTC ETFs took in a whopping net $576m of BTC yesterday (Tuesday Feb. 27), with BlackRock alone seeing $520m of inflows, its largest ever day.” This significant movement of funds not only underscores the growing institutional interest in Bitcoin but also marks a pivotal moment in the cryptocurrency’s journey towards mainstream financial recognition.

A key aspect of Thorn’s analysis is the unwavering strength of Bitcoin’s long-term holder base, which he estimates to hold about 75% of the total BTC supply. “Long-term holders are still mostly holding strong,” Thorn notes, emphasizing the community’s resilience and faith in Bitcoin’s long-term value proposition. This demographic, characterized by their ‘diamond hands’, plays a crucial role in stabilizing the market and buffering against the volatility that often defines the crypto space.

Bitcoin HODLers

Thorn further elaborates on the analytical tools and metrics that provide insight into Bitcoin’s market behavior. He introduces the MVRV Z-Score, a novel approach to understanding the cyclicality of Bitcoin’s price action by comparing its market value to its realized value. This metric offers a window into the perceived overvaluation or undervaluation of Bitcoin at any given point. Currently, the MVRV Z-Score is close to 2, while previous cycle tops saw the metric spike to 8 (in 2021) or even above 12 (in prior halving cycles).

Bitcoin MVRV Z-Score

Addressing the speculation around the acceleration of the Bitcoin cycle, Thorn firmly dispels concerns that the market is prematurely peaking. He argues against the notion that we are “speedrunning the ‘cycle’”, instead asserting that the advent of Bitcoin ETFs in the United States represents a transformative shift with far-reaching implications. “This time is different,” Thorn asserts, pointing to the ETFs’ disruption of traditional Bitcoin price cycles and their impact on investor behavior and intra-crypto dynamics.

The Spot Bitcoin ETF Effect

Thorn underscored the transformative impact of Bitcoin ETFs, positing that we are merely at the beginning of a significant shift in how Bitcoin is accessed and invested in, particularly by the institutional sector. “Despite incredible volumes and flows, there’s plenty of reason to believe that the Bitcoin ETF story is still just getting started,” he stated, pointing to the untapped potential within the wealth management sector.

In their October 2023 report titled “Sizing the Market for the Bitcoin ETF,” Galaxy laid out a compelling case for the future growth of Bitcoin ETFs. The report highlights that wealth managers and financial advisors represent the primary net new accessible market for these vehicles, offering a previously unavailable avenue for allocating client capital to BTC exposure.

The magnitude of this untapped market is substantial. According to Galaxy’s research, there is approximately $40 trillion of assets under management (AUM) across banks and broker/dealers that has yet to activate access to spot BTC ETFs. This includes $27.1 trillion managed by broker-dealers, $11.9 trillion by banks, and $9.3 trillion by registered investment advisors, cumulating to a total US Wealth Management AUM of $48.3 trillion as of October 2023. This data underscores the vast potential for Bitcoin ETFs to penetrate deeper into the financial ecosystem, catalyzing a new wave of investment flows into Bitcoin.

Thorn further speculated on the upcoming April round of post-ETF-launch 13F filings, suggesting that these filings might reveal significant Bitcoin allocations by some of the largest names in the investment world. “In April, we will also get the first round of post-ETF-launch 13F filings, and (I’m just guessing here…) we are likely to see some huge names have allocated to Bitcoin,” Thorn anticipated. This development, he argues, could create a feedback loop where new platforms and investments drive higher prices, which in turn attracts more investment.

The implications of this feedback loop are profound. As more wealth management platforms begin to offer access to Bitcoin ETFs, the influx of new capital could significantly impact BTC’s price dynamics, liquidity, and overall market structure. This transition represents a key moment in the maturation of Bitcoin as an asset class, moving from a speculative investment to a staple in diversified portfolios managed by financial advisors and wealth managers.

We Are Still Early

Thorn’s optimism extends beyond the immediate market indicators to the broader implications of Bitcoin’s integration into the financial mainstream. He anticipates a new all-time high for Bitcoin in the near term, fueled by a combination of factors including the ETFs’ momentum, increasing acceptance of BTC as a legitimate asset class, and the anticipatory buzz surrounding the upcoming halving event. “All this is to say, my answer to that burning question – where are we in the cycle? – is that we haven’t even begun to reach the heights this is likely to go,” he concludes.

Thorn’s analysis culminates in a bullish forecast for Bitcoin. As the community stands on the cusp of the fourth BTC halving, Thorn’s insights offer a compelling vision of a market poised for unprecedented growth, driven by a confluence of technological innovation, regulatory evolution, and shifting global economic currents. “Bitcoin is prime time now, and while it might be hard to believe, things are just starting to get exciting,” Thorn declares, capturing the essence of a market at the threshold of a new era.

At press time, BTC traded at $62,065.

Bitcoin price

Bitcoin Poised To Reclaim $64K, Now Back Halfway To $63,000 – New ATH Coming For March?

In a blazing start to March, the feverish activity of Bitcoin has set it up for its largest monthly increase in almost three years early Thursday. Money pouring into listed bitcoin funds is fueling a huge gain, and bitcoin is now just a stone’s throw away from a record high.

Investor Frenzy As Bitcoin Set To Reclaim $64K

The primary cryptocurrency rose as much as 14% late Wednesday to momentarily reach $64,000 — its first move above $60,000 since November 2021 — before reversing part of the gains.

BTC was trading at $62,540 as of this writing, according to data from Coingecko.

Due to “fear of missing out” on potential price increases, investors are rushing to buy cryptocurrencies, which brings back memories of the crypto bull market that drove the main cryptocurrency asset to a record high of around $69,000 in November 2021.

Since the beginning of the year, the value of bitcoin has more than tripled, recovering from a 64% decline in 2022. That is an incredible recovery from a slew of scandals and bankruptcy that had cast doubt on the sustainability of digital assets.

Meanwhile, the sudden changes in price have been whipsawing both bulls and bears. According to CoinGlass, centralized exchanges had short liquidations of $176 million and long liquidations of $86.1 million over the previous day.

Crypto Rising

After prices crashed during the “crypto winter” of 2022, investors lost interest in spot bitcoin exchange-traded funds. However, this year’s approval and introduction of these funds to the US market has rekindled interest in cryptocurrencies.

According to LSEG statistics, the top 10 spot bitcoin ETFs saw inflows of $420 million on Wednesday alone, the highest amount in nearly two weeks. Voltages increased when the three most well-known, operated by Grayscale, Fidelity, and BlackRock (IBIT.O), ignited a whole new interest.

Ahead of April’s halving event, which occurs every four years and reduces the rate at which tokens are generated by half as well as the prizes paid to miners, more traders have now been flocking to bitcoin.

What The Experts Are Saying

“Bitcoin optimism is fueled by factors like spot BTC ETF inflows, the imminent halving reducing new issuance, and renewed confidence in the crypto asset class, according to Jonathon Miller, managing director at Kraken Australia.”

“When people see these kinds of increases in a short period of time . . . then it just draws in people and Fomo does kick in,” said Timo Lehes, co-founder of blockchain company Swarm.

“It’s just insane.”

“We could see the all-time high being broken any day now,” said Simon Peters, an analyst at trading firm eToro. “The driving force behind it is without a doubt the [bitcoin funds].”

A New ATH This March?

As Bitcoin experiences brief but notable fluctuations, reaching $64,000 before retracing to the $62,000 mark, the cryptocurrency market remains dynamic and full of anticipation. Investors and enthusiasts are closely monitoring the price movements, speculating on the possibility of a new all-time high (ATH) in March.

Featured image from Pexels , chart from TradingView

Bitcoin Price Sees Wild Swing Moves, Uptrend To Extend Toward $70K?

Bitcoin price rallied further above $62,000. BTC is now consolidating gains and might soon attempt another upward move toward the $64,000 resistance.

  • Bitcoin price is consolidating gains below the $60,000 resistance zone.
  • The price is trading above $60,500 and the 100 hourly Simple moving average.
  • There is a connecting bullish trend line forming with support at $60,950 on the hourly chart of the BTC/USD pair (data feed from Kraken).
  • The pair could extend its current rally toward the $64,000 resistance zone.

Bitcoin Price Jumps Over $5K

Bitcoin price remained strong above the $58,000 resistance zone. BTC formed a fresh support base and started another rally. It gained over 10% and broke many hurdles near $60,000 and $62,000.

The price even surged toward the $64,000 level. A new multi-week high was formed near $64,000 before there was a sharp decline after the Coinbase outage. The price dived toward the $58,000 support zone. A low was formed near $57,919 and the price started a fresh rally.

It is back above the $60,000 resistance. There was a move above the 50% Fib retracement level of the downward move from the $64,000 swing high to the $57,919 low.

Bitcoin is now trading above $60,000 and the 100 hourly Simple moving average. There is also a connecting bullish trend line forming with support at $60,950 on the hourly chart of the BTC/USD pair. Immediate resistance is near the $62,500 level. It is near the 76.4% Fib retracement level of the downward move from the $64,000 swing high to the $57,919 low.

Bitcoin Price

Source: BTCUSD on TradingView.com

The next key resistance could be $64,000, above which the price could rise toward the $65,000 resistance zone. If the bulls remain in action, the price could even surpass $65,000 and test $66,400. The main hurdle for them is visible near the $68,000 zone.

Are Dips Supported In BTC?

If Bitcoin fails to rise above the $62,500 resistance zone, it could start a downside correction. Immediate support on the downside is near the $60,800 level and the trend line.

The first major support is $60,000. If there is a close below $60,000, the price could start a decent pullback toward the $58,000 zone. Any more losses might send the price toward the $56,500 support zone.

Technical indicators:

Hourly MACD – The MACD is now gaining pace in the bullish zone.

Hourly RSI (Relative Strength Index) – The RSI for BTC/USD is now above the 50 level.

Major Support Levels – $60,800, followed by $60,000.

Major Resistance Levels – $62,500, $64,000, and $65,000.

Renowned Economist Says Bitcoin Isn’t Digital Gold, Then What Is It?

Chief Economist and Bitcoin antagonist, Peter Schiff has made another controversial statement about BTC, comparing the world’s largest cryptocurrency to gold, while expressing skepticism about BTC being lauded as the “digital gold.”

Bitcoin Is “Digital Anti-Gold”

In a February 27 post on X (formerly Twitter), Schiff publicly criticized Bitcoin’s title as the digital gold, asserting that the cryptocurrency should be seen as a bet against gold instead of a digital counterpart of the precious metal. While the renowned economist has stated that “Bitcoin is not digital gold,” he has also provided his version of a more accurate description of Bitcoin, characterizing the cryptocurrency as a “digital anti-gold.”

Earlier in November 2023, ARK Invest CEO, Cathie Woods declared Bitcoin to be a digital gold, confidently stating that she would rather wager on Bitcoin than gold. Similarly, Chief Executive Officer (CEO) of MicroStrategy, Michael Saylor and CEO of VanEck, Jan van Eck, have confirmed BTC to be the ultimate store of value. 

These sentiments and statements from renowned BTC investors and leading cryptocurrency supporters clearly contrast Schiff’s perspective on BTC. The global strategist is well known for his opposing views against BTC and other cryptocurrencies, often criticizing the value of these digital assets and informing the broader crypto community of the risks associated with cryptocurrencies while glorifying gold’s value. 

The economist has remained critical of Bitcoin’s perceived role as a digital store of value, highlighting that BTC buyers should hope for the sustained control of inflationary pressures and the ongoing strength of the United States dollar (USD) against other fiat currencies.

Crypto Community In Opposition

The crypto community has swiftly offered their personal opinions on Schiff’s statement about Bitcoin, opposing the Bitcoin antagonist’s views and showcasing their relentless support for the cryptocurrency. 

One crypto community member has asserted that Schiff’s Bitcoin remarks lack theoretical validity, stemming from a fundamental misunderstanding and fear of BTC’s value and potential. Another member has highlighted the differences between gold and Bitcoin, describing the cryptocurrency as a “tech innovation” which has nothing to do with precious metals like gold. 

The majority of crypto members have shown unwavering support for BTC, with some even stating that Bitcoin could potentially surpass the value of gold in the future.

“Bitcoin is going to consume gold. It’s not a matter of if, it’s a matter of when,” a community member stated.

Bitcoin price chart from Tradingview.com

Altcoin Market Cap Break From “Wyckoff Accumulation Phase”: Will Ethereum, XRP Fly?

In a post on X, one analyst observes that the altcoin market capitalization has broken from the Wyckoff accumulation phase. With this upswing, the trader expects altcoin prices to move higher.

This refreshing breakout coincides with Bitcoin’s (BTC) stellar performance when writing on February 28. At spot rates, the coin is trading above $60,000, a psychological round number- now supported- and is closely approaching $70,000. 

The Altcoin Breakout From Accumulation

The “Wyckoff accumulation pattern” is a concept developed by technical analysts to pick out potential buying opportunities, in this case, altcoins. Whenever prices are in this phase, it is widely believed that the so-called “smart money” or large institutional players are accumulating at low prices. 

Altcoin market cap breaking out | Source: Analyst on X

Currently, prices consolidate at tight ranges and with low trading volumes. A signal marking the end of this accumulation is a sharp breakout, lifting prices above the defined range. Often, this upswing is with rising trading volume. 

Looking at the chart, the altcoin market cap has broken above the accumulation phase. With previous resistance and support, the altcoin market cap will likely continue floating higher. As such, top altcoins, including Ethereum (ETH), Solana (SOL), and XRP, will follow suit, posting fresh 2024 highs. 

Why Spot Bitcoin ETFs Give BTC Edge In This Bull Run

So far, Bitcoin is leading the way, posting over $10,000 in less than a week. However, with the coin trading above $60,000, its demand-side drivers differ entirely from what’s influencing altcoins. The approval of spot Bitcoin exchange-traded funds (ETFs) by the United States Securities and Exchange Commission (SEC) has seen billions of dollars flow to the world’s first cryptocurrency.

Therefore, while altcoins have historically outperformed BTC when crypto prices rally, there is an edge with spot Bitcoin ETFs. As such, this bull run will likely differ from 2017 and 2021. This forecast is because institutions will likely favor a regulated asset over altcoins whose status remains undefined. 

Ethereum price trending higher on the daily chart | Source: ETHUSDT on Binance, TradingView

As of late February 2024, the United States SEC has not approved spot ETFs of any altcoin, including that of Ethereum. Additionally, the agency has labeled several top altcoins, including Cardano (ADA), unregistered securities. The agency even filed lawsuits against major exchanges like Binance and Coinbase, accusing them of facilitating the trading of what the commission described as “unregistered securities.”

It is not immediately clear whether the United States SEC will change their preview of leading altcoins, especially Ethereum (ETH), which has a market of over $400 billion. Wall Street heavyweights like BlackRock and Fidelity remain interested in launching spot Ethereum ETFs. 

Analyst Labels Bitcoin Rally Strongest Pre-Bull Cycle Yet

The entire cryptocurrency space is fueled with excitement as the price of Bitcoin rallied today, demonstrating immense resilience, reaching the $59,000 threshold and even further in the past 26 months.

Bitcoin Rally Kicks Off The Strongest Pre-Bull Cycle So Far

Bitcoin is currently in the limelight as the crypto asset continues to rally, leading to several analysts identifying the surge as the start of the “biggest bull cycle ever.”

Analyst and trader Crypto Jelle has labeled the recent uptick as the “strongest start to a new cycle” as his analysis examines the strength of BTC‘s surge.

Jelle claims this resulted from Bitcoin’s latest “break out from the 0.618 Fibonacci retracement.” According to the analyst, “this marks the first time” the asset has made this kind of move “before the Bitcoin Halving event happens.”

Bitcoin

He also claims that with the ongoing rally, it seems like the market is “in for a new regime,” he believes things will play out “differently” in the market from how they usually do.

The post read:

This is the first time Bitcoin breaks that 0.618 Fibonacci retracements before the halving event even takes place. By far the strongest start to a new cycle, ever. Looks like we are in for a new regime, where things work a little different than how they used to.

The analyst claims that a shift in the narrative is ushering in a “new era of dynamics in the cryptocurrency landscape.” As a result, “exciting moments await” the space in the future.

Crypto Jelle declared that nothing can stop Bitcoin at the moment. “With BTC rising by another 2% in the past few hours, there seems to be no stopping it right now,” he stated.

Additionally, most of yesterday’s gains occurred outside the Exchange-Traded Funds’ trading hours. However, the analyst is waiting to see if they will “force boomers to pursue price.”

BTC ETFs See Massive Inflow

Research company BitMEX reported that Bitcoin Spot ETFs have seen increased adoption, witnessing a massive surge in daily inflow. Data from the platform shows that ETFs have witnessed a significant inflow of 10,167 BTC valued at $576.8 million.

BitMEX underscored that Blackrock’s iShares BTC ETF (IBIT) made up $520 million of the total inflow. Consequently, this marks the highest inflow the company has seen since the products were approved. 

So far, Blackrock’s asset holdings have risen to over 141,000 BTC, and its net inflow sits above $6.5 billion. Currently, Bitcoin is trading at $59,254, indicating a rise of over 4% in the past 24 hours. 

Bitcoin BTC BTCUSDT chart 1