Bitcoin Price Rejects $70K, Here Are Key Levels To Watch

Bitcoin price is still struggling to clear the $70,000 resistance. BTC is slowly moving lower and might soon drop toward the $67,000 support.

  • Bitcoin price is struggling to clear the $69,500 and $70,000 levels.
  • The price is trading above $68,000 and the 100 hourly Simple moving average.
  • There is a key bullish trend line forming with support at $68,000 on the hourly chart of the BTC/USD pair (data feed from Kraken).
  • The pair could continue to move down and trade toward the $67,000 support zone.

Bitcoin Price Starts Consolidation

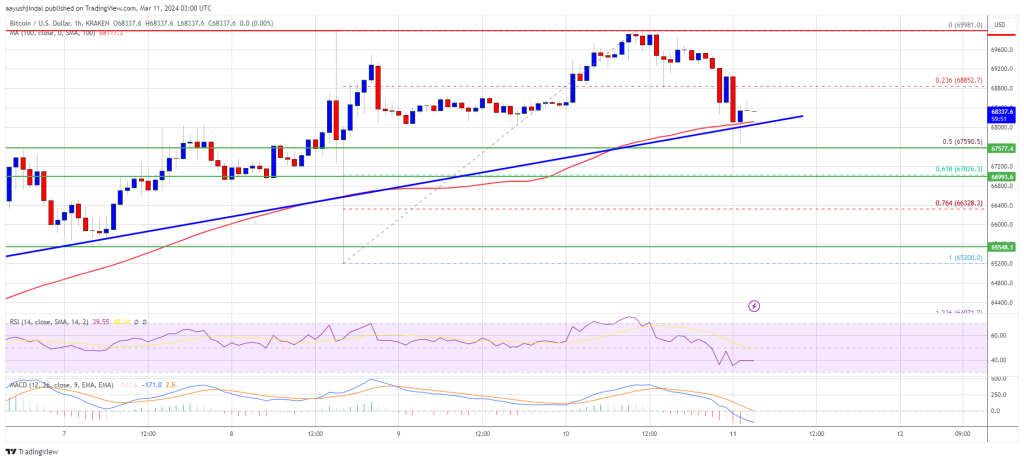
Bitcoin price made another attempt to gain strength above the $69,000 level. BTC cleared the $69,500 level, but the bears were active near the $70,000 resistance zone.

A high was formed at $69,981 and the price started a downside correction. There was a move below the $69,500 and $69,200 levels. The price declined below the 23.6% Fib retracement level of the upward wave from the $65,200 swing low to the $69,981 high.

Bitcoin is now trading above $68,000 and the 100 hourly Simple moving average. There is also a key bullish trend line forming with support at $68,000 on the hourly chart of the BTC/USD pair. The trend line is close to the 50% Fib retracement level of the upward wave from the $65,200 swing low to the $69,981 high.

Immediate resistance is near the $68,850 level. The next key resistance could be $69,200, above which the price could rise toward the $69,500 resistance zone.

Bitcoin Price

Source: BTCUSD on TradingView.com

If there is a clear move above the $69,500 resistance zone, the price could even attempt a move above the $70,000 resistance zone. Any more gains might send the price toward the $72,000 level.

More Losses In BTC?

If Bitcoin fails to rise above the $68,850 resistance zone, it could start another decline. Immediate support on the downside is near the $68,000 level and the trend line.

The first major support is $67,000. If there is a close below $67,000, the price could start a decent pullback toward the $65,500 level. Any more losses might send the price toward the $64,400 support zone.

Technical indicators:

Hourly MACD – The MACD is now gaining pace in the bearish zone.

Hourly RSI (Relative Strength Index) – The RSI for BTC/USD is now below the 50 level.

Major Support Levels – $68,000, followed by $67,000.

Major Resistance Levels – $68,850, $69,200, and $69,500.
Bitcoin Blasts Past $70,000 In Wild Week To Register New All-Time High

The price of bitcoin has shattered records by briefly surging past the $70,000 mark earlier today, signaling a renewed wave of enthusiasm among investors. The top cryptocurrency experienced a steady climb throughout the week with a sustained 12% rally, aided by the introduction of spot bitcoin exchange-traded funds (ETFs) in the United States.

At the time of writing, Bitcoin has settled within the $69K level, and trading at $69,436 with a 2% gain the last 24 hours, data from Coingecko shows. Bitcoin reached a peak of $70,171, surpassing its previous record set earlier in the week.

Notably, the upswing aligns with the opening of the US stock market, indicating a synchronization of significant crypto movements with traditional stock trading hours. This milestone comes as a result of growing market optimism and anticipation surrounding the upcoming halving event.

ETF Surge And Investor Sentiment

The recent introduction of Bitcoin ETFs by prominent financial institutions such as BlackRock and Fidelity has undoubtedly played a significant role in the latest price surge. These ETFs have garnered immense attention and investor interest, with a staggering inflow of $900 million recorded this week alone.

Despite the highly volatile market conditions, the successful launch and functioning of these ETFs have instilled confidence in crypto market enthusiasts, reinforcing their belief in the potential of bitcoin.

Bitcoin Halving Event And Supply Cap

Bitcoin’s upcoming halving event has been a major topic of discussion among cryptocurrency enthusiasts. This event, which occurs approximately every four years, involves cutting the reward for mining new blocks in half.

The purpose of this process is to gradually reduce the rate at which new bitcoins are generated, ultimately capping the total supply at 21 million, as outlined in the cryptocurrency’s original white paper. The anticipation surrounding the halving event has contributed to the positive sentiment and gradual ascent of bitcoin’s price.

Volatility And Market Corrections

While bitcoin’s recent surge to new heights is undoubtedly impressive, it is essential to acknowledge the inherent volatility of the cryptocurrency market. As Antoni Trenchev, co-founder of crypto exchange Nexo, aptly puts it, “Navigating old highs is notoriously tricky, and the bitcoin dam doesn’t tend to burst at the first time of asking.”

The recent sell-off in bitcoin, characterized by sudden price drops, is considered by Trenchev as a healthy and necessary correction before further gains can be achieved. This volatility is a defining characteristic of bitcoin bull markets, and investors should brace themselves for potential sudden fluctuations.

Bitcoin’s Impact On Traditional Markets

It is worth noting that bitcoin’s price movements are increasingly intertwined with traditional stock trading hours, particularly in the United States. The introduction of spot bitcoin ETFs has led to a convergence of crypto and stock market activities during regular trading hours.

This shift has significant implications for investors and traders, as it expands the opportunities for synchronized trading strategies and potentially increases market liquidity.

Looking Ahead

With bitcoin’s recent surge beyond $70,000, the cryptocurrency market is buzzing with anticipation. As the world’s first-ever digital currency continues to mirror optimism and gradually approaches new heights, investors and enthusiasts keep a close eye on the progress..

Featured image from Pexels, chart from TradingView

Crypto Analyst Says Bitcoin Is Heavily Undervalued Despite ATH, What’s The Fair Value?

Despite Bitcoin recently hitting a new all-time high (ATH) of over $70,000, crypto analyst Michaël van de Poppe believes that there is still more room for significant moves to the upside. Interestingly, he also expects that this bull cycle will be one like no other.

Bitcoin Still Heavily Undervalued

Michaël van de Poppe mentioned in an X (formerly Twitter) post that Bitcoin was still “heavily undervalued” despite hitting a new ATH. He added that the value is “way higher” and noted how the flagship crypto can help hedge against inflation and keep one’s purchasing power alive. Meanwhile, the crypto analyst believes there will be “way higher numbers” in this cycle.

Michaël van de Poppe had previously hinted at Bitcoin rising to as high as $150,000 in this bull run. Other analysts have also given similar price predictions, with the consensus that BTC will surely rise above $100,000. Other crypto analysts, including MacronautBTC, have even gone as far as predicting that Bitcoin could rise above $200,000. 

There is a growing belief that this bull cycle will be the mother of all past cycles, which could be the reason for such ambitious predictions. Moreover, this cycle has the Spot Bitcoin ETFs, something past bull runs didn’t have. These ETFs have ushered in more institutional demand for the flagship crypto, which has led to an overall increase in the demand for Bitcoin. 

Interestingly, NewsBTC previously reported that the demand for Bitcoin is significantly exceeding Miners’ supply. This development is coming at a time when miners’ rewards are set to be cut in half during the Bitcoin Halving. This would likely lead to more imbalance between the demand and supply curve, potentially leading to an exponential surge in Bitcoin’s price. 

BTC Still Has Enough Time To Hit New Highs 

Bitcoin hitting a new ATH of $70,000 is just the beginning of this bull run, as there is reason to believe this bullish momentum could run into next year. Crypto analyst Ali Martinez noted in an X post that Bitcoin has “consistently taken about 8 to 11 months to hit a market top” whenever it has shattered its previous ATH.   

With Bitcoin currently hitting new highs, the analyst added that historical patterns suggest that the next BTC market top “will be sometime between November 2024 and February 2025.” However,  Alex Thorn, Head of Research at Galaxy Digital, has warned that “bull markets are not straight lines up” and that sharp corrections should be expected along the way. 

At the time of writing, Bitcoin is trading at around $68,300, up over 2% in the last 24 hours according to data from CoinMarketCap. 

Bitcoin price chart from Tradingview.com

Bitcoin Upside Momentum Likely To Fall Even Further: Analyst

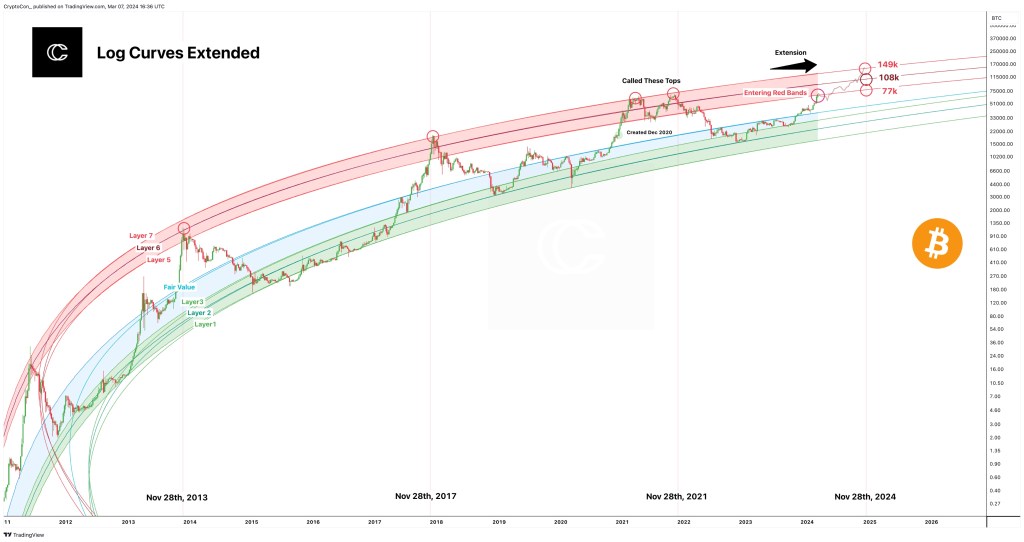
Amidst widespread bullish sentiment surrounding Bitcoin, one analyst on X thinks the leg up won’t be as strong as it was in the past few weeks. Pointing to developments in the Bitcoin log curves, the analyst expects the coin to find resistance as it attempts to break higher. 

Bitcoin Uptrend To Slow Down

The analyst doubts the current excitement around the uptrend, and technical formations advise the contrarian view. Many in the industry think Bitcoin will not only ease past $70,000, a round number nearly tested this week, but also float to $100,000 in the next few weeks. 

BTC log curves | Source: CryptoCon via X

On X, the analyst remains confident about the coin’s prospects. However, based on the Bitcoin log curve assessment, the leg up will likely be labored. The analyst compares the current price formations with the Bitcoin log curves. In 2021, the tool was used to identify price peaks.

Based on price formation, the analyst notes that if BTC peaks in 2024, then prices will likely turn around from between $77,000 and $149,000. These prospective peaks’ upper and lower bands represent layers 5 and 7 of the log curve.

Even with BTC possibly rising to $149,000, at least from the tool, the Layer 7 target is relatively lower. By factoring in a one-year slowdown in growth, the predicted peak is revised downwards from $180,000 to $149,000.

When writing, the “red band” of the log curve has been breached earlier than usual. Looking back, Bitcoin prices tend to peak three months after this breakout. 

Bitcoin price trending upward on the daily chart | Source: BTCUSDT on Binance, TradingView

That likely places Bitcoin’s peak at around the $77,000 level but below $100,000. Nonetheless, this is hard to predict, considering the volatile nature of prices and the dynamic nature of fundamental factors.

The community remains optimistic about what lies ahead. So far, Bitcoin prices have been trending at historical highs, but there has been a sharp drop in the momentum of upside.

BTC Bears In A Commanding Position

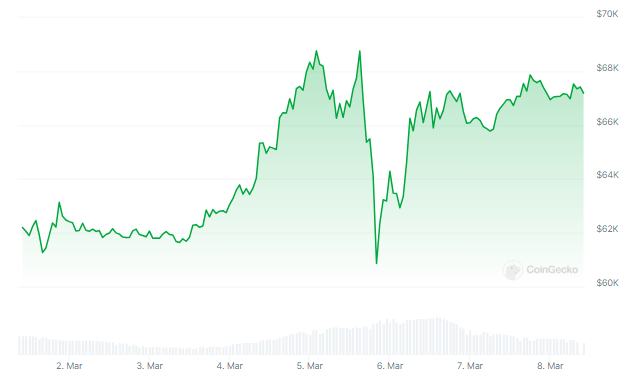
The daily chart shows that prices are still inside the bear bar of March 5. The candlestick had a high trading volume and was wide-ranging. For the uptrend to be valid, prices must break above $70,000, based on rising trading volume.

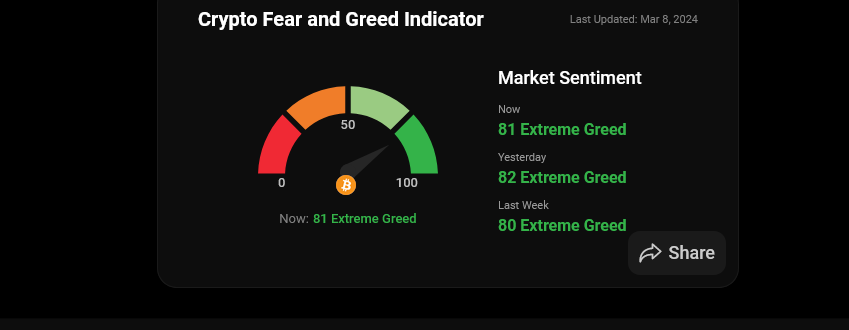
Bitcoin Fear and Greed index | Source: Coinstats

Lower prices incentivize issuers to spot Bitcoin exchange-traded funds (ETFs) to load up on dips. Their actions have spurred demand over the past few weeks, lifting sentiment and prices. According to Coinstats’ Fear and Greed Index, “extreme greed” exists in the market.

Bitcoin To $240,000: Analyst Cites Key Narrative As Catalyst

Bitcoin price has fallen by over 10% after briefly touching its all-time high of $69,000, propelled by investors’ flood of money into BTC Spot Exchange-Traded Funds (ETFs).

However, intense volatility surrounding the crypto asset’s price has triggered a rebound to the $68,000 mark, which highlights the return of positive enthusiasm, prompting predictions of a significant rally to an unprecedented height.

Key Narrative That Could Send Bitcoin To $240,000

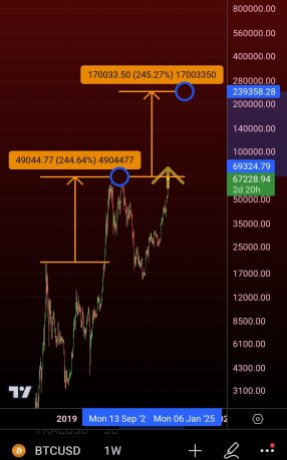
Cryptocurrency analyst and trader Matthew Hyland has shared an optimistic forecast for Bitcoin with the community on the social media platform X. The analyst has identified a key trend that could trigger a bullish rally for BTC to the $240,000 threshold.

At first, Hyland noted that over the past two years, Bitcoin has “destroyed several narratives, both positive and negative.” These include one of the ideas that BTC will “never fall below the previous cycle low or reach its peak until after the halving event.”

Bitcoin

However, Hyland claims that the only narrative left that BTC has not destroyed is the “Diminishing Returns,” as it is still almost 100% effective. Hyland is uncertain of the narrative’s effect but believes that it is the “final boss” since it is the only one still standing.

As a result of the trend, the crypto expert has set his price target at $240,000 in the upcoming months. This simply means BTC needs to surpass the aforementioned price in order to be able to demolish the diminishing returns narrative.

Hyland claims it makes no difference to him if Bitcoin “reaches the level or not.” Nonetheless, it will be “intriguing” to observe whether it can smash the one trend that remains intact.

Another expert known as Crypto Signals seems to agree with Hyland, expressing his pleasure in the analysis. According to Crypto Signals, in the context of Bitcoin, “the idea of diminishing returns is a fascinating one.”

Crypto Signals claims that every cycle tends to “produce a declining percentage gain as the market matures.” Due to this, there is a more profound development and broader adoption in the market. Thus, in the constantly changing world of cryptocurrencies, the narrative is worth looking into.

Strategic Timeframe For BTC Pre-Halving Rally

Rekt Capital, a well-known crypto expert, has pinpointed a timeframe for when and where the Bitcoin Pre-Halving rally will end. According to Rekt Capital, the “pre-halving rally is gradually approaching its end.”

Related Reading: Bitcoin Halving Prep: Analyst Outlines Key Points Ahead Of Event

Drawing a comparison to 2020’s pre-halving rise, the analyst stated that it occurred two weeks before the event. After that, BTC witnessed a “pre-halving retrace” of about 20%, which was the last it saw before the halving.

He further drew a comparison to 2016’s pre-halving surge, which he noted took place “28 days prior to the halving.” Nevertheless, it also experienced “a conservative correction” of over 29% after the rally topped.

Rekt Capital has marked the point as the “historic danger zone” that could potentially conclude the pre-halving rally this year, before witnessing a pullback ahead of the event.

Bitcoin

BREAKING: Bitcoin Hits New All-Time High, Surging Past $70,000 For The First Time In History

Bitcoin (BTC), the dominant cryptocurrency, has made history by briefly breaking its consolidation phase and reaching an all-time high of $70,000. Despite encountering resistance near this level, Bitcoin’s market capitalization has reached $1.3 trillion, showcasing its continued upward momentum. 

However, as the cryptocurrency faces a double top in the same price zone after almost three years, it must overcome a significant hurdle to consolidate above $69,000 and pave the way for further price gains.

Bitcoin Sets New Record 

In the past 24 hours, Bitcoin experienced a 2% uptrend, propelling it to breach the $70,000 milestone for the first time. The cryptocurrency had previously reached $69,300 on Tuesday, indicating the growing strength of its upward trajectory. However, the $69,000 mark has proven to be a formidable resistance level, leading to increased volatility once breached.

Bitcoin

The double-top formation in this price zone over a three-year period adds further complexity to Bitcoin’s consolidation efforts. Breaking through this resistance is crucial for Bitcoin to establish a solid foundation for future price gains and sustainably consolidate above $70,000.

The success of Bitcoin spot exchange-traded funds (ETFs) within a short span of two months has bolstered investor confidence and generated anticipation for future price appreciation. 

With investors betting on Bitcoin’s long-term prospects, it appears to be only a matter of time before the cryptocurrency overcomes its current resistance level and continues its upward trajectory. This positive sentiment provides a favorable backdrop for Bitcoin’s potential breakthrough.

Following its brief touch of $70,000, Bitcoin experienced a rapid retracement to the $68,000 level. The timing and extent of its consolidation above the resistance mark remain uncertain. However, market observers are closely monitoring Bitcoin’s performance, anticipating a potential breakthrough that could fuel additional price gains.

Featured image from Shutterstock, chart from TradingView.com 

Here’s How Much Elon Musk’s Tesla And SpaceX Have Made From Their Bitcoin Holdings

A new report has revealed the total Bitcoin assets held by Elon Musk’s Tesla and SpaceX companies and how much profit they’re seeing so far.   

Tesla And SpaceX Bitcoin Holdings Unveiled

On Thursday, March 7, Arkham Intelligence, an AI-based blockchain analytics platform, revealed the Bitcoin holdings of SpaceX and Tesla, two companies co-founded by X (formerly Twitter) owner, Elon Musk. The comprehensive report also outlined Tesla’s BTC transactions spanning from 2021 to 2024.

According to Arkham, Tesla had purchased about $1.5 billion worth of BTC in January 2021. Subsequently, the automotive company initiated multiple transfers, opting to sell off its Bitcoin holdings valued at $272 million in the first quarter of 2021 and about $936 million in the second quarter of 2022.  

Arkham has claimed that the automotive company currently possesses a staggering 11,510 BTC, valued at $780 million. Furthermore, Tesla’s substantial Bitcoin holdings are reportedly spread across 68 wallet addresses. 

On the other hand, SpaceX, a private space exploration and technology company, currently holds about $8,290 BTC worth approximately $560 million. These assets are reportedly distributed across a total of 28 wallet addresses. 

The combined BTC holdings of these two companies place them in a league comparable to the BTC holdings of major financial institutions. Tesla has secured the third position among the largest Bitcoin holders, with MicroStrategy leading the list, possessing around 190,000 BTC worth over $8 billion. 

Despite the considerable amount of BTC held by Musk’s companies, the CEO has seemingly had a love-hate relationship with Bitcoin. Earlier in 2023, Bitcoin crashed below $25,000 after Musk’s SpaceX sold all its Bitcoin holdings. However, it seems the space company is showing more interest in BTC, as seen by its massive Bitcoin portfolio. 

Tesla May Be Buying More BTC

A crypto community member, identified as “Definalist” on X, has shared insights, suggesting that Tesla might be increasing its involvement in Bitcoin. Referring to Arkham Intelligence’s report of Tesla’s BTC holdings, Definalist disclosed Tesla’s acquisition of an additional 1,790 BTC. 

Definalist has revealed that in 2023, Tesla’s BTC balance sheet had held about 9,720 BTC. Fast forward to 2024, the automotive company’s portfolio has expanded to 11,510 BTC, revealing an unreported acquisition of an extra 1,790 BTC. 

This significant Bitcoin purchase could be attributed to the growing enthusiasm for the cryptocurrency, driven by its recent bullish momentum and massive price increases. At the time of writing, Bitcoin is trading at a price of $67,279, according to CoinMarketCap. The cryptocurrency previously surged to an all-time high of $69,200 on March, 5, after which it retraced to its current price level.

Bitcoin price chart from Tradingview.com

Bitcoin Bulls On Alert: Top Analyst Anticipates A Big Spike In The Cards

Cryptocurrency enthusiasts are buzzing after renowned analyst Willy Woo ignited the community with a bullish prediction for Bitcoin (BTC). Woo, known for his past forecasting successes, suggests a monumental surge is on the horizon, fueled by a recent development – the long-awaited approval of spot Bitcoin ETFs.

These exchange-traded funds allow traditional investors to gain exposure to Bitcoin without the complexities of directly acquiring and holding the digital asset. Woo believes this will act as a dam breaking, unleashing a torrent of capital into the cryptocurrency.

Bitcoin: Arrival On Major Exchanges Forges Ties With Traditional Markets

The traditional markets hold a staggering $100 trillion, Woo stated on X (formerly Twitter), and with Bitcoin now listed on some of the world’s biggest exchanges, we’re witnessing a bridge being built between these two financial giants.

At the time of writing, Bitcoin was trading at $67,182, up 0.5% and 8.4% in the daily and weekly charts, data from Coingecko shows.

He draws parallels between the current scenario and the pivotal moment in 2010 when Bitcoin found its footing on the Mt. Gox exchange platform.

This initial exposure to global liquidity propelled the fledgling digital asset to a tenfold increase within five days, followed by a staggering 1,000x growth over the next two years.

Echoes Of The Past: Will History Repeat Itself?

Woo argues that the current situation presents a similar opportunity, albeit on a much grander scale. He highlights the recent all-time high of $69,000 for Bitcoin, followed by a period of stability that suggests resilience in the face of market corrections.

This, coupled with the positive sentiment in the crypto community, paints a picture ripe for a potential boom.

However, while the prospect of replicating Bitcoin’s astronomical rise in 2010 is undeniably alluring, it’s crucial to remember that past performance is not a guarantee of future results.

Technical analysis charts, currently indicating an overbought market, could be overwhelmed by the sheer volume of capital inflow predicted by Woo.

Yet, this scenario is not without its skeptics. Some analysts caution against overenthusiasm, pointing out that the technical indicators might still play a role in determining the price trajectory.

Featured image from Pexels, chart from TradingView

Bitcoin Price Forms Inverse Head And Shoulders Pattern, Eyes $76,000

Just below the all-time high of $69,000, the Bitcoin price has shown more volatility in recent days, only to now tread water around $67,000. But this boredom could soon be over. Following the recent price movements, a notable pattern has emerged on the Bitcoin (BTC) price chart, as recognized by the seasoned crypto analyst Josh Olszewicz.

Bitcoin Price Rallye To $76,000 Next?

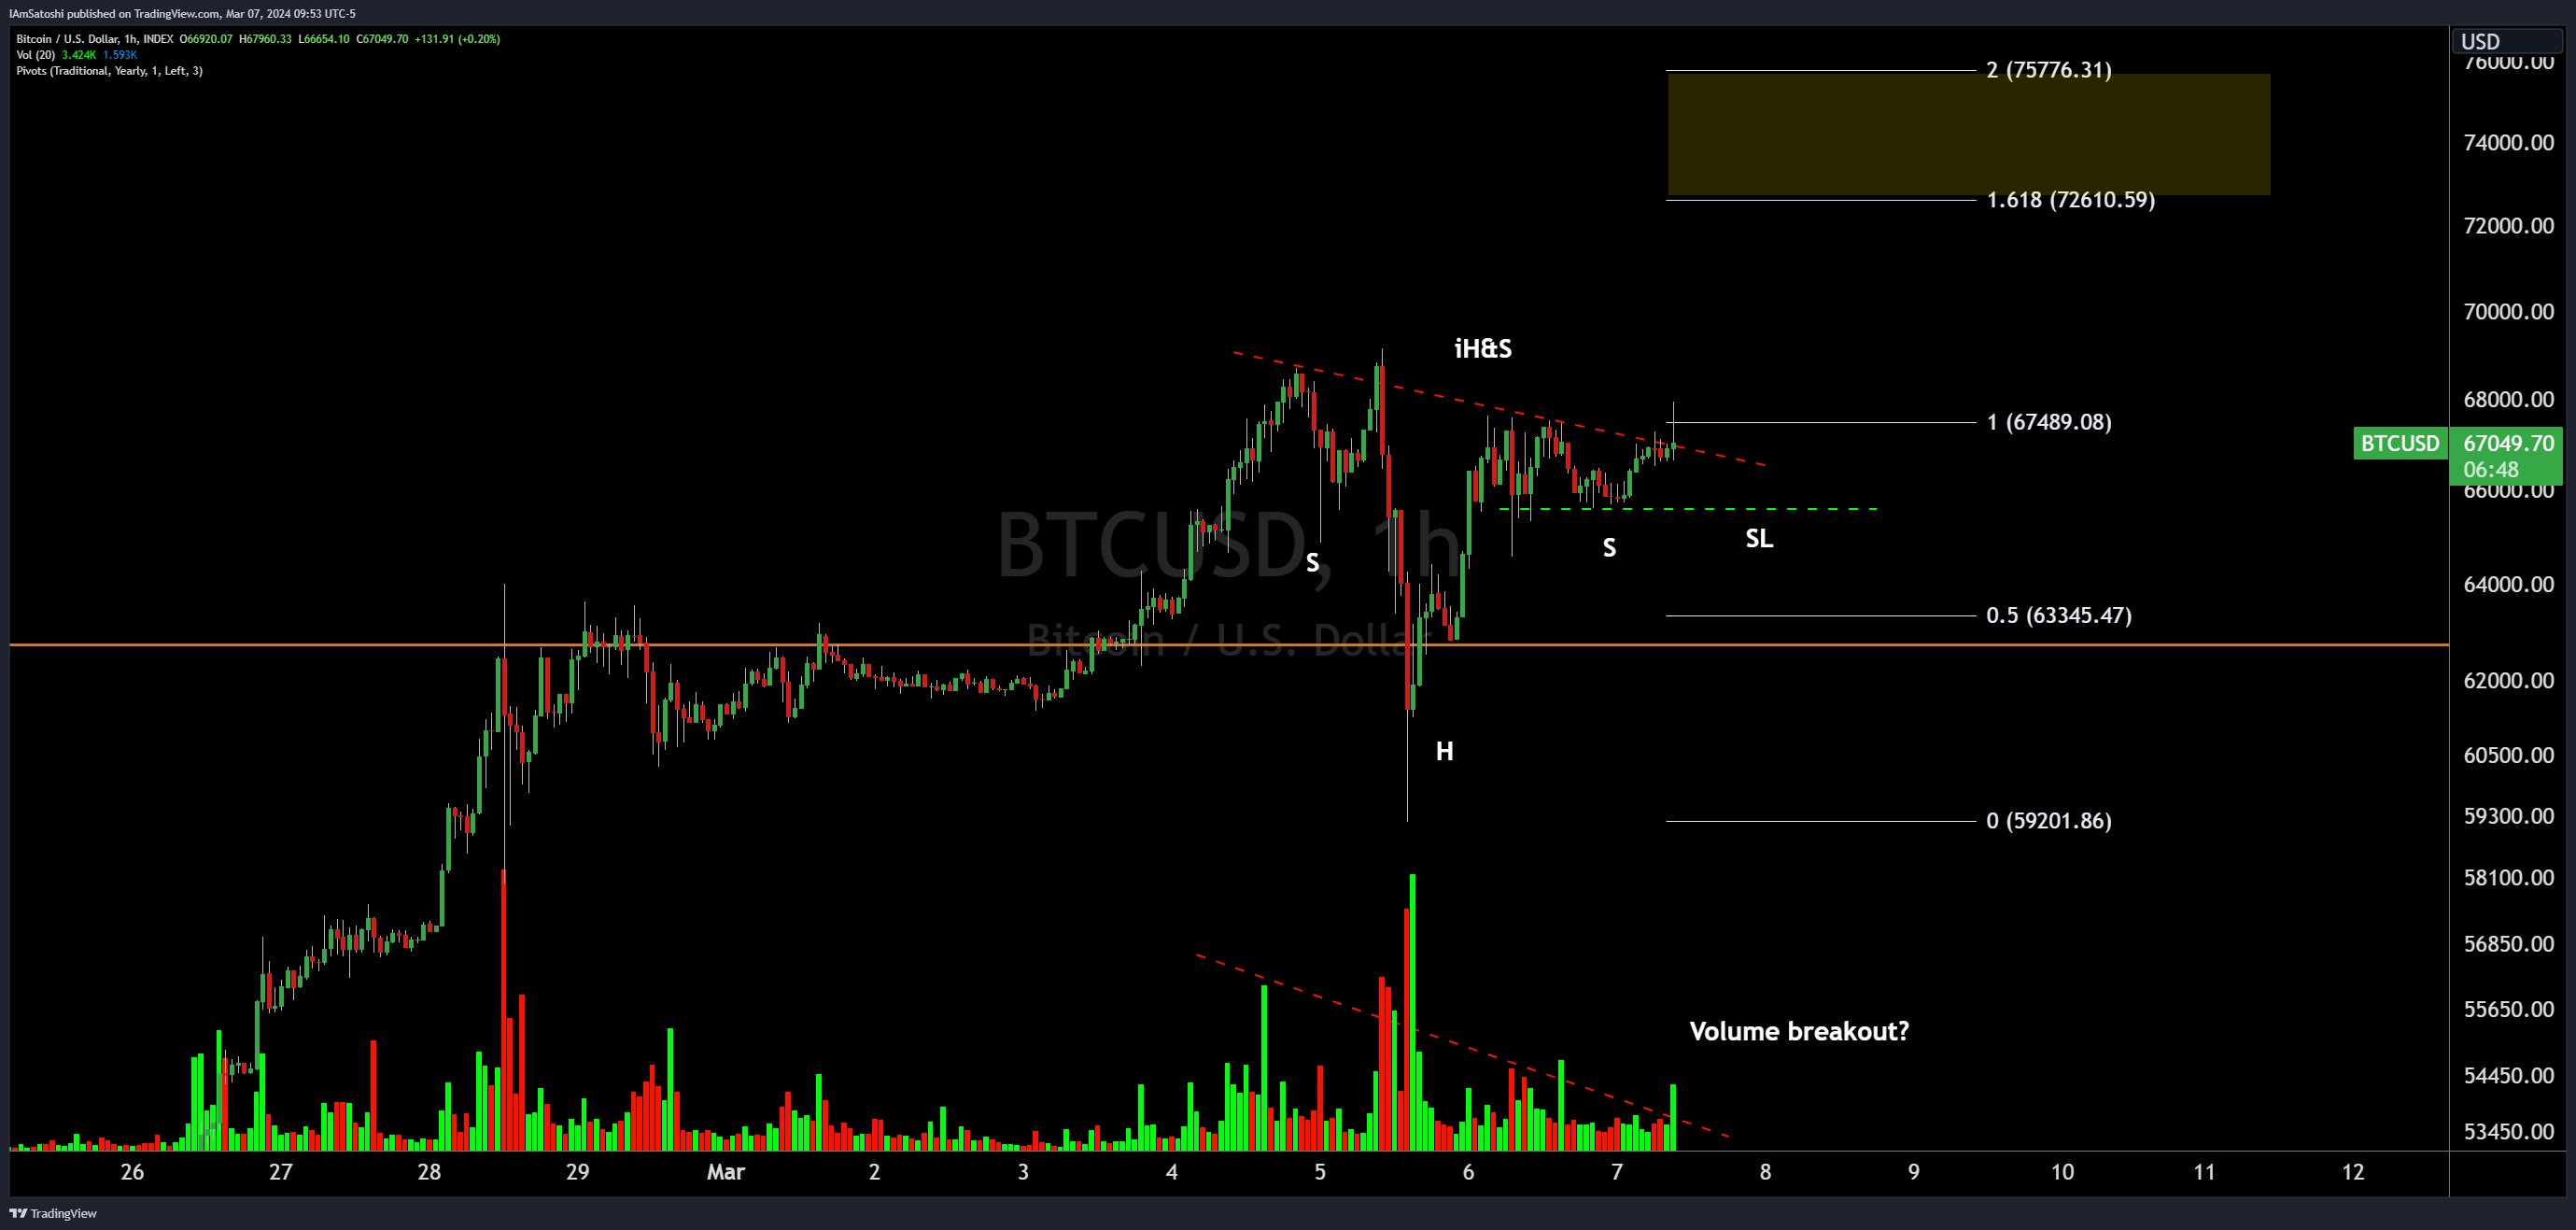
An inverse head and shoulders (iH&S) pattern, often seen as a bullish indicator, has formed on the Bitcoin 1-hour chart, suggesting a potential upward price movement. This pattern, while admittedly imperfect as per Olszewicz, is considered tradeable in his view. “[The] pattern is definitely not perfect but still tradeable imo,” he remarked.

An Inverse Head and Shoulders (iH&S) pattern is a bullish reversal pattern in technical analysis, signaling a potential upward reversal in price trends. It consists of three troughs with the middle trough being the lowest, resembling the shape of a head and two shoulders, but flipped upside down.

Bitcoin inverse head and shoulders pattern

In this scenario, Bitcoin’s chart shows the formation with a head at approximately $59,000 and shoulders forming around the $65,000 and $65,700 mark. The pattern suggests that a bullish move is brewing. Traders often use iH&S patterns to identify potential buying opportunities, with entry points typically near the neckline breakout.

The analyst’s chart points to a neckline (dotted red line) slanting downward, intersecting with the right shoulder in the coming days. A breakout above this line is typically required to confirm the pattern. At the current price, Bitcoin is trading just below the neckline.

For traders eyeing potential targets, Olszewicz’s analysis projects an ambitious goal of $73,000 to $76,000, aligned with the Fibonacci extension levels of 1.618 ($72,610.59) and 2 ($75,776.31). These levels represent significant price points that Bitcoin might test if the pattern is confirmed with a solid breakout.

One element that could fortify the potential upward journey is a volume breakout, which the analyst has hinted at with a question mark. The volume indicator on the chart shows an increasing trend, but a decisive surge in volume is typically sought after to confirm an iH&S pattern.

Moreover, Olszewicz has marked a potential stop loss (SL) level with a dashed green line. This level around $65,680 serves as a risk management tool for traders should the pattern fail to realize the upward breakout.

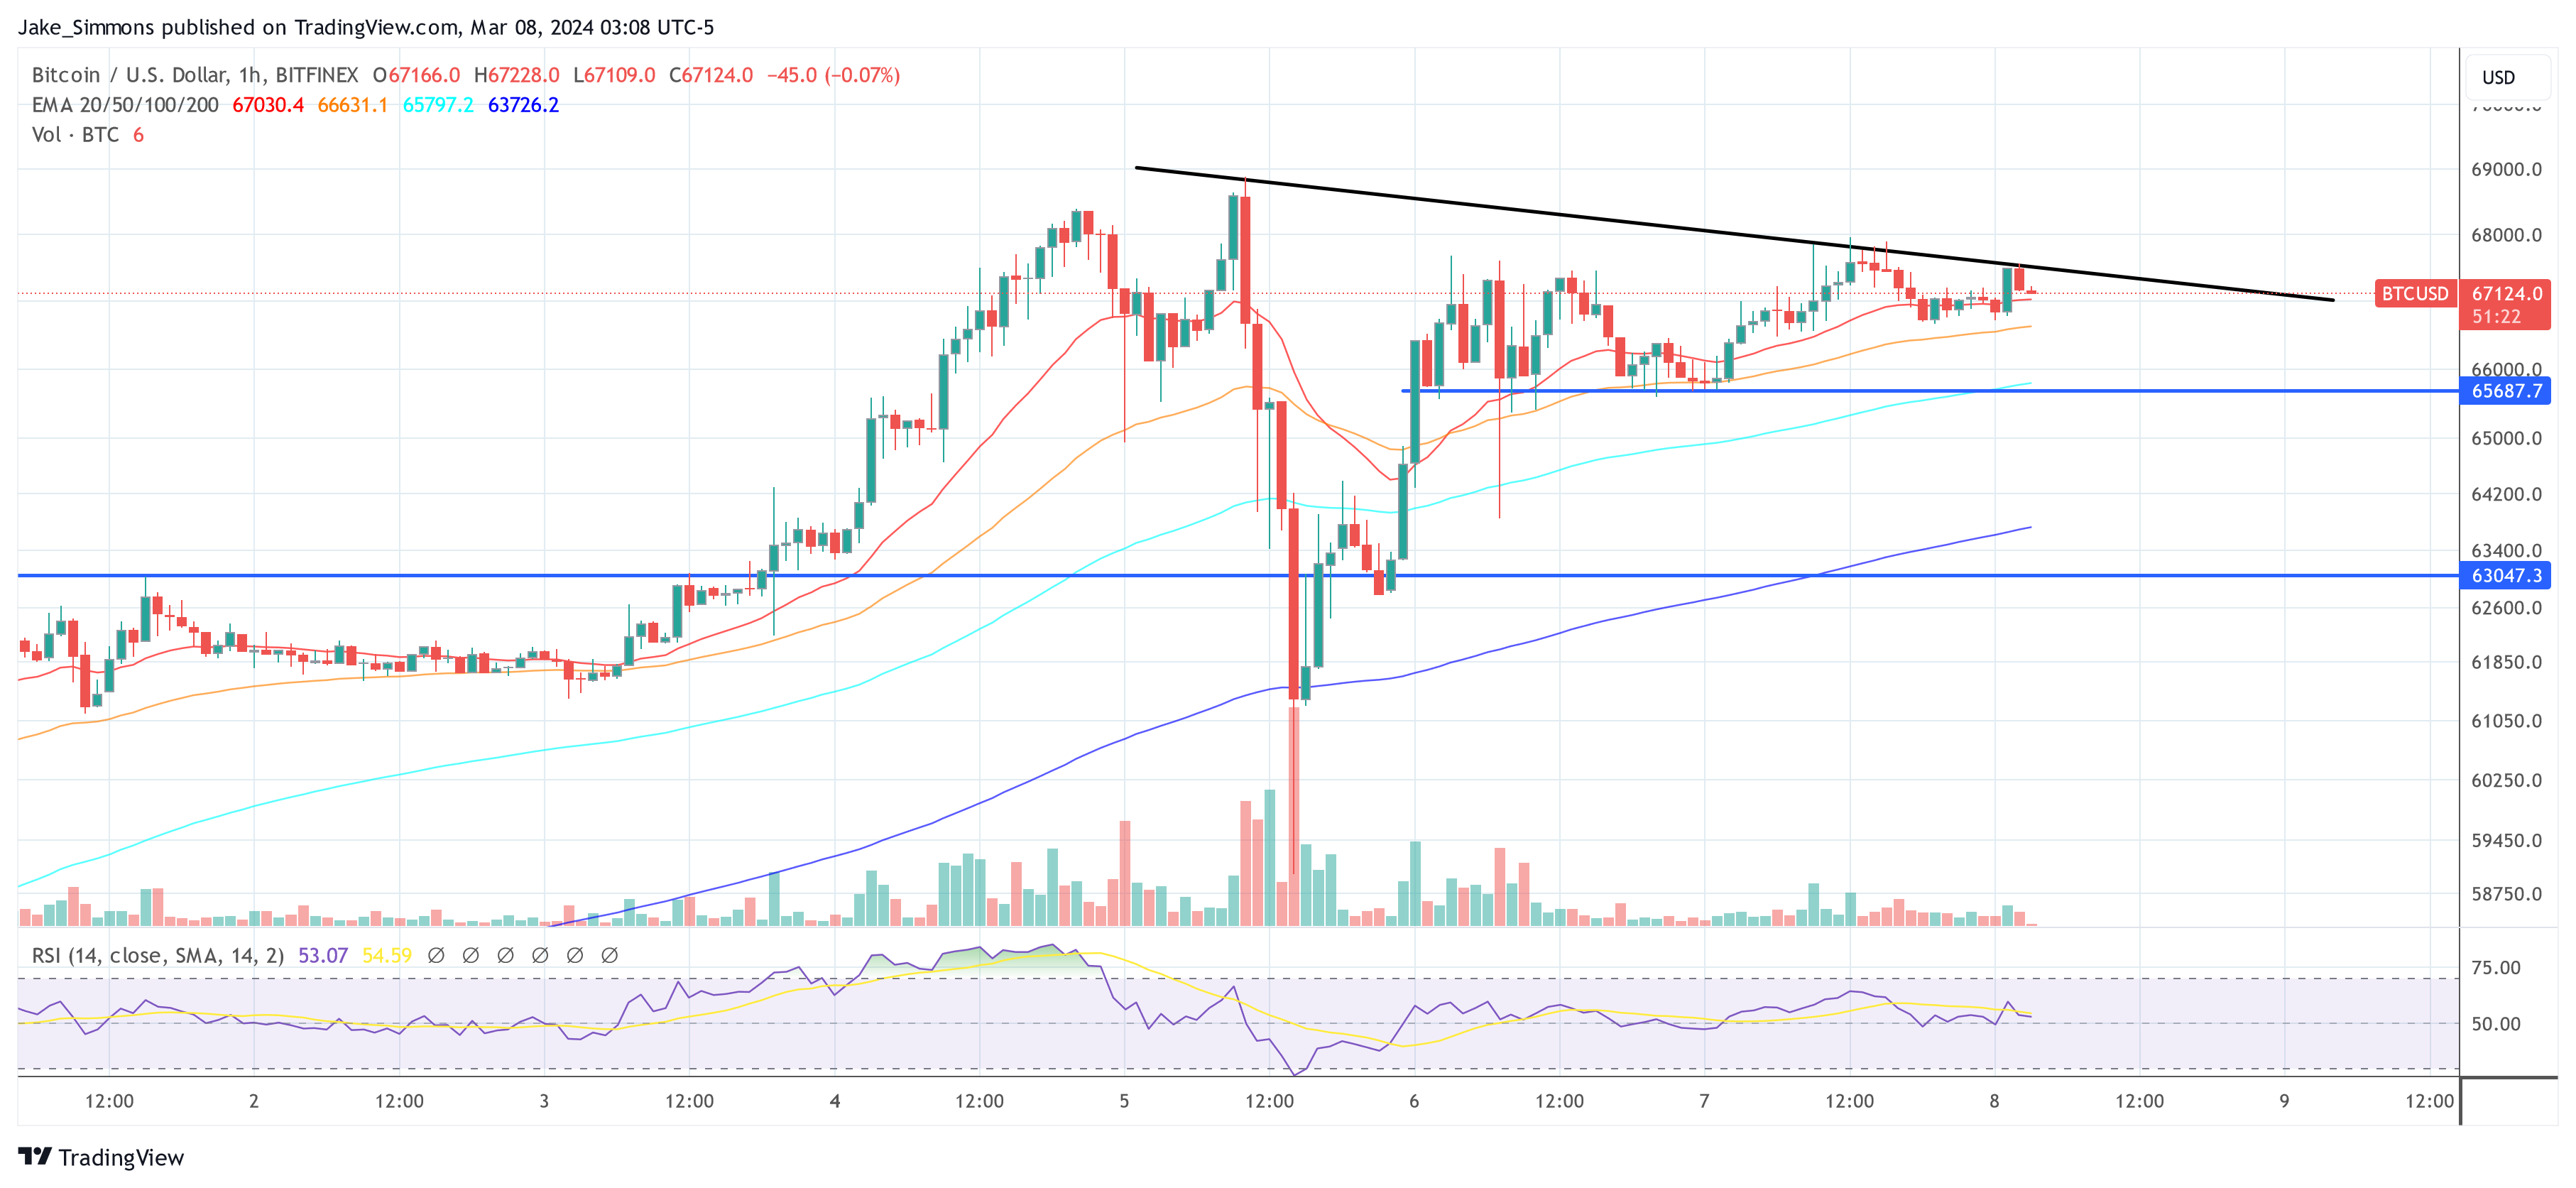
At press time, BTC traded at $67,124.

Bitcoin price

Bitcoin Price Reclaims 100 SMA But Momentum Seems To Be Fading

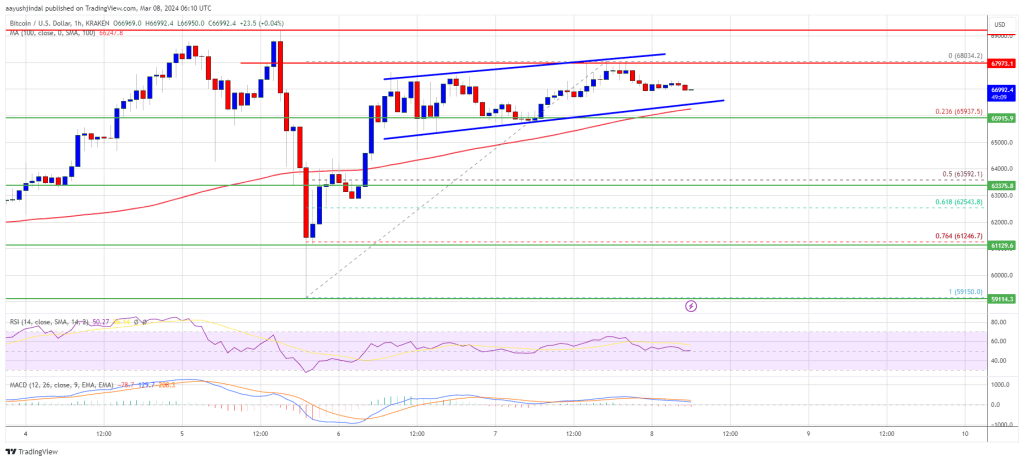
Bitcoin price is still struggling to settle above the $68,000 resistance. BTC is now consolidating and might drop again toward the $63,500 support.

  • Bitcoin price is struggling to clear the $68,000 and $68,500 levels.
  • The price is trading above $66,000 and the 100 hourly Simple moving average.
  • There is a key rising channel forming with resistance near $68,200 on the hourly chart of the BTC/USD pair (data feed from Kraken).
  • The pair could start another decline and trade toward $63,500 support zone.

Bitcoin Price Faces Hurdles

Bitcoin price recovered most losses and settled above the $65,000 level. However, BTC seems to be struggling to clear the $68,000 and $68,500 levels, unlike Ethereum.

The recent high was formed at $68,034 and the price is now consolidating gains. It is trading above the 23.6% Fib retracement level of the upward wave from the $59,150 swing low to the $68,034 high. There is also a key rising channel forming with resistance near $68,200 on the hourly chart of the BTC/USD pair.

Bitcoin is still trading above $66,000 and the 100 hourly Simple moving average. Immediate resistance is near the $67,500 level. The next key resistance could be $68,000, above which the price could rise toward the $68,500 resistance zone.

Bitcoin Price

Source: BTCUSD on TradingView.com

If there is a clear move above the $68,500 resistance zone, the price could even attempt a move above the $69,200 resistance zone. Any more gains might send the price toward the $70,000 level.

Another Decline In BTC?

If Bitcoin fails to rise above the $68,000 resistance zone, it could start another downside correction. Immediate support on the downside is near the $66,550 level and the channel trend line.

The first major support is $66,000. If there is a close below $66,000, the price could start a decent pullback toward the 50% Fib retracement level of the upward wave from the $59,150 swing low to the $68,034 high at $63,500. Any more losses might send the price toward the $62,500 support zone.

Technical indicators:

Hourly MACD – The MACD is now gaining pace in the bearish zone.

Hourly RSI (Relative Strength Index) – The RSI for BTC/USD is now near the 50 level.

Major Support Levels – $66,550, followed by $66,000.

Major Resistance Levels – $67,500, $68,000, and $68,500.

Bitcoin’s Crucial Lifeline: Analyst Unveils Support That Could Prevent Crash To $60K

Bitcoin has once again been the center of attention following its recent surge to a new all-time high, only to face a subsequent downturn that tested the resilience of its market value.

A few days ago, Bitcoin traded at $69,328 for the first time ever, but It experienced a pullback, dipping to the $59,000 region before regaining its footing and stabilizing above the $66,000 mark.

Bitcoin Crucial Support Level

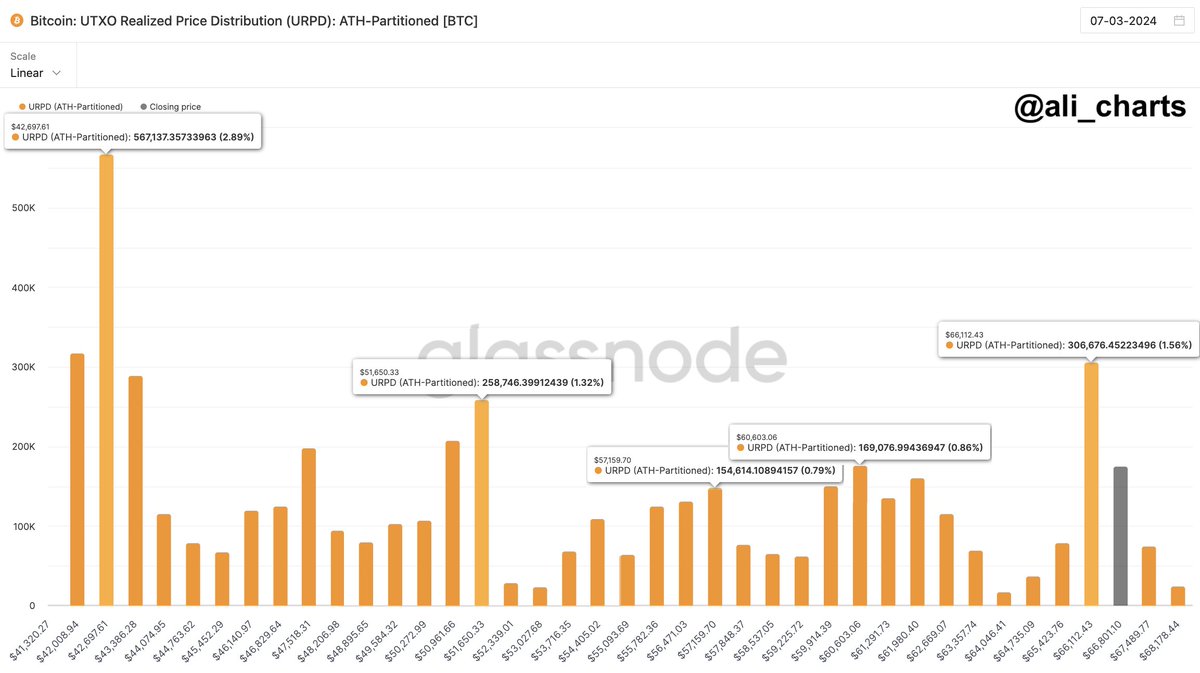
Ali, a recognized figure in the crypto analysis sphere, has pinpointed a critical support level that could play a pivotal role in Bitcoin’s short-term price trajectory. He highlights $66,112 as a key support threshold, supported by a significant transaction volume of 306,676 BTC.

Should Bitcoin’s price venture below this crucial level, it may encounter increased selling pressure, potentially leading it toward the $60,600 mark.

Bitcoin realized price distribution

Notably, a substantial transaction volume at the $66,112 support level is a bullish signal, indicating strong market support for Bitcoin.

Analyst Insights On Corrections And Market Maturity

As Bitcoin navigates through its current market cycle, the conversation around potential corrections and their implications has intensified. Analysts like CryptoJelleNL have projected a correction in the 20-25% range, hinting at a possible dip to the $46,500 range.

Such predictions are grounded in cycle analysis, which examines market corrections’ historical precedence and impact on Bitcoin’s value. Observations from past cycles reveal a trend toward diminishing severity of corrections, indicating a maturing market that is becoming increasingly resilient to shocks.

For instance, the 2016-2017 cycle witnessed seven significant corrections with an average pullback of 32%, whereas the current cycle has seen fewer and less severe downturns, with an average pullback of 21%.

Amid the fluctuations, Bitcoin maintains its bullish stance, reclaiming the $67,000 mark with a curating trading price of $67,761. This resilience follows a significant pullback from Tuesday’s recent all-time high of $69,328.

Bitcoin (BTC) price chart on TradingView

Over the last 24 hours, Bitcoin has seen a 1.3% increase, complemented by a 6.6% gain over the past week, underscoring the asset’s enduring strength in the market.

Featured image from Unsplash, Chart from TradingView

Analyst Predicts: Bitcoin On The Brink Of A Monumental Rally – Here’s Why

Willy Woo, a crypto analyst, has captured the crypto community’s attention with his latest view on Bitcoin (BTC), suggesting an impending significant surge for the asset.

This optimism follows the approval of spot Bitcoin ETFs, which Woo believes would channel more substantial capital into the market, potentially catalyzing a “monumental rally” in Bitcoin’s value.

Beyond Technical Analysis: Market Sentiments And Prediction

Willy Woo took to X to share his analysis, drawing on Bitcoin’s historical performance to shed light on its future trajectory. Woo reminisced about July 2010, when Bitcoin’s value was a mere 0.7 cents, and how it saw a tenfold increase in just five days, followed by a 1,000x growth over the next two years.

The analyst also attributed this growth to Bitcoin’s exposure to global liquidity, notably through its integration with the Mt. Gox exchange platform. Today, Woo sees a parallel scenario, albeit on a much grander scale, with Bitcoin gaining listings on global stock markets and overseeing around $100 trillion in capital.

According to Woo, the influx of interest and investment from these quarters could dwarf the technical analysis charts that currently signal overbought conditions. This would be reminiscent of the late 2020 cycle, when Bitcoin attracted significant spot purchases from high-net-worth individuals.

While Willy Woo points to the structural conditions setting the stage for Bitcoin’s rally, other market analysts and traders are making their predictions. Peter Brandt, a well-regarded figure in the trading community, has also shared his perspective on Bitcoin’s potential for growth.

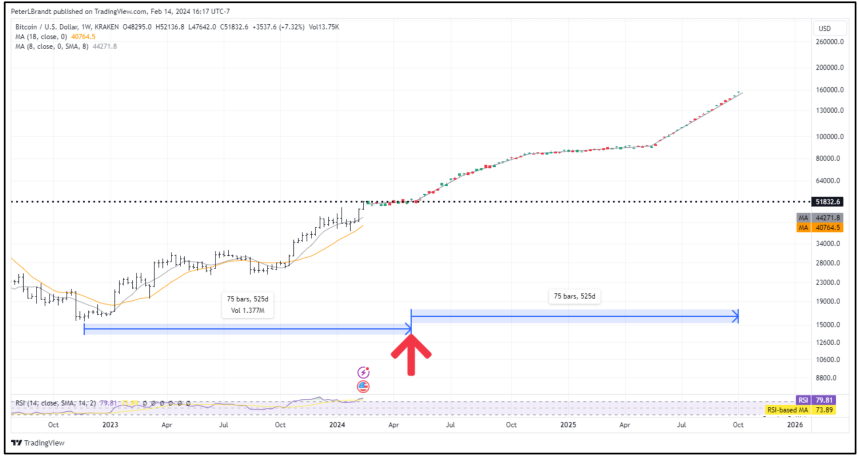
Brandt’s analysis suggests that if the bull trend post-April 2024 mirrors the momentum observed since the November 2022 low, Bitcoin could reach as high as $150,000 by October 2025.

Bitcoin Contrasting Views And Market Indicators

Amid the bullish forecasts, contrasting views and indicators suggest a more cautious outlook. Crypto analyst and trader Ali has recently identified potential signs of an impending price retracement for Bitcoin.

Bitcoin (BTC) price chart on TradingView.com

Utilizing the Tom DeMark (TD) Sequential indicator, Ali noted a sell signal on Bitcoin’s daily chart. This development warrants close monitoring, given the indicator’s track record of accurately predicting Bitcoin trends since the start of the year.

Earlier instances saw a buy signal in January preceding a 34% price increase, while a 4% price drop followed a sell signal mid-last month. As the TD Sequential develops a sell signal, there’s speculation about a possible short-term correction for Bitcoin.

Featured image from Unsplash, Chart from TradingView

This Bitcoin Indicator Has Hit Levels That Often Lead To Corrections

On-chain data shows a Bitcoin metric has recently hit levels that have historically led to corrections in the cryptocurrency’s price.

Bitcoin Is Currently 40% Above The Cost Basis Of Short-Term Holders

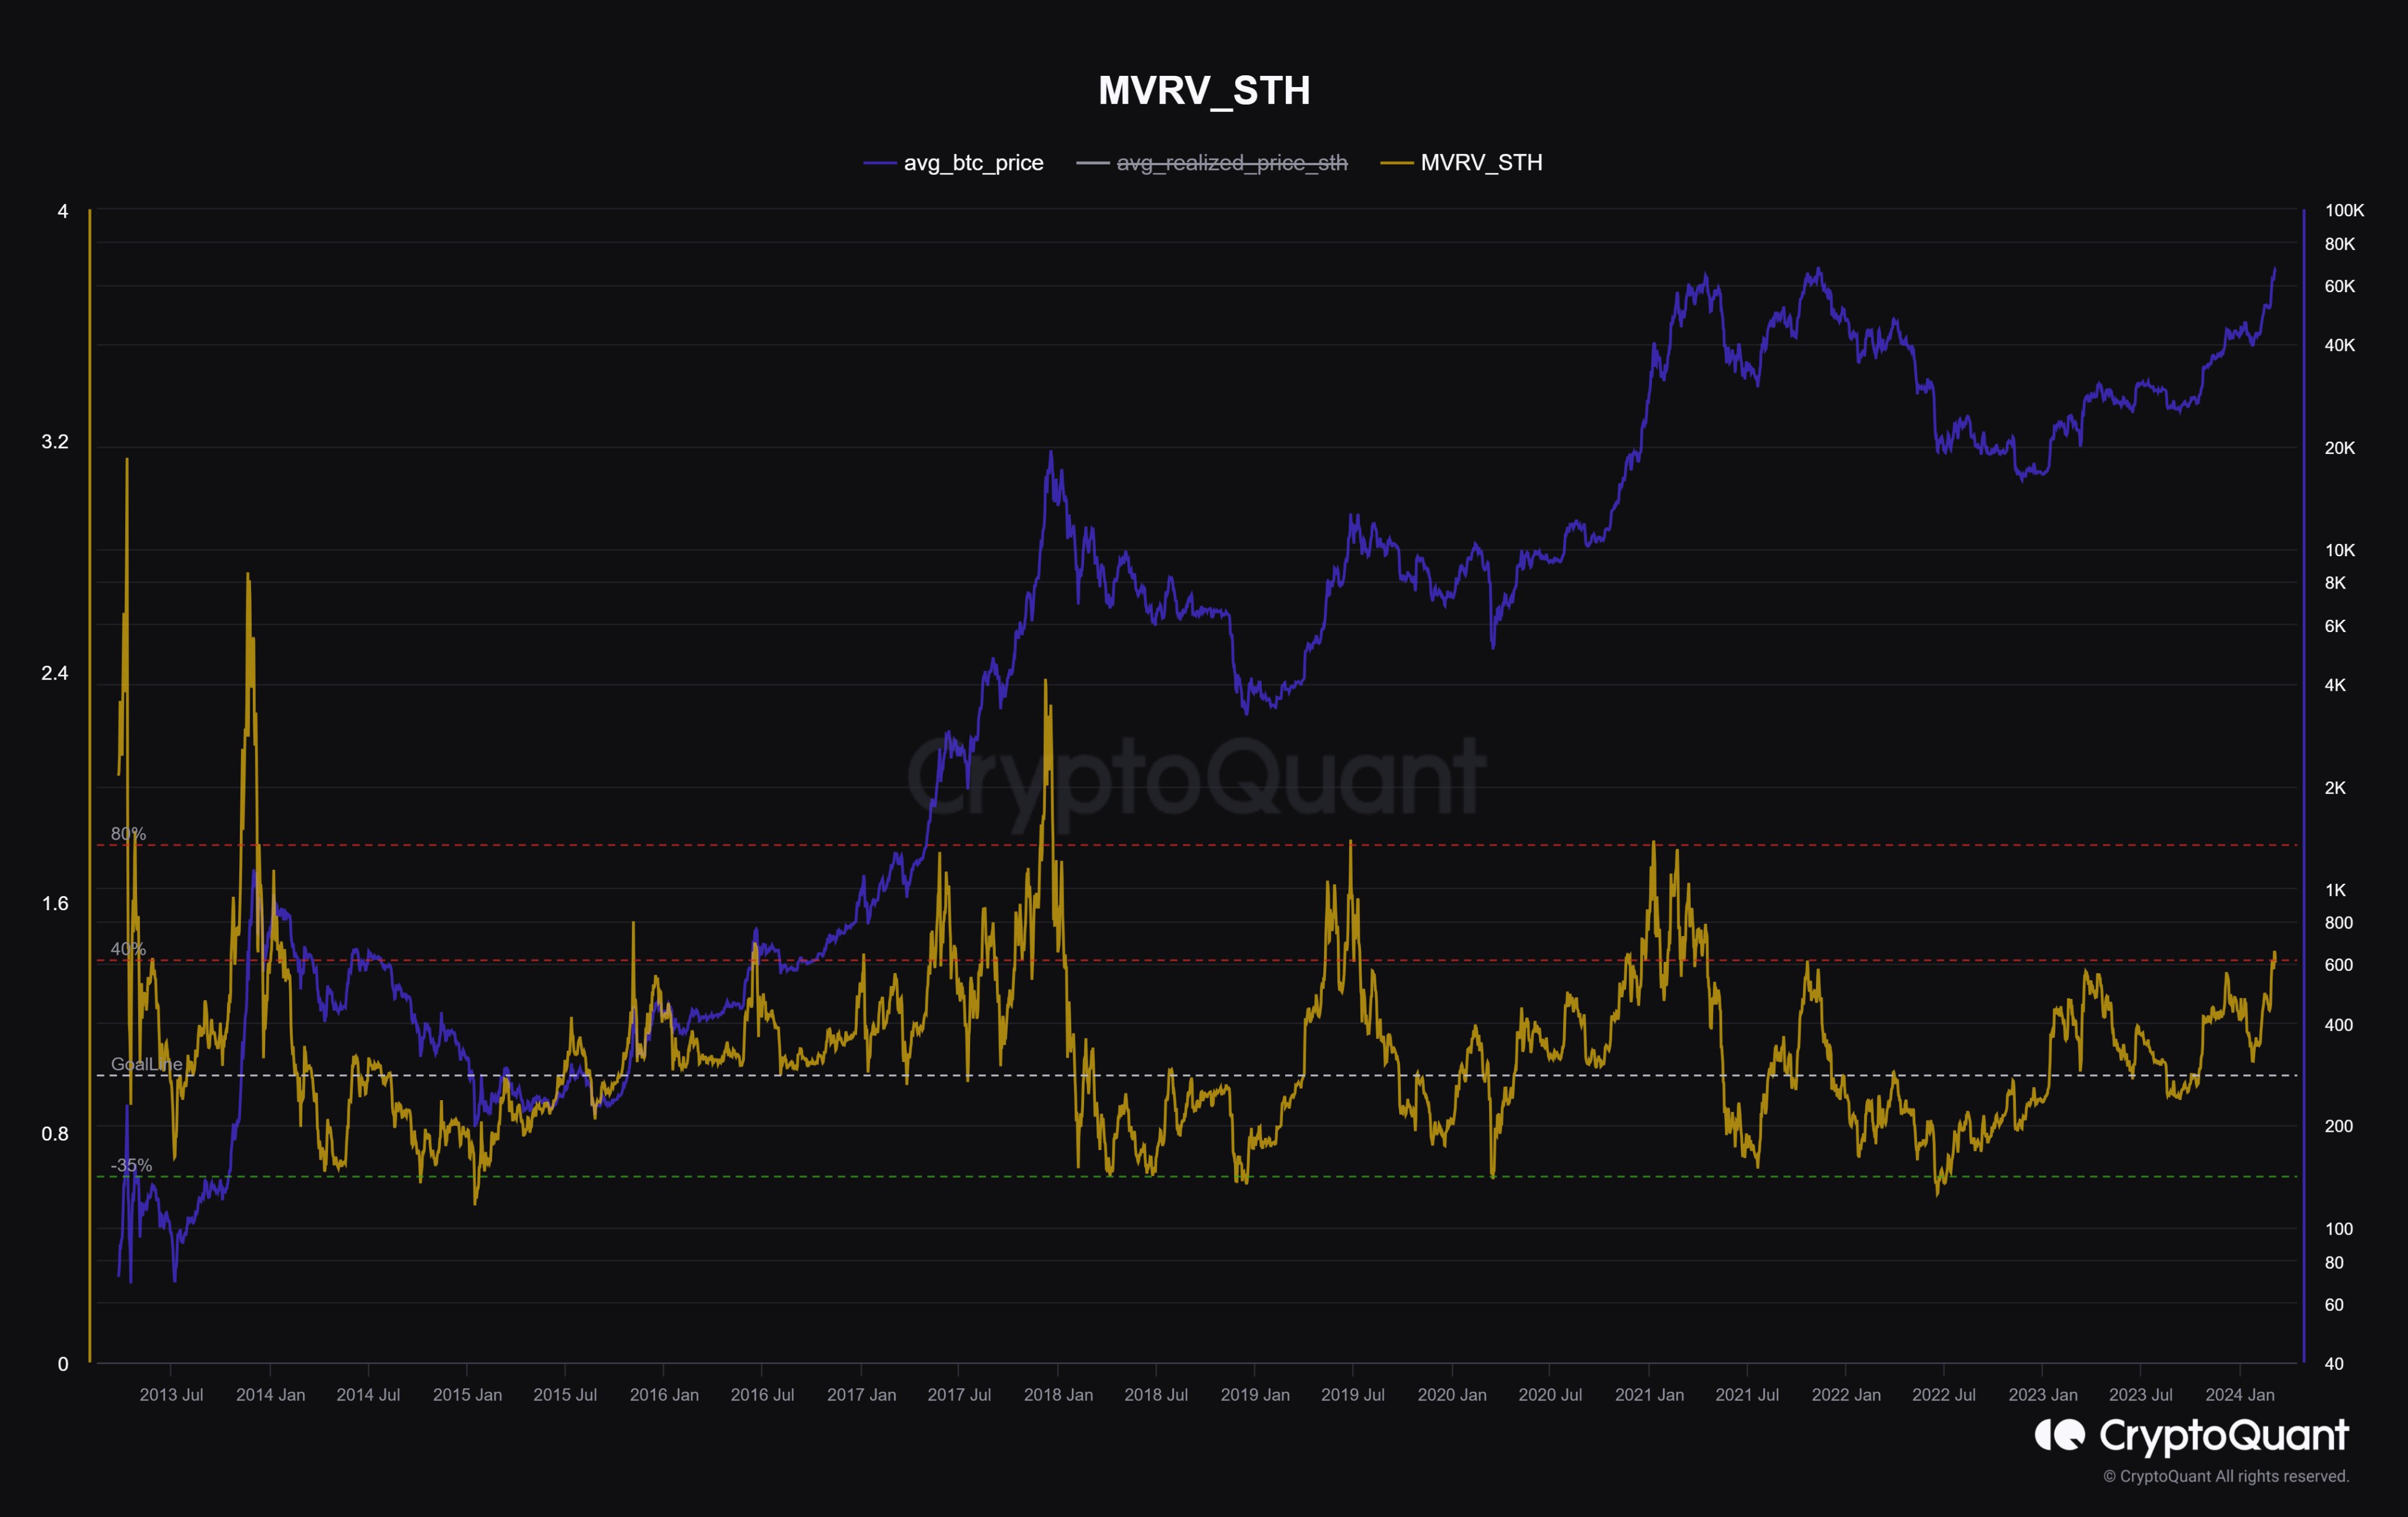
CryptoQuant Netherlands community manager Maartunn explained in a post on X that the BTC price is currently 40% above the cost basis of the short-term holders.

The indicator of interest here is the “Market Value to Realized Value (MVRV) ratio,” which is an indicator that keeps track of the ratio between the Bitcoin market cap and the realized cap.

The “realized cap” refers to a capitalization model for the asset that assumes that the real value of any coin in circulation isn’t equal to the current spot price but rather the price when it was last transacted on the blockchain.

The previous transfer of any coin was likely the last point at which it changed hands, so the price at that time would act as its current cost basis. As such, the realized cap is essentially the sum of the cost basis of the entire supply.

Therefore, the metric’s value can measure the total capital the holders have put into the asset. And since the market cap is the value they are currently carrying, its comparison against the realized cap in the MVRV ratio can tell us about the amount of profits or losses the investors hold.

In the current discussion, the MVRV ratio of the entire market isn’t of interest but rather of a particular segment of it: the “short-term holders” (STHs). The STH cohort includes all investors who bought their coins within the past 155 days.

The below chart shows the trend in the Bitcoin MVRV ratio specifically for these investors over the history of the cryptocurrency:

Bitcoin STH MVRV

As displayed in the above graph, the Bitcoin STH MVRV has been greater than 1 for a while now as the STHs have been carrying net profits, but with the latest rally in the asset, the indicator has shot up to especially high levels.

The BTC spot price has recently been 40% over this cohort’s average cost basis. The chart shows that this same level has led to asset corrections a few times in the past.

Naturally, this doesn’t mean that the coin would necessarily see a correction here, but given the historical pattern, there is a chance one would occur.

The likely reason behind this pattern is that Bitcoin investors are more likely to give in to the allure of profit-taking the larger their profits grow.

BTC Price

Bitcoin has gone through some significant volatility since setting its brand new all-time high above the $69,000 level, with its price now trading around $67,700.

Bitcoin Price Chart

Crypto Analyst Uses Historical Data To Show When The Bitcoin Price Will Reach $207,000

A crypto analyst has laid out a scenario where the Bitcoin price could rise above $200,000 by June. This is based on a historical occurrence that could play out again following BTC’s recent run above its previous all-time high (ATH).

How BTC Could Rise To $207,000 By June

The anonymous analyst behind the prominent crypto X (formerly Twitter) account, Bitcoin Archive, alluded to the 2021 bull run when Bitcoin’s price more than tripled in just 103 days after breaking the previous cycle’s ATH. That means Bitcoin could run to $207,000 by June if history repeats itself. 

Bearing the Bitcoin Halving event in mind, Bitcoin’s price tripling by June looks feasible. Bitcoin’s price has more than tripled 90 days after previous Halving events. Considering that Bitcoin surpassed its previous ATH even before this Halving, which is set to take place in April, the flagship crypto could also achieve this exponential price surge in record time this time around. 

This narrative is supported by the fact that Bitcoin’s demand continues to exceed its supply, and the supply will be further reduced when miners’ rewards are cut in half. Therefore, although ambitious, a price surge of such magnitude cannot be ruled out. 

Moreover, crypto analyst MacronautBTC already calculated how Bitcoin’s price could rise to $237,000 based on the imbalance between supply and demand. BTC rising to $207,000 by June will no doubt defy expectations, with analysts like Skybridge Capital CEO Anthony Scaramucci not expecting such a price surge until next year. 

Scaramuci had predicted that Bitcoin would rise to $170,000 18 months after the Halving event. Meanwhile, Tom Dunleavy, Partner and Chief Investment Officer (CIO) at MV Capital, took a conservative stance when he mentioned that Bitcoin could rise to as high as $100,000 this year. 

What Next For Bitcoin?

Bitcoin has cooled off following its rise to a new ATH of $69,000. As to the next move the flagship crypto could make, crypto analyst Satoshi Flipper suggested in an X post that Bitcoin could consolidate between $65,000 and $70,00 for a few weeks before breaking its ATH again. 

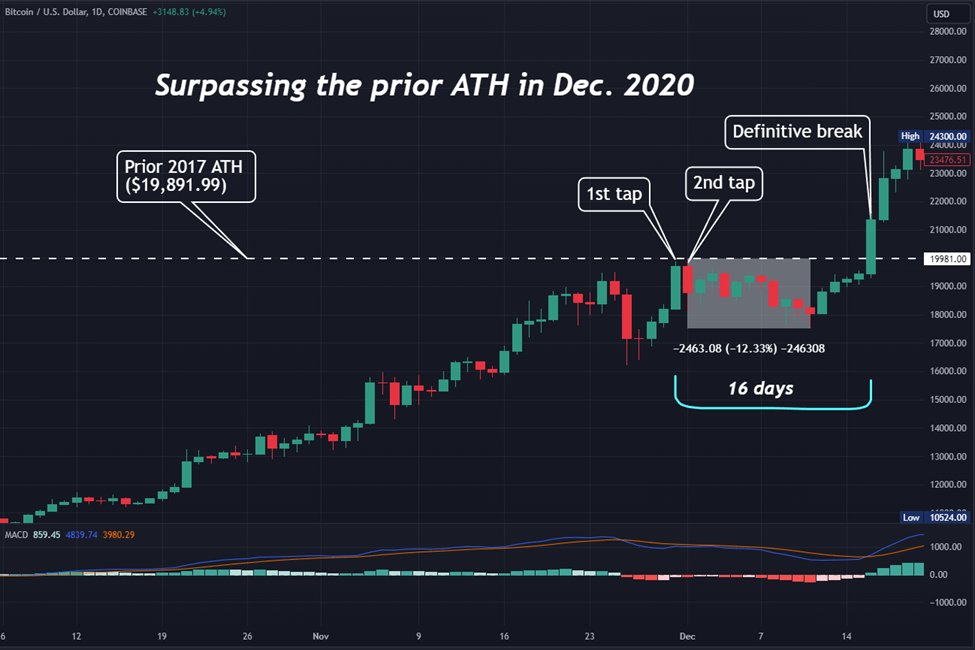
This aligns with Alex Thorn’s (Head of Research at Galaxy Digital) analysis, where he noted that BTC could follow a similar path to December 2020. Back then, BTC touched its prior ATH of $20,000, then traded 11.3% lower for the next 15 days before going on to “definitively” break its ATH.

At the time of writing, Bitcoin is trading at around $66,000, up in the last 24 hours, according to data from CoinMarketCap. 

Crypto Analyst Optimistic About A Shiba Inu Short-Term Surge To $0.000066

Shiba Inu (SHIB) has displayed immense momentum lately standing out as one of the best-performing meme coins in light of the general optimism that took over the cryptocurrency market in the last week.

Shiba Inu To $0.000066 Could Be Possible In A Short Time

With the price of Shiba Inu rallying in the past few days, the crypto asset has garnered significant attention from investors as several experts predict a rise to new yearly highs.

In the same vein, cryptocurrency analyst and investor Rekt Capital has shared his optimistic prediction for Shiba Inu with the crypto community on the social media platform X (formerly Twitter), fueling hope of notable gains in the short term.

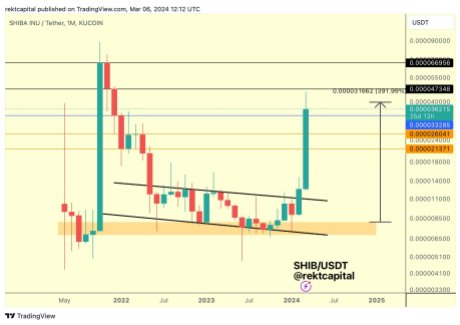
Rekt Capital’s analysis underlines the digital asset’s potential to soar higher to a level not seen for more than 2 years. The crypto analyst pointed out that SHIB arrived at a resistance he dubbed “Black Resistance,” which it previously rejected.

Shiba Inu

As a result, the meme coin must now “maintain the blue level” indicated in his chart as fresh support in order to create a “new Re-Accumulation Range at the highs possibly.” Due to this, the expert expects Shiba Inu to rise to the $0.000066 price level shortly.

The post read:

Shiba Inu Reached the black resistance which SHIB rejected from. Now SHIB needs to hold this blue level as new support to potentially develop a new Re-Accumulation Range at the highs.

Rekt Capital also highlighted another of his earlier forecasts, in which he projected the coin to reach the aforementioned price mark. At first, Rekt Capital noted that the asset had reached the blue resistance point.

Furthermore, he asserted that SHIB has increased by over 300%, since the initial post from November last year. In the post, the analyst claimed that SHIB regained the Orange area’s top as a support.

Consequently, SHIB ought to be able to return to the pinnacle of its “black market structure over time.” However, he presently anticipates Shiba Inu to undergo a rally after it concludes its “Macro U-shaped reversal.” 

SHIB Anticipated For A Potential Rebound

Amid the recent bearish sentiment around the market, Santiment – a crypto analytics platform, has identified SHIB as one of the leading assets that is poised for a potential recovery.

Data from Santiment shows that SHIB and dogwifhat (WIF) are the major coins expected by traders to undergo a rebound. This comes after the wild day that saw Bitcoin reach a new peak before markets went into a “reset mode.”

Santiment has also underscored a “speculative bullishness” for Solana (SOL) lately. This is a result of the speculation surrounding Solana’s potential to reach the $1,000 threshold.

SHIB at the time of writing was trading at $0.00003155, indicating a drop of 13% in the past day. Meanwhile, its market cap and trading volume are both down by 13% and 62% respectively.

Shiba Inu

14-Year Old Dormant Bitcoin Wallet Wakes Up To Crash BTC Price

The Bitcoin foray past its previous all-time high into new territory was short-lived as the crypto dipped in the hours after. On-chain data has shown an interesting scenario that contributed to selling pressure leading to the crash. According to Spot On Chain, a dormant Bitcoin address holding $67.1 million worth of Bitcoin recently came to life after 14 years of inactivity to sell all of its large holdings.

Bitcoin Wallet Wakes Up To Crash BTC Price

Bitcoin recorded a new all-time high of $69,200 during the week to surpass the previous record set in November 2021. This long-awaited Bitcoin milestone ignited a strong feeling of euphoria among crypto traders as it marked the first step to a six-digit Bitcoin price. However, this euphoria was short-lived as the new all-time high caused a wave of profit-taking among investors, which resulted in Bitcoin falling to $61,200 in the hours that followed.

On-chain data from Spot On Chain indicates that this crash was further exacerbated by a long-dormant Bitcoin whale. The whale address, which had remained inactive since 2010, woke up after the new Bitcoin all-time high to sell all of its holdings. 

According to Spot On Chain, the whale minted 1,000 BTC back in 2010 when the price was below $0.28. That would mean the Bitcoins were worth $280 at the time they were acquired. By the time they were sold on the crypto exchange Coinbase, the Bitcoins were worth $67,116 per coin, suggesting that the whale might have profited over $60 million.  

The Bitcoin blockchain is home to many active and dormant whale addresses. The reactivation of old, dormant wallets containing massive amounts of BTC like this one tends to attract the interest of investors about who owns them. The reactivation of dormant addresses is impossible to predict, and not all of them indicate profit-taking. 

What’s Next For BTC?

Bitcoin’s pullback after setting a new all-time high was anticipated by some expert traders. The crypto has since regained its footing after the dip and is now trading at $66,915. 

Most of the recent spike can be attributed to massive accumulation from traders and institutional inflow into Spot Bitcoin ETFs. Despite outflows from Grayscale’s ETF, the total net flow into the ETFs was $332 million yesterday. The total net flow since January 11 has now crossed over $8.895 billion. At the same time, Bitcoin whale transactions worth at least $100,000 now stand at $187 billion in the past seven days.

Bitcoin price chart from Tradingview.com

The $69,000 Bitcoin Question: Expert Forecasts When Price Will Breakout

As Bitcoin hovers near its all-time high, industry experts and investors are keenly watching for signs of its next major move. Alex Thorn, the Head of Research at Galaxy, recently shared his perspective on the Bitcoin price trajectory and the factors influencing its potential breakout. In a detailed post on X (formerly Twitter), Thorn provided insights grounded in historical data and current market dynamics.

“We Will Climb the Wall of Worry,” Thorn proclaimed, setting the tone for his analysis. Bitcoin’s recent price action saw it reaching $69,324 on Coinbase on Tuesday, marking its first all-time high since November 10, 2021. This milestone came after an 846-day period of anticipation and speculation, only for the price to retract 14.3% to an intraday low of $59,224. This volatility, exacerbated by $400 million in long liquidations within an hour, underscores the cryptocurrency’s unpredictable nature.

Despite the pullback, Bitcoin recovered, trading back at $67,000. Thorn remarked, “Volatility is back, and it’s likely to remain as we scale the wall of worry.” He compared the current situation to 2020 when Bitcoin first approached its then all-time high of approximately $20,000 from December 2017.

BTC faced initial resistance, experiencing a 12.33% drop after tapping the barrier twice, before ultimately surging ahead. This pattern highlights the psychological and technical challenges at previous all-time highs, a natural resistance point for any asset class. A similar (second) move could be necessary this time to shake all sellers out of the market.

How Bitcoin surpassed its ATH in 2020

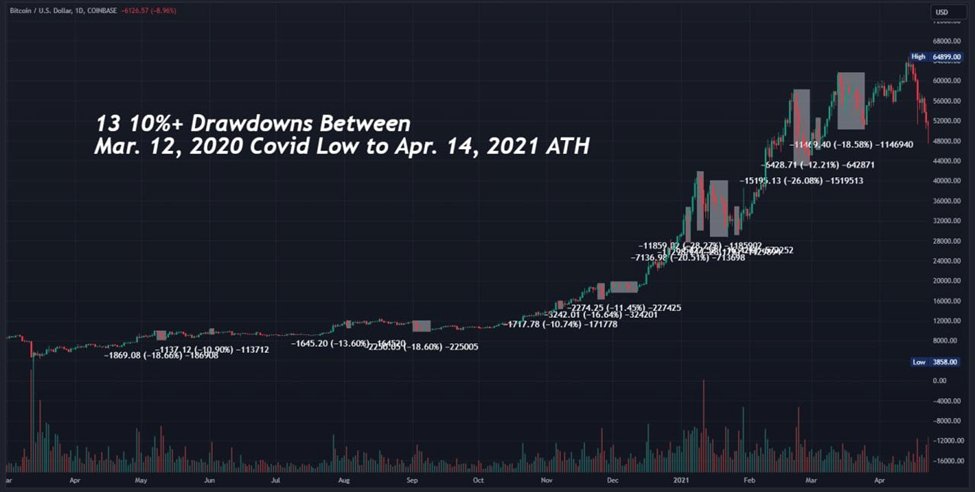
Describing the “Wall of Worry,” Thorn explained, “By my count, from Jan. 1, 2017 to the Dec. 17, 2017 all-time high of ~$20k, Bitcoin experienced 13 drawdowns of 12%+ (12 were 15%+, and 8 were 25%+). The same story played out in 2020. Between the Mar. 12, 2020 Covid low ($3858) and the Apr. 14. 2021 ATH of $64,899, there were 13 drawdowns of 10% or more (7 of them were 15% or more).”

Bitcoin drawdowns in a bull market

Notably, Bitcoin already had two 15%+ retracements since the spot ETFs launched on January 11. This week was the second one, the first major drawdown was directly after the ETF launch, with price plunging roughly 20%.

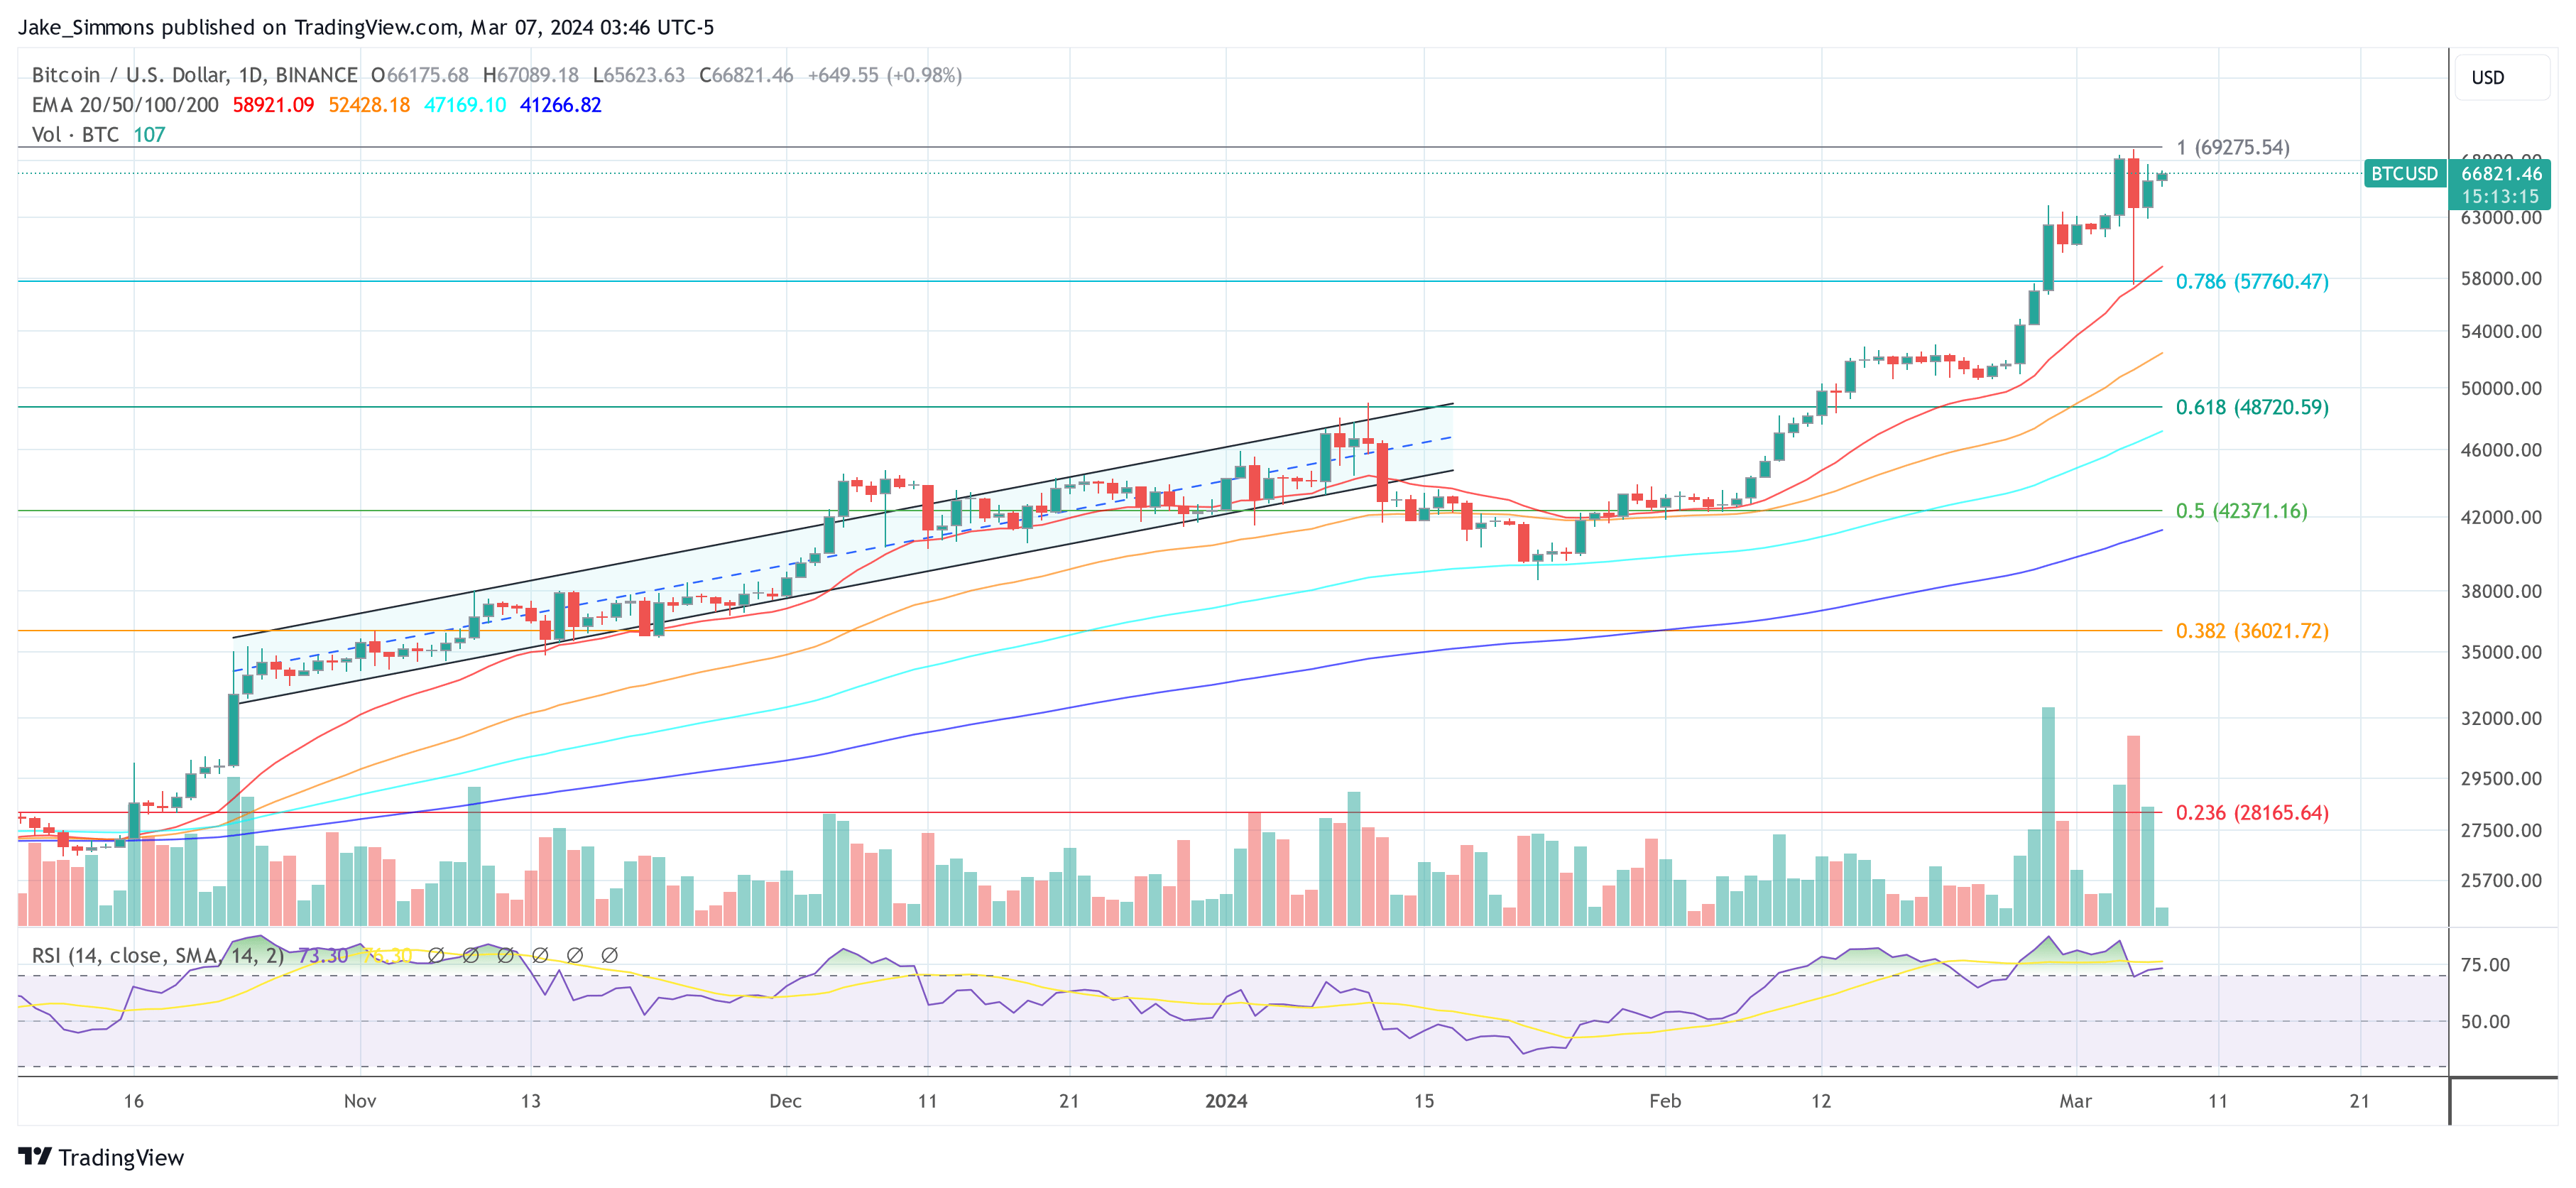
Why Bitcoin Is Just Getting Started

In his analysis, Thorn also touched upon the role of ‘old coins’ or long-held Bitcoin in shaping market movements. “Some old coins did revive and probably sell, possibly helping to create the intraday top,” he explained, pointing to blockchain data that indicated movement of coins mined as far back as 2010. This shift from old to new hands is characteristic of bull markets in Bitcoin, facilitating its broader distribution and acceptance.

Highlighting the significance of market sentiment and investment flows, Thorn noted, “And Tuesday was the Bitcoin ETFs largest ever day of inflows and second largest day of net inflows (+$648m) since DAY 1.” This impressive influx of capital into Bitcoin ETFs underscores the growing interest and confidence in the cryptocurrency, even amidst volatility.

Thorn remains bullish on Bitcoin’s future, suggesting that the current price dynamics are typical of the cryptocurrency’s bull markets, known for their non-linear progression and numerous corrections. He underscored the resilience and potential for growth despite the hurdles, stating, “nothing about yesterday’s price action makes me think we aren’t going higher.”

In conclusion, Thorn’s analysis provides a nuanced view of Bitcoin’s journey towards breaking its all-time high. By comparing current events with past market behaviors, Thorn offers a compelling case for Bitcoin’s continued ascent, but after a potential phase of consolidation with several taps of the all-time high before a definitive breakout. “Buckle up, folks. We are still just getting started,” he advises.

At press time, BTC stood at $66,821.

Bitcoin price

Bitcoin Price At Risk of Another Downside Thrust Before Higher

Bitcoin price is struggling to settle above the $68,000 resistance. BTC is now consolidating and might decline toward the $63,400 support zone.

  • Bitcoin price is struggling to gain pace for more gains above the new all-time.
  • The price is trading above $65,000 and the 100 hourly Simple moving average.
  • There is a short-term bearish trend line forming with resistance near $67,000 on the hourly chart of the BTC/USD pair (data feed from Kraken).
  • The pair could extend losses and revisit the $63,400 support zone.

Bitcoin Price Faces Hurdles

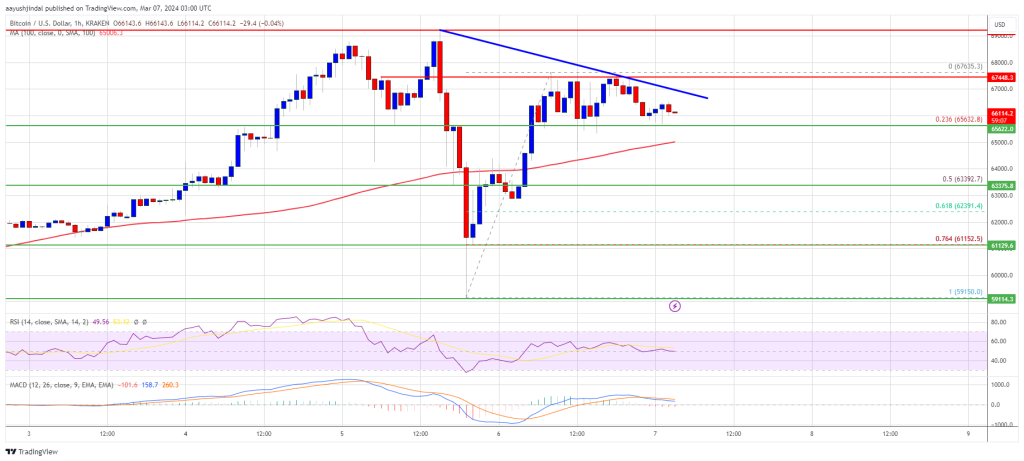
Bitcoin price started a nasty decline from the new all-time high of $69,218. BTC crashed to $59,150 before it trimmed losses. It climbed back above $65,000, but the bears are now protecting more upsides above the $67,500 level.

A high was formed at $67,635 and the price is now consolidating. It is trading above the 23.6% Fib retracement level of the upward move from the $59,150 swing low to the $67,635 high.

Bitcoin is still trading above $65,000 and the 100 hourly Simple moving average. Immediate resistance is near the $67,000 level. There is also a short-term bearish trend line forming with resistance near $67,000 on the hourly chart of the BTC/USD pair.

Bitcoin Price

Source: BTCUSD on TradingView.com

The next key resistance could be $68,000, above which the price could rise toward the $69,200 resistance zone. If there is a clear move above the $69,200 resistance zone, the price could rise toward the $70,000 level. Any more gains might send the price toward the $72,000 level.

Another Decline In BTC?

If Bitcoin fails to rise above the $67,000 resistance zone, it could start another downside correction. Immediate support on the downside is near the $66,650 level.

The first major support is $65,000. If there is a close below $65,000, the price could start a decent pullback toward the 50% Fib retracement level of the upward move from the $59,150 swing low to the $67,635 high at $63,400. Any more losses might send the price toward the $62,500 support zone.

Technical indicators:

Hourly MACD – The MACD is now gaining pace in the bearish zone.

Hourly RSI (Relative Strength Index) – The RSI for BTC/USD is now near the 50 level.

Major Support Levels – $65,000, followed by $63,400.

Major Resistance Levels – $67,000, $68,000, and $69,200.

Buckle Up: Bitcoin Set To Smash $150,000 Mark, Says Trading Guru – Here’s When

Peter Brandt, a respected figure in the trading community, has recently shared his insights on the Bitcoin future price potential. Through a post on X, Brandt ignited discussions within the crypto community by commenting on Bitcoin’s recent attainment of a new all-time high (ATH). More interestingly, he proposed when Bitcoin might scale new historic price heights.

Drawing from his experience in market analysis, Brandt speculated that Bitcoin could reach a price mark of $150,000 per BTC by October 2025, a prediction based on an in-depth analysis of Bitcoin’s price behaviour surrounding its halving cycles.

A Bullish Bitcoin Horizon

Brandt’s analysis, published in a document, delves into Bitcoin’s price patterns before and after its previous halvings. He suggests that, should the bull trend post-April 2024 mirror the pace observed since the November 2022 low, approaching the $150,000 milestone could be a likely scenario.

However, Brandt cautions that the trajectory of post-halving price advances has historically been “steeper” than their pre-halving counterparts. Brandt noted:

If the pace of the bull trend after Apr 2024 is at similar pace to the bull trend since the Nov 2022 low, then the high in Oct 2025 could be around $150,000. However, the post-halving advances during previous bull cycles have been much steeper than the pre-halving advances.

BTC to $150,000 as predicted by Brandt

Aside from Brandt’s predictions, the bullish sentiment on Bitcoin’s price is gaining momentum among various market analysts. Insights from Deribit and the analytics company GenesisVol suggest a potential rise of as much as 20.8% in Bitcoin’s price over the next month.

These analyses suggest the possibility of Bitcoin surpassing the $80,000 threshold, with more cautious predictions still expecting it to exceed $70,000.

This optimism follows a period of notable performance for Bitcoin. So far, Bitcoin has seen a minor 0.5% dip in the last 24 hours after dropping drastically from its newly established ATH of $69,328.

Bitcoin (BTC) price chart on TradingView

However, despite this decline, the asset has been up nearly 10% over the past week, maintaining its market capitalization above the $1 trillion mark.

Market Corrections: A Natural Part Of The Crypto Journey

Commenting on the dramatic drop in BTC after creating a new ATH, Alex Thorn, Head of Research at Galaxy Digital, provided insights, emphasizing that market corrections are common even within bull markets.

Thorn also highlighted the potential benefits of market consolidation following significant gains, suggesting that a pullback could be conducive to Bitcoin’s long-term health.

Featured image from Unsplash, Chart from TradingView

Cardano Dips: Is Now The Perfect Time To Buy ADA Before The Next Mega Rally? – Analyst Answers

Following a sharp decline in Cardano (ADA) value, which occurred in tandem with Bitcoin’s withdrawal from its latest all-time high (ATH) of $69,328, Dan Gambardello, a crypto analyst, has recently weighed in on the implications of this pullback for the broader bull market.

Particularly Gambardello views this development positively, suggesting it mirrors historical patterns that could signal a strengthening market for ADA.

Cardano’s Price Action And Bull Market Indicators

Dan Gambardello, a prominent figure in crypto analysis, elaborated on ADA’s recent price action, comparing it to the altcoin’s behavior in previous bull cycles.

He pointed out that similar pullbacks have historically preceded significant rallies for ADA, indicating potential for growth ahead.

This analysis comes after Bitcoin recently breached its all-time high (ATH). Gambardello labeled this breakthrough as the opening of “bull market doors,” a term used to describe a market condition that facilitates “parabolic spikes” in cryptocurrency values.

According to Gambardello, ADA’s current market phase, characterized by a “break of structure,” aligns with typical bull market patterns. Despite lagging behind Bitcoin in surpassing previous ATHs, ADA’s market behavior is consistent with a healthy bull market trajectory.

ADA’s Potential For Growth and Analyst Predictions

Dan Gambardello has also recently expanded on comparing ADA’s potential for growth and Ethereum’s historical performance, the second-largest crypto by market cap.

He suggests that ADA is poised for a “significant breakout,” just as Ethereum is, citing the development of decentralized finance (DeFi) projects on both platforms as catalysts for innovation and growth.

Adding to the optimism, recent forecasts from crypto exchange Changelly present a bullish long-term outlook for ADA. The exchange predicts that ADA could surpass the $10 mark by 2030, with expectations of continued growth leading to ADA eventually trading over $165 by 2040 and ending the year around $600.

Meanwhile, the asset is currently trading for $0.70, experiencing an 8.7% dip in the past 24 hours, yet it is still up roughly 15% over the past week. This recent increase has elevated the asset’s market capitalization to $25.7 billion today, with a trading volume exceeding $2 billion in the past 24 hours.

Cardano (ADA) price chart on TradingView

Featured image from Unsplash, Chart from TradingView