Bitcoin price started a fresh increase and it cleared the $62,000 resistance against the US Dollar. BTC traded to a new all-time high near $63,862 and it is likely to continue higher.
- Bitcoin extended its rise above the $62,000 and $63,000 resistance levels.
- The price is now trading well above the $62,500 level and the 100 hourly simple moving average.
- There is a bullish continuation pattern forming with resistance near $63,600 on the hourly chart of the BTC/USD pair (data feed from Kraken).
- The pair is likely to continue higher above $64,000 and $64,200 in the coming sessions.
Bitcoin Price is Gaining Momentum
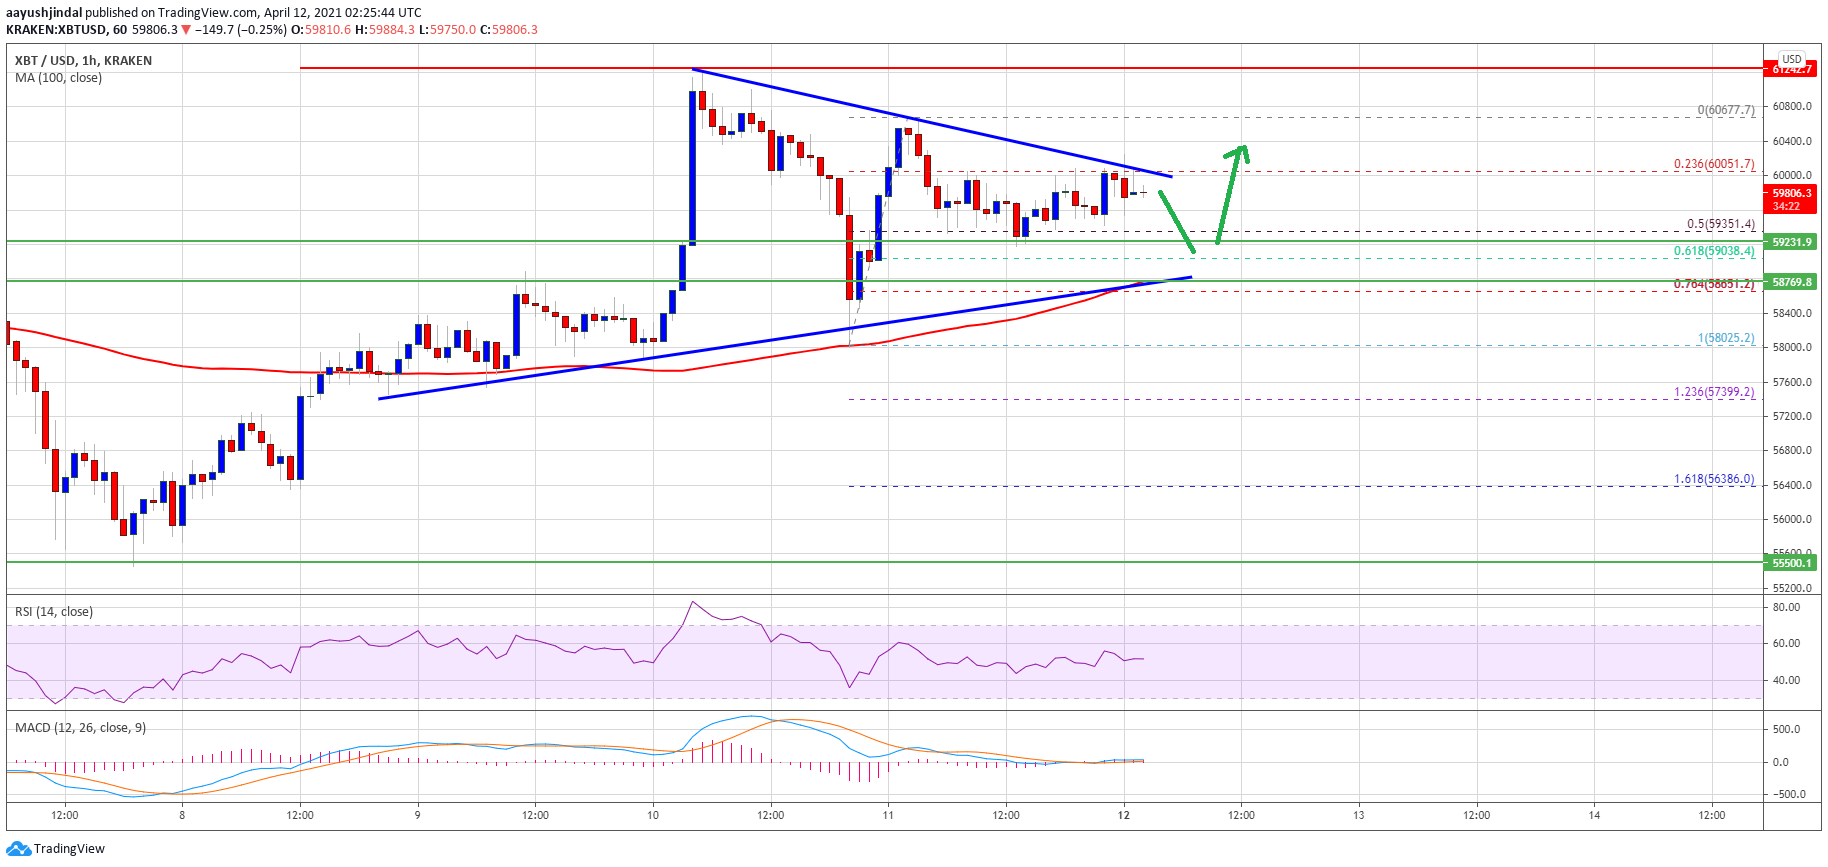
Bitcoin started a fresh increase after it broke the main $61,120 resistance zone. It opened the doors for more gains above the $62,000 resistance zone.
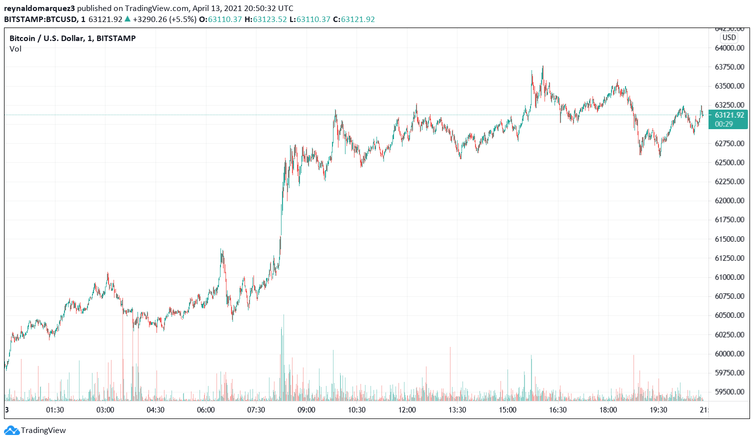
The price even cleared the $63,000 level and it traded to a new all-time high at $63,862. It is now trading well above the $62,500 level and the 100 hourly simple moving average. An immediate support is now forming near the $62,850 level.
The 23.6% Fib retracement level of the recent wave from the $59,692 low to $63,862 high is near the $62,850 level. There is also a bullish continuation pattern forming with resistance near $63,600 on the hourly chart of the BTC/USD pair.
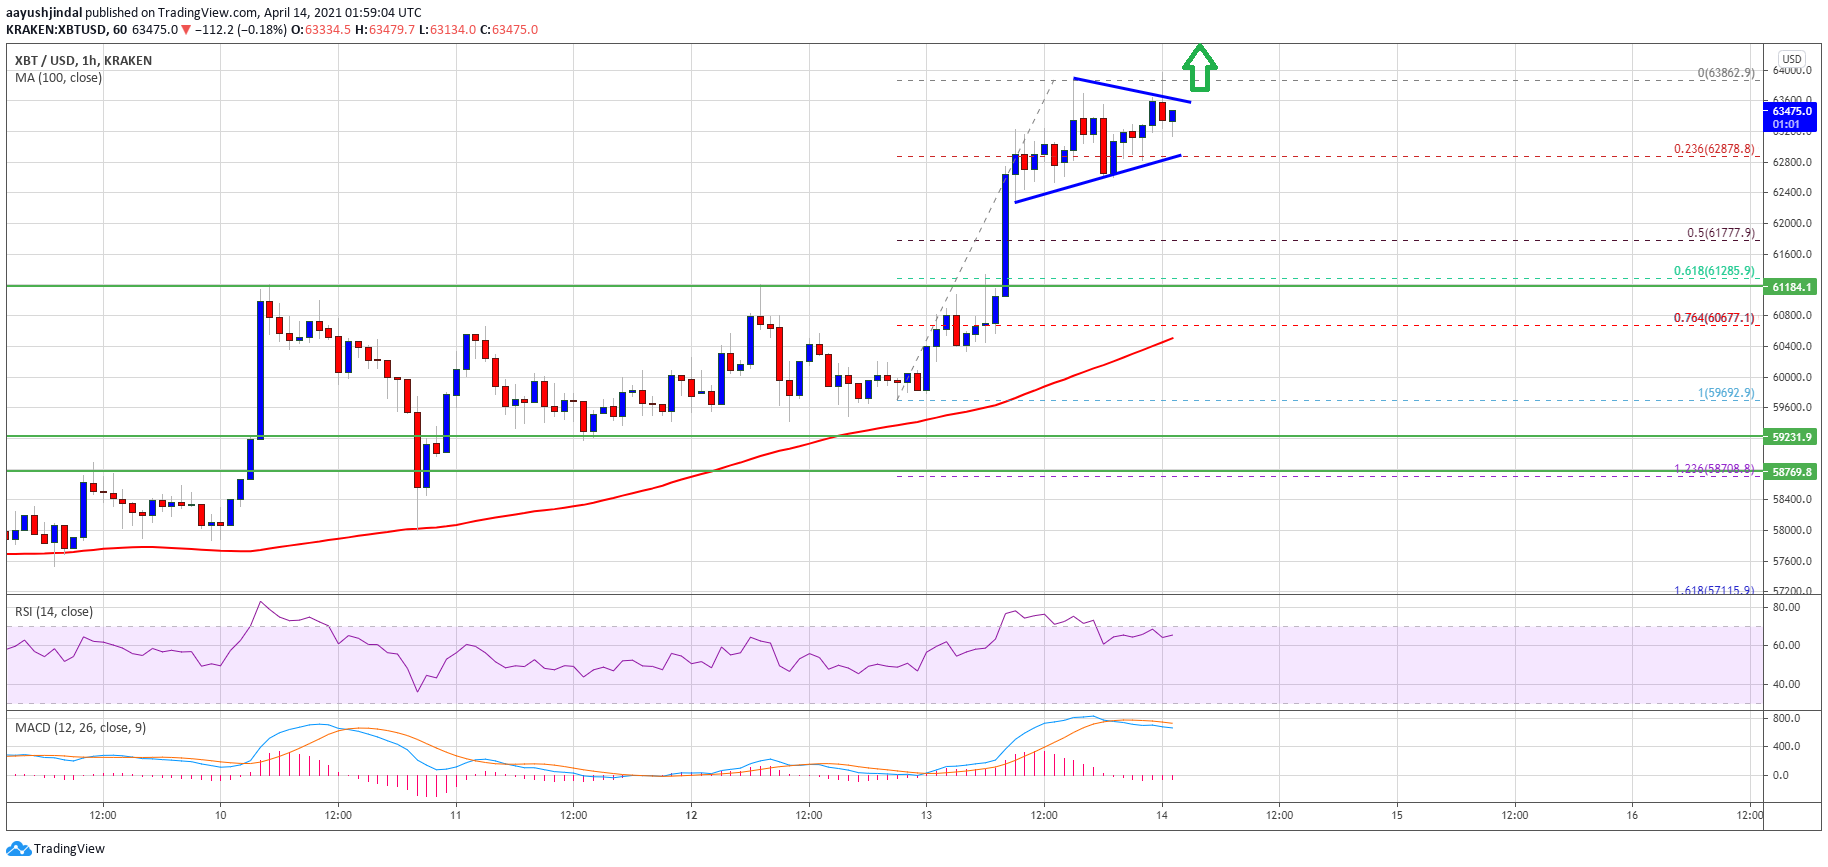
Source: BTCUSD on TradingView.com
If there is an upside break above the triangle resistance, bitcoin will most likely extend gains above the $63,862 high. In the stated case, the price could surge above the $64,000 level. The next major stop for the bulls could be $65,000 in the coming sessions.
Dips Supports in BTC?
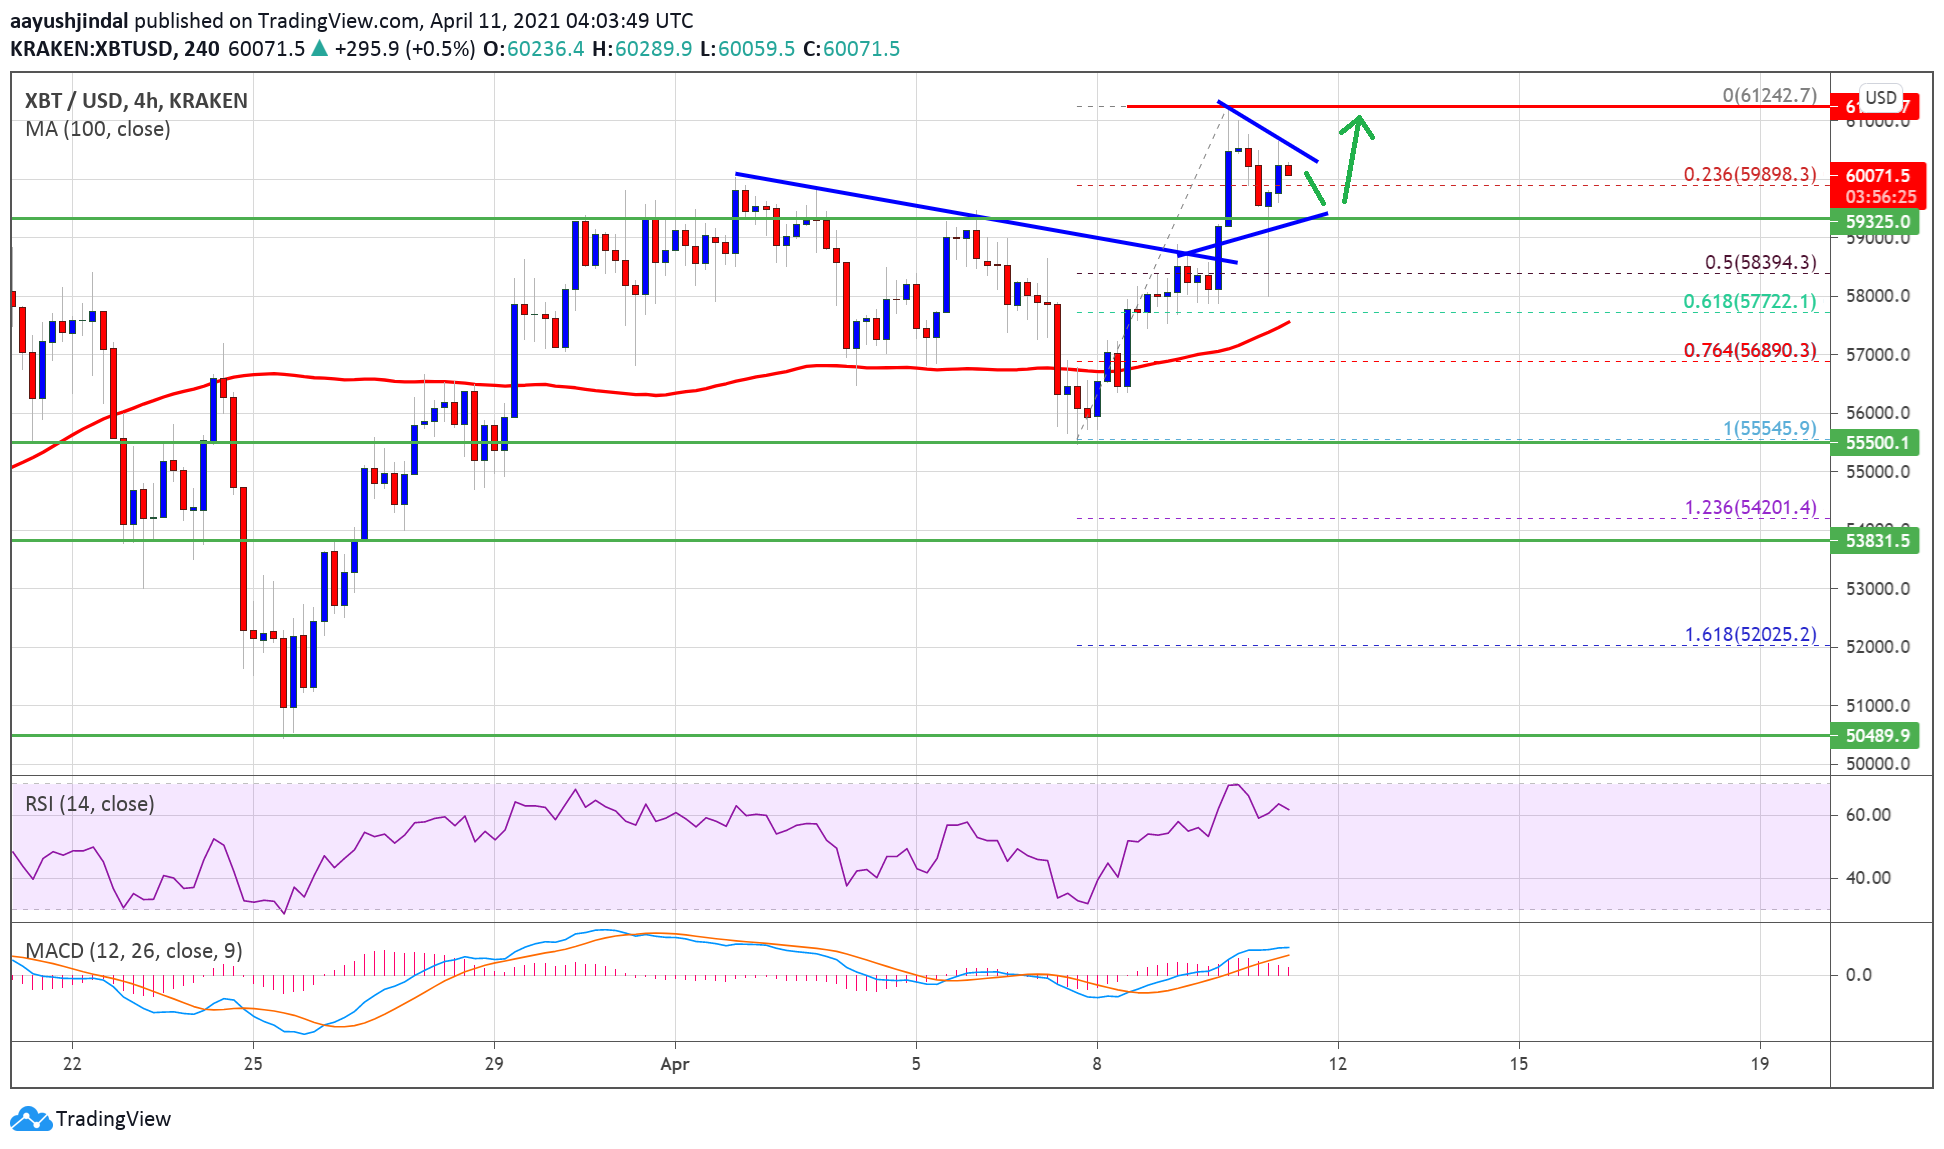
If bitcoin fails to climb above $63,500 and $63,850, there could be a short-term downside correction. An initial support on the downside is near the $62,850 level.
A downside break below the triangle support and $62,850 might call for a drop towards the $61,800 level. It is near the 50% Fib retracement level of the recent wave from the $59,692 low to $63,862 high. The main support is now forming near the $61,120 level (the recent breakout zone), where the bulls are likely to appear.
Technical indicators:
Hourly MACD – The MACD is now gaining momentum in the bullish zone.
Hourly RSI (Relative Strength Index) – The RSI for BTC/USD is now well above the 50 level.
Major Support Levels – $62,850, followed by $61,120.
Major Resistance Levels – $63,500, $63,850 and $65,000.


 “
“


 Also “
 Read the CoinTelegraph article
 The Tone Vays commission “