Trezor X Account Hacked: How Much Was Taken In The Fake Crypto Presale?

In the late hours of Tuesday, Trezor’s X account was compromised. The hacker used the hardware wallet company account to promote a fake crypto presale with a malicious link attached.

Members of the crypto community quickly realized the suspicious activity from the company and alerted other X users about the scam. Since then, Trezor’s team has regained control of the account.

Crypto Community’s Solidarity, Hackers’ New Prey

In the now-deleted tweets, the hacker announced that Trezor was “willing to support the $SLERF Community.” Taking advantage of the ongoing efforts from crypto projects and exchanges to raise funds for the affected participants of the Slerf presale debacle.

The unauthorized post offered the presale of a fake $TRZR token, which required interested users to send SOL to the hacker’s address. Additionally, Trezor supporters would receive a “separate bonus airdrop” if they went to a website linked in the post.

As it’s customary for phishing scams, the link would redirect to a wallet drainer that takes control of the person’s wallet after they try to “claim the airdrop tokens.”

The crypto community shared their thoughts on the hack. A user pointed out that the security breach was a “bad look” for the company as it focuses on crypto security. Others thanked the users who warned about the hack since it potentially saved them and others from falling for it.

It’s worth noting that many users have raised their concerns about the community’s reaction to the Slerf presale drama. They consider that raising funds for the participants affected sets a precedent of “bailing out” bad actors and will only “enable” similar behavior.

Moreover, scammers have been trying to prey on the community’s good faith to help potential victims and newcomers. As seen with the Trezor hack, the scammer seemingly tried to maximize its gains by utilizing the presale meta trend and the Slerf drama.

“Dumb” Hacker Or Smarter Community?

Usually, the recounting of crypto hacks ends with staggering figures being stolen, but for once, the tale is different. As reported by ZachXBT, the hacker managed to steal $8,100 from the unauthorized post, which includes the 25% drainer fee. As part of the loot, the hacker also received a “whooping 0.96 Solana,” as another user pointed out.

Many wondered if the small amount stolen was due to the community intelligently recognizing the scam or the hacker’s inability to perform a big heist. Whatever the case, this is a remarkable feat as the cold wallet company amasses over 200,000 followers that momentarily became potential victims.

Despite this small victory for the community, “It’s $8.1K more than 0,” as one user said. This raises the question of whether the hack was possible due to a lack of proper security measures or an inside job taking place.

No official explanation has been given yet. Nonetheless, Trezor acknowledged the hack in an X post earlier today.

The company affirmed that the hack happened despite its “robust protections,” including two-factor authentication (2FA). At the time of writing, Trezor is continuing its investigation. The statement closed with a message for all users to “remain vigilant.”
crypto, BTC, BTCUSDT

Bitcoin Pre-Halving Dip Expected: Will BTC Rally Before US Fed Decision?

Bitcoin remains under pressure when writing and is within a bearish formation following sharp losses on March 19. While prices tank, one analyst on X thinks this retracement aligns with historical performance, especially as the network prepares to slash miner rewards in April 2024. 

Bitcoin Retracement Similar To Pre-Halving Cool-Off Of 2020

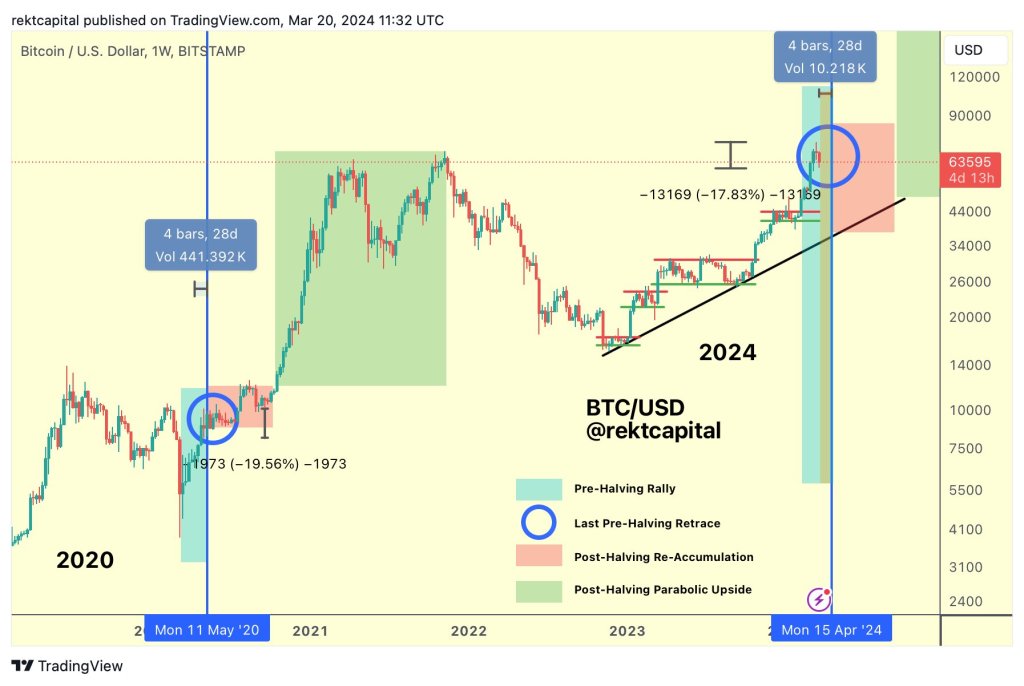
Based on the analyst’s assessment, BTC is currently down roughly 18% from its recent swing high. This retracement is at the same level as the ballpark 19% decline observed before the previous halving event in 2020. 

Bitcoin pre-halving rally | Source: analyst on X

It’s worth noting that Bitcoin has historically corrected lower after posting fresh highs before halving. Afterward, the coin rallies to fresh all-time highs following halving, driven by a decrease in supply. In this cycle, BTC soared to a new all-time high of $73,800 in the first two weeks of March before cooling off to spot rate, a deviation from the usual trend.

As the Bitcoin network gears up for the halving event in mid-April 2024, it’s crucial to note the potential market implications. Some market observers speculate that the current drop could offer entries for investors looking to accumulate at a lower price in anticipation of future price gains. 

From the Bitcoin candlestick arrangement in the daily chart, the least resistance path appears southwards. Specifically, following the dip on March 19, the coin remains in a bearish breakout pattern, finding strong rejections from the middle Bollinger Band (BB) or the 20-day moving average. The BB is a technical indicator for gauging volatility.

Bitcoin price trending downward on the daily chart | Source: BTCUSDT on Binance, TradingView

Will The Federal Reserve Revive BTC Demand?

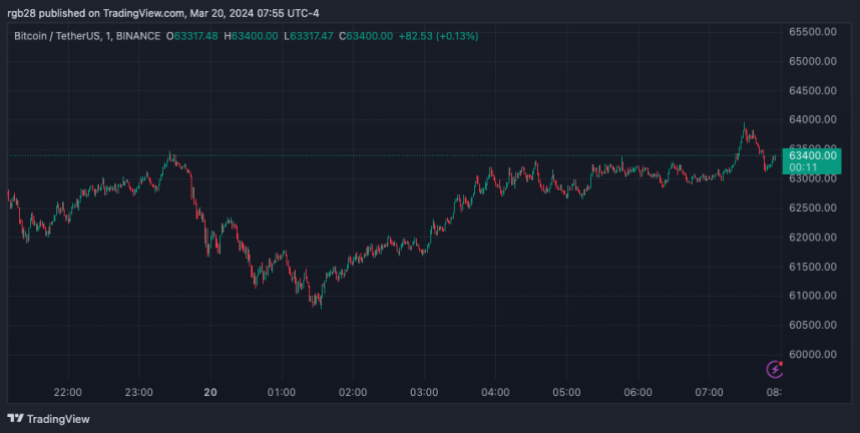
Currently, Bitcoin is steady. Even so, only time will tell whether prices will recover, breaking above the $70,000 level in the days leading up to the halving event in less than a month. Further losses from spot rates mean the dip before halving and after the pre-halving rally was much sharper than in 2020.

As history clearly shows, halving is an important event in Bitcoin. It has repeatedly proven to be a major price catalyst for Bitcoin, as seen in the last bull cycle when prices rose to roughly $70,000. 

Accordingly, the coming days will shape how Bitcoin prices evolve in the medium to long term. One key driver of crypto and BTC valuation will be fundamental events, especially pronouncements from the United States Federal Reserve (Fed). The central bank will relay its decision on interest rates on March 20. Earlier in 2022, when interest rates were hiked, prices tanked.

Altcoins Shows Buy Signals, Massive Opportunity Beckons: Analyst

As the price of Bitcoin (BTC) continues to demonstrate a major fall in valuation, indicating a gloomy attitude toward the crypto asset, the bulls in the market are hopeful that the market will soon enter another Season for Altcoins.

Altcoins Showing Massive Buying Opportunity 

Bitcoin’s recent dip signaled the beginning of the decline in the cryptocurrency market, causing several altcoins to drop significantly. However, many cryptocurrency analysts believe that the drop in these altcoin prices might serve as an opportunity for future gains since the alt-season is on the horizon.

Popular cryptocurrency expert and trader Michael Van De Poppe has revealed his optimism in the altcoin market, highlighting the significant opportunities of getting into these tokens before the alt-season begins.

According to Michael Van De Poppe, “some altcoins have now dropped by over 40%” in comparison to their past all-time high. As a result, Poppe believes that this is the right time for investors to purchase these digital assets to position themselves for future gains.

Poppe noted he normally invests in these tokens “during bull cycles when they are about 25% to 60% less expensive.” This demonstrates the crypto expert’s confidence in the assets to rally in the coming months.

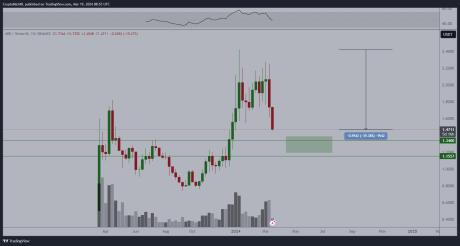
While pointing out the massive opportunities in the market, Poppe has underscored Arbitrum (ARB) as one of the altcoins investors should watch out for. He believes that ARB could realize substantial gains in time, as the token is down and poised for a new leg UP.

Altcoins

Recently, there have been notable advancements in the crypto asset’s price, demonstrating momentum for an upward movement. As of the time of writing, ARB was trading at $1.70, indicating an over 10% increase in the daily timeframe.

However, in the weekly and monthly timeframe, ARB is down by 22% and 15%, respectively. Meanwhile, Arbitrum’s market capitalization has increased by roughly 10% to exceed the $4.5 billion threshold.

Top ALTs To Purchase After Bitcoin’s Retracement

On-chain analyticS platform Santiment has also highlighted the drop in altcoins as a shot to garner profits in the upcoming months. Santiment pointed out several altcoins that offer a “possible bullish opportunity,” following Bitcoin’s crash today to a two-week low of $61,700.

Some of the tokens listed by Santiment are BOUNCE, LDO, OMG, STORJ, and SNX. The MVRV Opportunity and Danger Zone Model, according to Santiment, shows that many altcoins have now declined to the point where mid-term trading returns are in an “opportunity zone.” However, when an asset’s 30-day, 90-day, and 365-day average wallet returns add up to be negative, “this zone is breached.”

Even with the recent general correction, the altcoins market appears to be headed toward a favorable long-term picture. Consequently, this presents an excellent chance for investors to purchase these digital assets at a reduced cost.

Altcoins

Bitcoin Supply On Exchanges Hit 4-Year Low, But Why Is Price Crashing?

Certain Bitcoin fundamentals suggest the flagship crypto token is well primed for further growth in this bull market. However, its recent price decline has sparked concerns about the reason for this downward trend despite everything pointing to a sustained upward movement. 

Bitcoin Supply On Exchanges Hit 4-Year Low

Data from the on-chain analysis platform CryptoQuant highlighted that the supply of Bitcoin on exchanges has seen nearly a 40% drop in 4 years and is reducing ahead of the Bitcoin halving. This underscores the bullish sentiment around the Bitcoin ecosystem as the decreasing supply on supply suggests that most investors have no plans to sell their holdings anytime soon. 

The CryptoQuant data also noted that Bitcoin’s demand is outpacing its supply, which is said to have been the prevailing trend since 2020. This development offers a bullish narrative as it can continue to increase Bitcoin’s value since “scarcity boosts perceived value.” This trend is also expected to be sustained once the Halving occurs since miners’ supply will be cut in half

Interestingly, the imbalance between Bitcoin’s demand and supply has led crypto analysts like MacronautBTC to believe that BTC’s price could rise to as high as $237,000. As such, there are still high expectations for Bitcoin despite the crypto token hitting a new all-time high (ATH) of $73,750. 

Why Bitcoin’s Price Is Crashing

Crypto analyst Alex Kruger has outlined different reasons why Bitcoin’s price is crashing despite its strong fundamentals. The first reason he alluded to was the fact that crypto traders in the derivatives market look to be overleveraged, possibly because greed seems set to be setting in with traders deploying more capital in anticipation of further price surges. 

Kruger mentioned that the ETH could also be dragging the market down with the hopes of the SEC (Securities and Exchange Commission) approving the Spot Ethereum ETFs waning. Bitcoinist recently reported that the approval odds for these investment funds have plummeted immensely in the past few months, dropping to an alarming 35%. 

The third reason that Kruger mentioned is the negative Bitcoin ETF inflows, which have become a trend lately. Interest in these Bitcoin funds has cooled off, with investors opting to take profit instead. On March 19, BitMEX Research revealed that these ETFs saw a record net outflow of $326m. 

Crypto trader and analyst Rekt Capital also suggested that Bitcoin is already in the ‘Final Pre-Halving Retrace.’ Therefore, significant price corrections can be expected ahead of the Halving event, which is set to take place in April. 

At the time of writing, Bitcoin is trading at around $63,000, down in the last 24 hours, according to data from CoinMarketCap. 

Bitcoin price chart from Tradingview.com

High-Stakes Week For Bitcoin And Ethereum As Central Bank Decisions Approach: Key Predictions

This week could mark a pivotal moment in the first quarter of 2024 for the entire crypto market and the two largest cryptocurrencies, Bitcoin (BTC) and Ethereum (ETH), as major central banks, led by the Bank of Japan and the US Federal Reserve (Fed), prepare to announce their interest rate decisions

According to crypto futures exchange Blofin, these announcements will set the tone for monetary policy in the coming months. The impact of safe-haven sentiment has led to a pullback in both BTC and ETH prices, with traders expressing greater optimism for BTC. 

Bitcoin Price Movement Range Projected At 9.78%

As per a recent on-chain analysis report released by the exchange, crypto traders are expecting BTC’s price movement range to reach 9.78% over the next seven days, with a projected 30-day range of 20.33%. 

However, despite the expected volatility, the report indicates that traders remain bullish on BTC in the medium to long term. 

Skewness analysis suggests that price declines and pullbacks are expected to induce volatility, but the duration of this round of pullback is expected to be relatively short. Risk aversion to macro uncertainty is seen as the primary trigger. 

The latest dealers’ gamma distribution supports the expected wide range of BTC price fluctuations, with gamma peaks around $65,000 and $75,000. With the quarterly settlement approaching, market makers’ influence on BTC price movement is gradually recovering, providing support during price drops but making it challenging to surpass the $75,000 level. 

Bitcoin

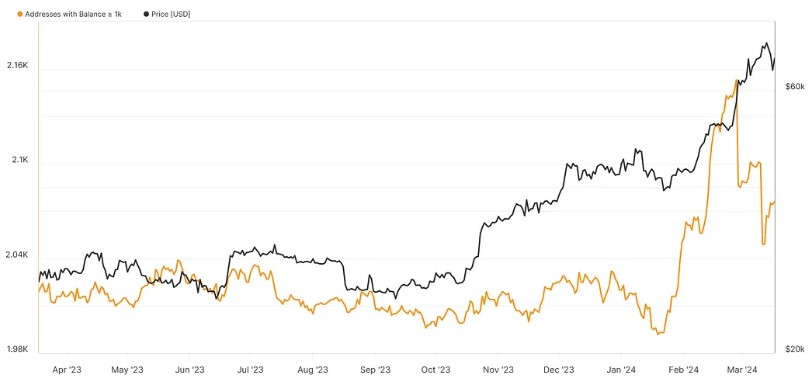
In addition, on-chain data shows a decline in spot investors’ enthusiasm for buying BTC, although the number of addresses holding more than 100 BTC continues to increase, as seen in the chart above. The reduced number of addresses holding over 1,000 BTC suggests that significant holders have decided to sell at BTC’s new highs. 

Despite caution over potential price fluctuations, the hedging effect contributes to the increasing possibility of BTC price stabilization, making holding BTC a favorable choice.

Bearish Sentiment Dominates Front-Month Options For Ethereum

According to the report, similar to BTC, traders expect relatively high volatility levels for ETH in the short term, with projected price movement ranges of 10% over seven days and 20.32% over 30 days. However, the report suggests that traders are less optimistic about ETH’s future performance compared to Bitcoin. 

Furthermore, Blofin finds that bearish sentiment dominates the front-month options, while bullish sentiment remains favorable in the back-months. Blofin emphasizes that expectations of rate cuts may support the ETH price, but the pricing of Ethereum tail risk indicates “increased pessimism” regarding significant events impacting the ETH price, with spot Ethereum ETFs seen as a potential trigger. 

Finally, Blofin explains that the high leverage of altcoins has long been a “source of risk” in the cryptocurrency market. The recent price decline has led to the liquidation of many highly leveraged altcoin positions, resulting in lower annualized funding rates for perpetual contracts. 

This deleveraging of altcoins, coupled with their relatively small market share of less than 20%, has helped to mitigate risk and contribute to market stability, according to the report. However, despite the overall decline in altcoin leverage, speculation in meme coins continues.

Bitcoin

At present, the price of Bitcoin stands at $62,500, reflecting a significant decline of 7.5% within the last 24 hours. Similarly, Ethereum is trading at $3,276, experiencing a 6.8% drop during the same period.

Featured image from Shutterstock, chart from TradingView.com

Bitcoin Price Crashes To $60,800: Is The Worst Over? Experts Weigh In

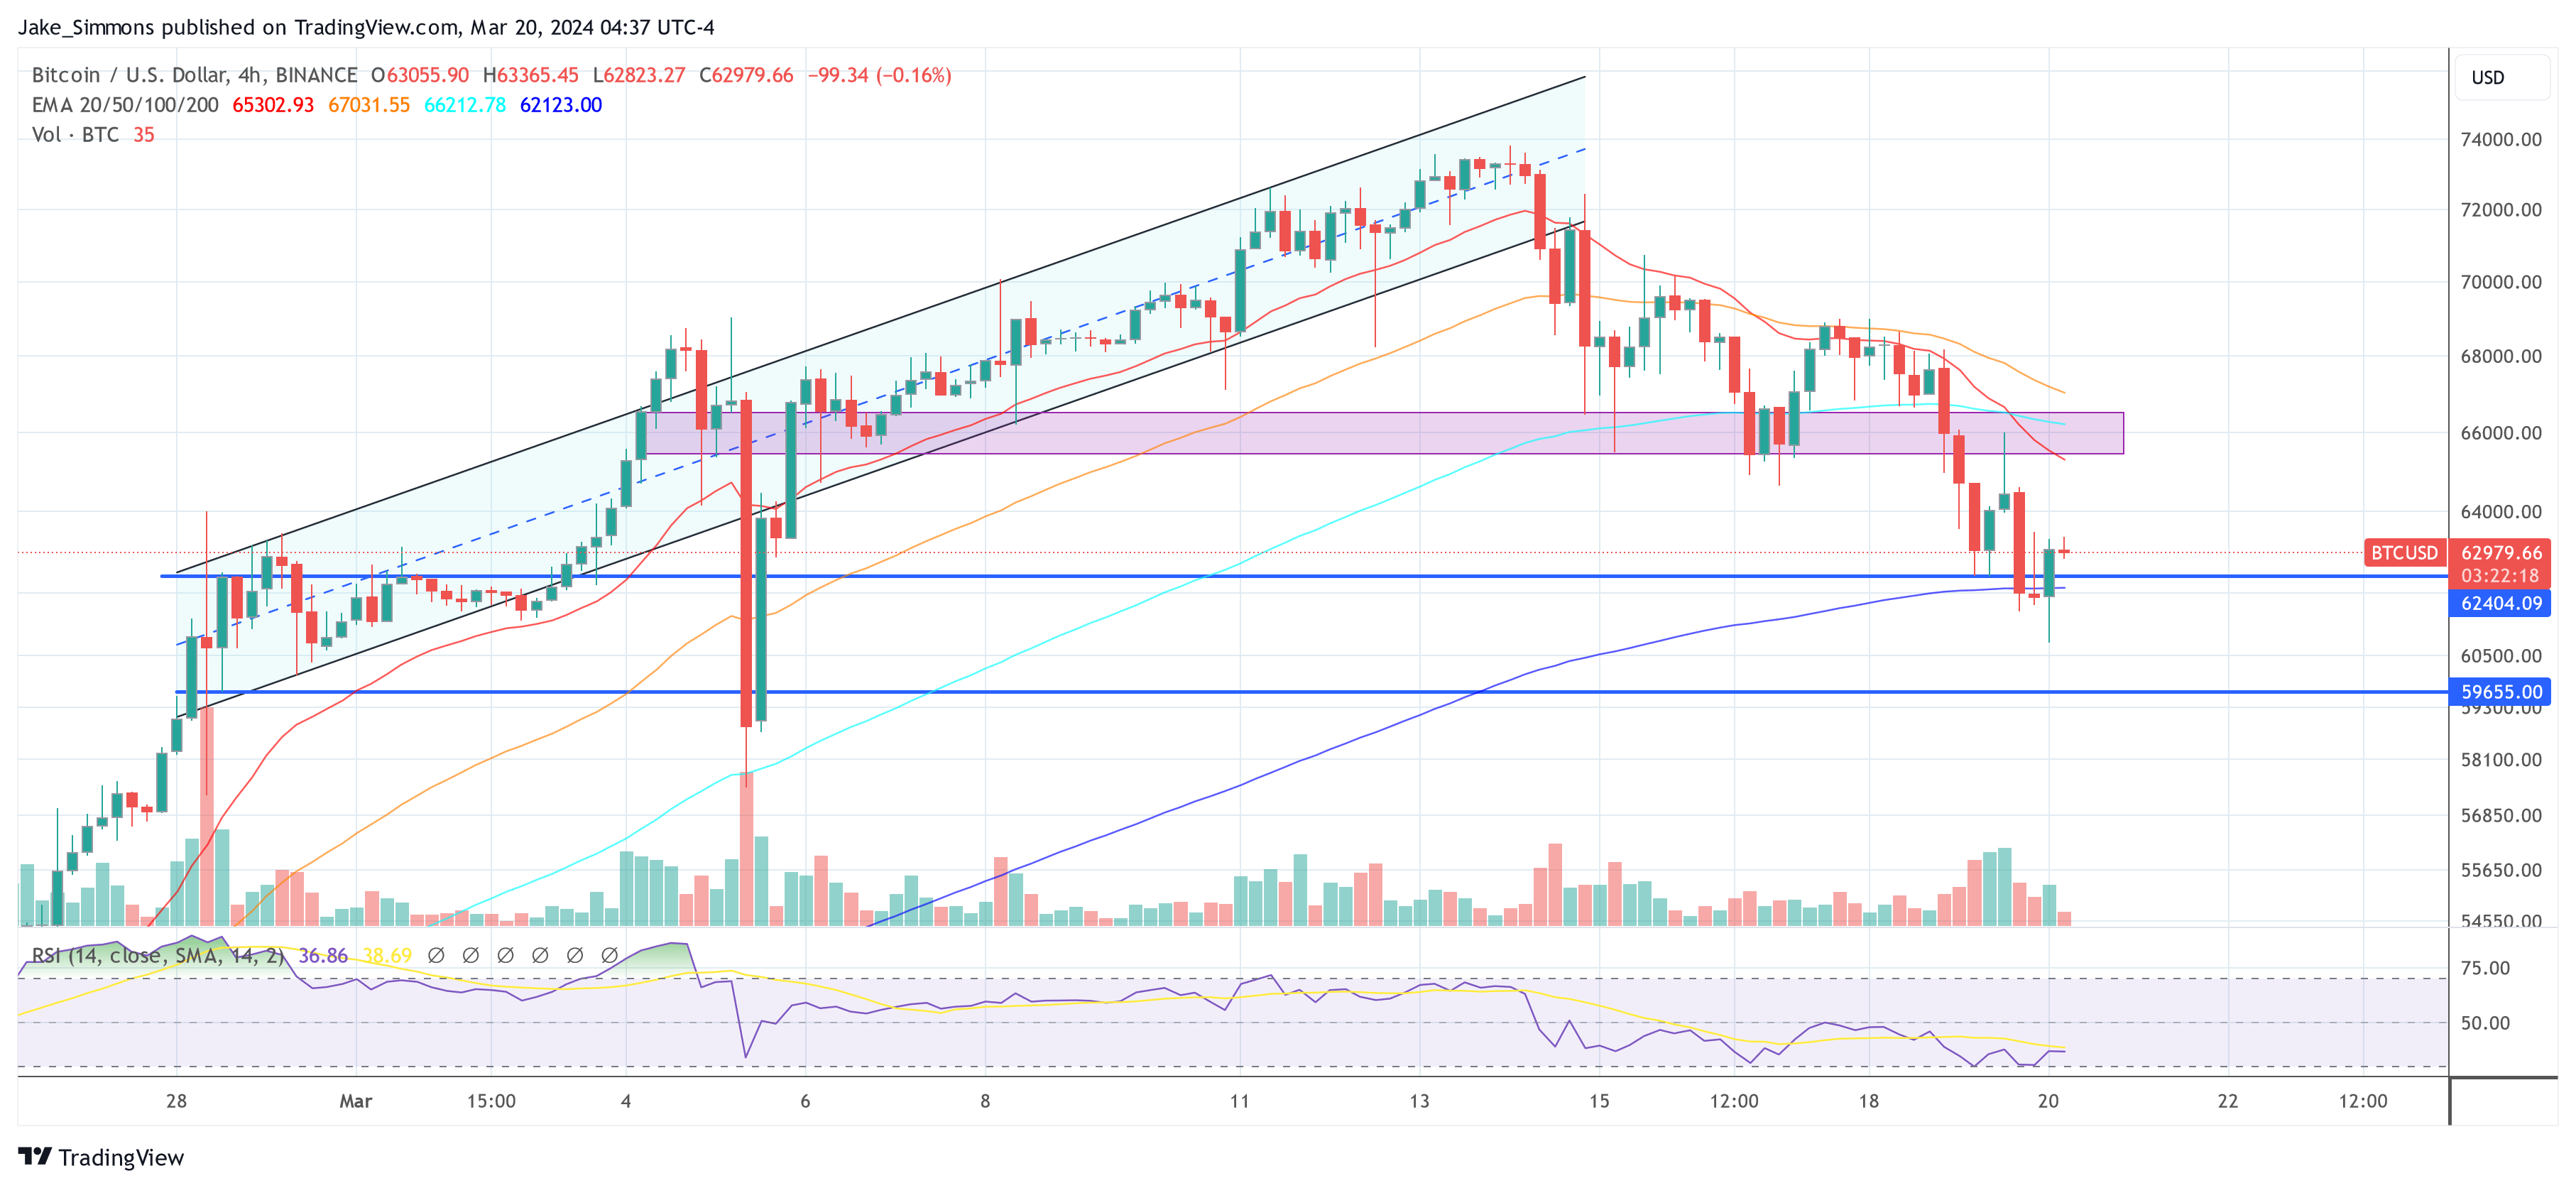
Bitcoin has experienced a sharp decline from its March 14 high of over $73,600 to today’s low of under $60,800, translating to a -17% loss in value. This significant drop has prompted a flurry of activity on social media platforms, particularly X (formerly Twitter), where crypto experts have been fervently discussing the potential reasons behind this downturn and speculating on what the future holds for the world’s leading cryptocurrency.

Unpacking The Bitcoin Crash: Expert Opinions

Alex Krüger, a respected figure in both macroeconomics and crypto, was quick to identify the primary factors contributing to Bitcoin’s price collapse. According to Krüger, the crash can be attributed to several key factors: excessive leverage in the market, Ethereum’s negative influence on overall market sentiment due to ETF speculations, a notable decrease in Bitcoin ETF inflows, and the irrational exuberance surrounding Solana memecoins, which he refers to disparagingly as “shitcoin mania.”

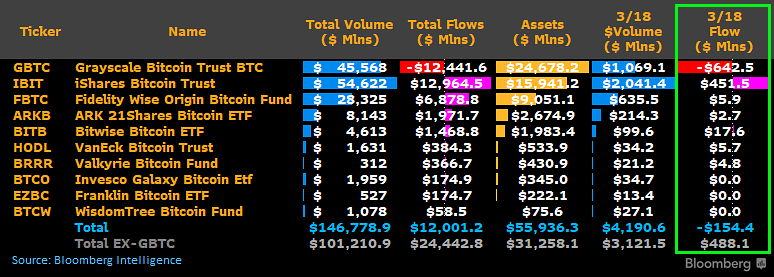
WhalePanda, another influential voice within the crypto space, pointed out the alarming rate of ETF outflows, with a record $326 million leaving the market yesterday. This movement has been particularly detrimental to GBTC, which saw outflows of $443.5 million.

In contrast, Blackrock’s inflows stood at a mere $75.2 million, marking its second lowest to date. Also, Fidelity saw just $39.6 million in inflows. “Not much to say, this is bad for the price and we’ll probably see lower now because this news affects the sentiment as well. Let’s see what the flows are tomorrow. Positive thing is that we’re roughly 30 days from halving, and GBTC is getting rekt,” he remarked.

Charles Edwards, founder of crypto hedge fund Capriole Investments, provided a historical perspective on Bitcoin’s recent price move, suggesting that a 20% to 30% pullback is within the norm for Bitcoin bull runs.

“A normal Bitcoin bullrun pullback is 30%. Back in December, we were already in the longest winning streak in Bitcoin’s history. A 20% pullback here takes us to $59K. A 30% pullback would be $51K. These are all levels we should be comfortable expecting as possibilities,” he stated.

Rekt Capital provided an analysis of Bitcoin’s price retracements since the 2022 bear market bottom, noting that the current pullback is only the fifth major retrace, with all previous ones exceeding a -20% depth and lasting from 14 to 63 days. In sum, there are two key takeaways about this current retracement

The closer Bitcoin gets to a -20% retrace, the better the opportunity becomes.

Retraces need time to fully mature (at least 2-3 weeks, at most 2-months).

Alex Thorn, head of research at crypto giant Galaxy Digital had previously warned of the likelihood of significant corrections during bull markets, suggesting that the current retrace is relatively standard. “Two weeks ago i warned that big corrections aren’t just possible but *likely* in Bitcoin bull markets. At -15%, this is pretty standard historically. Bull markets climb a wall of worry.”

Macro analyst Ted (@tedtalksmacro) focused specifically on the implications of the upcoming Federal Open Market Committee (FOMC) meeting. He highlighted the massive outflows from spot BTC ETFs, attributing them to traders’ cautious stance ahead of the FOMC decision and the potential impact of tax season in the US.

However, following the drop to $60,800, Ted suggested that the market might have fully priced in the worst-case scenario, hinting at a potential bullish reversal if the FOMC’s decisions align with market expectations for interest rate cuts by the end of the year. He stated:

Time to bid. FOMC hedging done, worst case priced. Only thing that happens from here is that those protective positions unwind into or on the event today. Bulls should step up here soon. […] The market has fully priced in another hold from the Fed at today’s meeting, and is pricing 3 rate cuts from them by the end of the year. Anything that strays away from this from today’s new economic projection / dot plot material will make the market move sharply.

At press time, BTC traded at $62,979.

Bitcoin price

Bitcoin Price Turns Red Below $64K But Long-Term Uptrend Intact

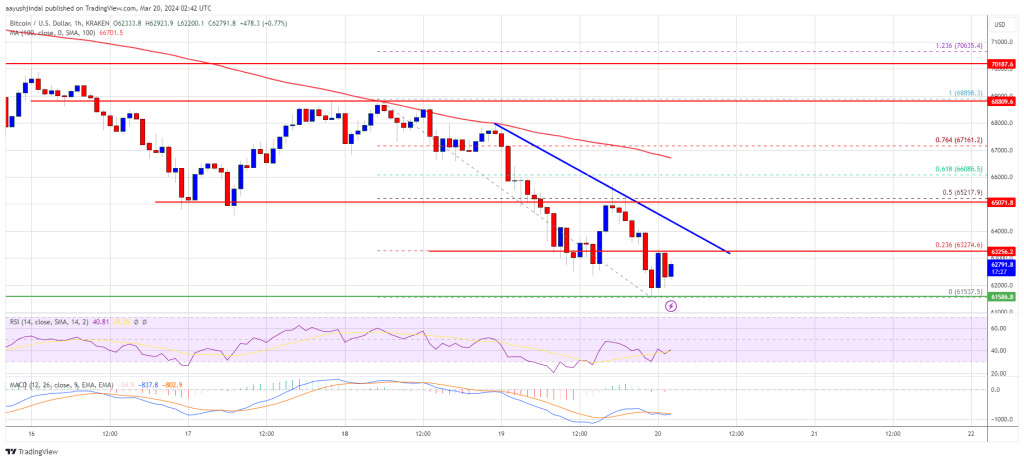
Bitcoin price extended its decline below the $65,000 support. BTC is now struggling to stay above the $62,000 support zone and might test $60,000.

  • Bitcoin price is moving lower below the $64,000 support zone.
  • The price is trading below $63,500 and the 100 hourly Simple moving average.
  • There is a connecting bearish trend line forming with resistance at $63,300 on the hourly chart of the BTC/USD pair (data feed from Kraken).
  • The pair could start a decent upward move if it clears the $65,200 resistance zone in the near term.

Bitcoin Price Grinds Lower

Bitcoin price remained in a short-term bearish zone below the $66,500 zone. BTC traded below the $65,000 and $64,000 support levels to set a new weekly low.

There was a push below the $62,500 support. A low was formed near $61,537 and the price is now consolidating losses. The price is now struggling below the 23.6% Fib retracement level of the recent decline from the $68,898 swing high to the $61,537 low.

Bitcoin is now trading below $63,500 and the 100 hourly Simple moving average. Immediate resistance is near the $63,300 level. There is also a connecting bearish trend line forming with resistance at $63,300 on the hourly chart of the BTC/USD pair.

Bitcoin Price

Source: BTCUSD on TradingView.com

The first major resistance could be $64,000. If there is a clear move above the $64,000 resistance zone, the price could even attempt a move toward the $65,200 resistance zone. It is close to the 50% Fib retracement level of the recent decline from the $68,898 swing high to the $61,537 low. Any more gains might send the price toward the $67,000 level.

More Losses In BTC?

If Bitcoin fails to rise above the $63,300 resistance zone, it could continue to move down. Immediate support on the downside is near the $62,000 level.

The first major support is $61,500. The next support sits at $60,500. If there is a close below $60,500, the price could start a drop toward the $60,000 level. Any more losses might send the price toward the $58,800 support zone in the near term.

Technical indicators:

Hourly MACD – The MACD is now gaining pace in the bearish zone.

Hourly RSI (Relative Strength Index) – The RSI for BTC/USD is now below the 50 level.

Major Support Levels – $61,500, followed by $60,000.

Major Resistance Levels – $63,300, $64,000, and $65,200.

Get Ready For Liftoff: XRP Set For 20% Surge Against Bitcoin, Predicts Analyst

Recently, a renowned figure in the crypto analysis sphere, CrediBULL Crypto, has spotlighted XRP with a bullish prediction. According to the analyst, XRP is on the verge of a significant rally that could surge its value against Bitcoin in the coming period.

XRP Price: Anticipating The Surge

CrediBULL Crypto has been closely monitoring XRP’s movements against Bitcoin. Through analysis, he observed an interesting trend within the XRP/BTC trading pair that suggests an upcoming uptick.

The key to this prediction is identifying an accumulation phase happening at a lower timeframe within a higher demand zone. This pattern is not new to the analyst, who has identified similar trends.

The insights provided by CrediBULL Crypto indicate a potential 15-20% rally for XRP against Bitcoin in the near term. Should the altcoin break through the next major resistance, which is pegged 35% higher, the analyst believes this could trigger a surge, rewarding investors with returns exceeding 100% against BTC.

A week before this bullish forecast, CrediBULL Crypto had already increased its position on the XRP/BTC pair, driven by an “RSI divergence” observed on the 3-day chart. Such divergences are often harbingers of a significant market turnaround, suggesting that the altcoin had entered a pivotal region ripe for a bullish reversal.

XRP’s Foundation For Growth

The potential for XRP isn’t just a matter of speculative trading. Other market experts have highlighted the cryptocurrency’s fundamentals. Zach Rector, a prominent voice within the crypto community, has also recognized the altcoin’s potential.

By drawing parallels with Bitcoin, Rector points out the foundation of XRP and the XRPL, setting the stage for XRP’s significant impact in the next market upturn.

Analyst Dark Defender also sees a bright future for the altcoin, predicting a climb to the $1.33 price level as an immediate target. Moreover, he suggests that reaching the $1.88 and $5.85 Fibonacci targets in the forthcoming weeks is well within the realm of possibility

Meanwhile, despite facing a downturn with a 13% decline, followed by a further 1% drop in the last 24 hours, the altcoin’s trading price remains resilient at $0.6.

XRP price chart on TradingView

Featured image from Unsplash, Chart from TradingView

Record-Breaking GBTC Outflows Send Bitcoin Down 14% To $62,000

As reported by Fortune Magazine, the cryptocurrency market has been experiencing significant volatility as Bitcoin (BTC) has experienced a sharp decline that has had a domino impact on other cryptocurrencies. The recent drop in the price of Bitcoin, coupled with outflows from Grayscale’s GBTC, has raised concerns among investors. 

Bitcoin Sees 14% Correction From ATH

Bitcoin suffered a 14% drop since reaching its all-time high (ATH) of $73,700 last week, briefly touching $62,483 on Tuesday morning. However, it recovered and stabilized around $64,900, just below the $65,000 mark. 

The decline was attributed to record outflows of over $640 million from Grayscale’s Bitcoin Trust (GBTC). In comparison, other spot Bitcoin ETFs saw inflows of less than $500 million, resulting in a net outflow of $15 million on Monday, according to Bloomberg ETF expert James Seyffart. 

Bitcoin

This outflow from GBTC, combined with the cautious sentiment surrounding the Federal Open Market Committee (FOMC) meeting in the US, has had a significant impact on Bitcoin’s performance.

As recently reported by NewsBTC, investors exhibited caution ahead of the FOMC meeting, closely monitoring the potential changes in interest rates. Recent higher-than-expected inflation data, as indicated by the US Consumer Price Index (CPI) and Producer Price Index (PPI), dampened expectations of interest rate cuts. 

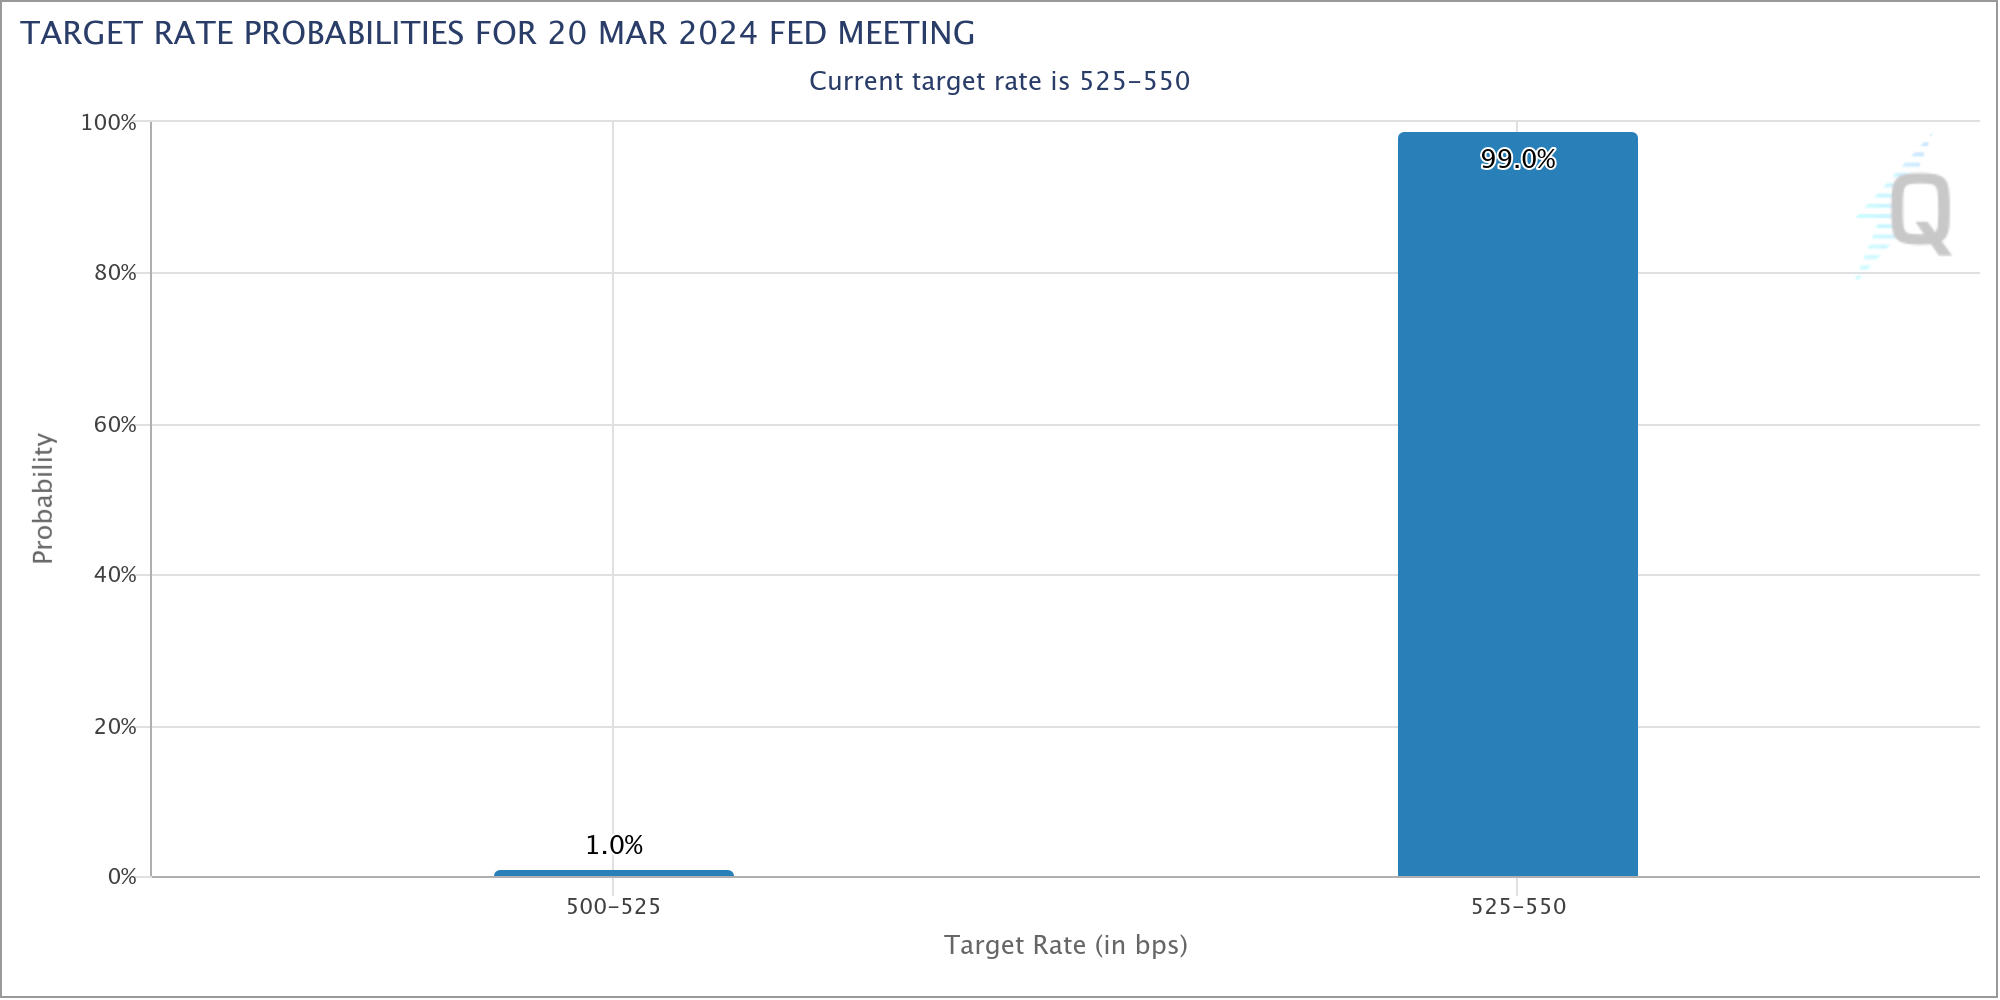
According to Fortune, the CME FedWatch Tool projected a 99% likelihood of rates remaining unchanged, further affecting market sentiment. Per the report, investors were keen to gauge the Federal Reserve’s stance on monetary policy, contributing to the cautious trading environment.

In the same context, the Bank of Japan raised its key interest rate from -0.1% to 0% to 0.1% in response to rising consumer prices. This was the first rate increase in 17 years.

Crypto Futures Traders Take A Hit

The drop in Bitcoin’s price had a cascading effect on other cryptocurrencies. Major altcoins like Ethereum (ETH) and Solana (SOL) experienced significant declines of 8.1% and 12.5% over the past 24 hours, respectively. 

Meme coins, including Floki Inu (FLOKI), Bonk Inu (Bonk), and Dogecoin (DOGE), also suffered losses of 34%, 28.5%, and 24.8%, respectively, during the past week. 

The decline in cryptocurrency prices resulted in over $440 million worth of liquidations for traders of crypto futures. Traders who had leveraged positions betting on higher prices faced significant losses. Most of these liquidations occurred on Binance, totaling $212 million, followed by OKX at $170 million. 

Bitcoin

Despite its price correction, BTC retains substantial gains of over 26% and 132% in the past thirty days and year-to-date timeframe, respectively.

Featured image from Shutterstock, chart from TradingView.com

Bitcoin Halving Retrace Spooks Investors: What Is It And Why Does It Matter?

The Bitcoin price crash over the past day has taken crypto investors by surprise, leading to a full bleed day for the industry. However, while this may have come as a shock to many, some were able to call it out ahead of time. One of those is Rent Capital, which said the decline was in line with Bitcoin’s established halving trend.

An Expected Crash

The analysis posted by Rest Capital outlines the trends that Bitcoin has followed leading up to its halving months. In 2020, the halving fell on the month of May and in the month leading up to the rally, the Bitcoin price saw an approximately 20% decline.

Over the years, Bitcoin has followed similar patterns to usher in the anticipated halving and while there has been some deviation this time around, the digital asset looks to be maintain some trends. One of these trends is the price crash before the halving.

As Rekt Capital’s analysis shows, Bitcoin is right in region of where this crash is expected to happen. The previous trends have seen the price fall between 20% and 38% in the month before the halving. So taking this into account, the BTC price could crash around 25% on average if it sticks to this trend.

The crypto analyst also revealed their target for if Bitcoin follows this trend. The crash is expected to push the BTC price below the $40,000. However, if the average plays out, then the price could bottom out above $40,000 before rebounding.

Why This Crash Is Important For Bitcoin

The crash is a confirmation that the Bitcoin price is following the established pre-halving trend and also confirms the incoming bull market. Going by the previous trends, the halving takes place after the crash, following which there is some upside the is seen with the cryptocurrency.

Then, in the months following the halving, there is massive accumulation that serves as a precursor to the bull market. In this case, this accumulation is expected to begin sometime in April 2024 and then continue on for a few months.

The crash, as Rekt Capital points out, also serves as the last opportunity for cryptocurrency investors to get into position at the lowest prices. This is because once the halving is complete and the bull market begins, low prices become a thing of the past.

At the time of writing, the BTC price is seeing minor recovery from its crash below $63,000. It I trading at $63,500, but with a 5.91% decline on the daily chart and a 12.19% decline on the weekly chart, according to CoinMarketCap.

Bitcoin price chart from Tradingview.com

Bitcoin Might Be Poised For A ‘Double Pump Cycle,’ Reveals Analyst – Here’s Why

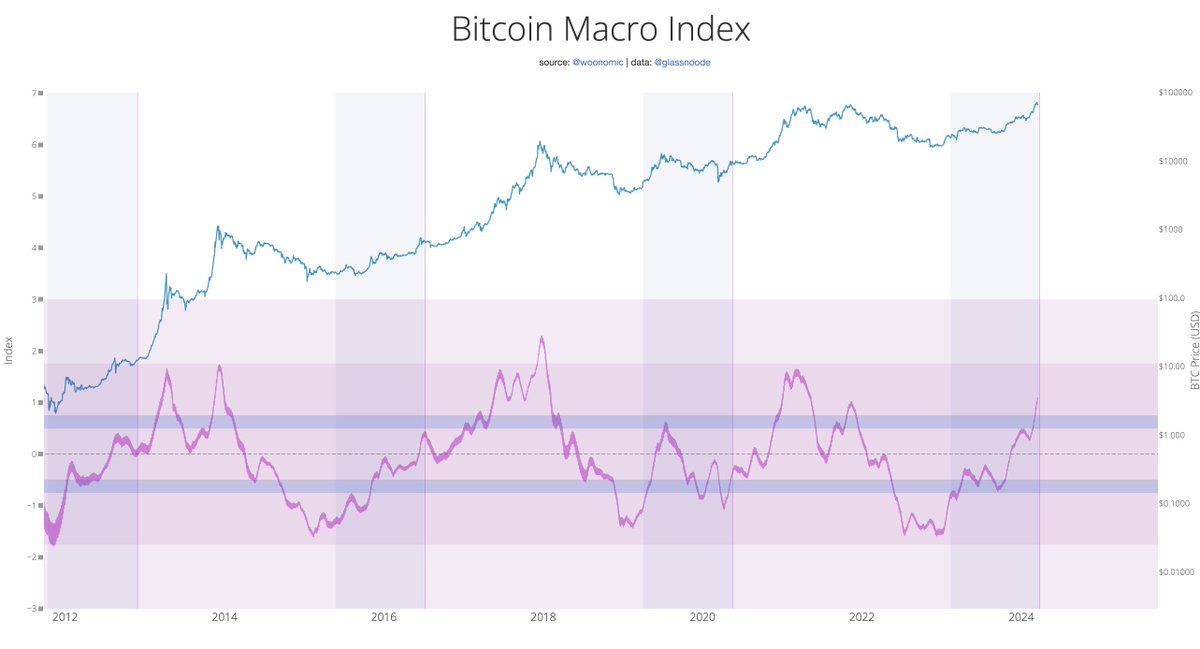
Bitcoin’s recent downturn has prompted renowned crypto analyst Willy Woo to offer a fresh perspective on the cryptocurrency’s future trajectory. Woo’s analysis, based on the surge in Bitcoin’s Macro Index, suggests an optimistic outlook for the leading digital currency, potentially indicating a pivotal shift in market dynamics.

Unveiling Bitcoin Double Pump Prediction

Willy Woo, a figure well-respected in the cryptocurrency analysis sphere, has recently shared insights that paint an intriguing future for Bitcoin.

According to Woo, the notable increase in the Bitcoin Macro Index could signal more than just a recovery; it might be the precursor to a rare “double pump” cycle.

Bitcoin Macro Index

Drawing parallels with the market patterns 2013, Woo’s forecast points towards two significant price surges for Bitcoin in the coming years. He anticipates the first peak by mid-2024 and a second, even more substantial top in 2025.

This dual surge scenario, though historically uncommon, aligns with Woo’s analysis of current market conditions and Bitcoin’s intrinsic growth potential.

Navigating Through The Bearish Terrain

Meanwhile, the past week has not been kind to BTC, with the asset experiencing a roughly 10% decline. This downward trend extended over the past 24 hours, seeing Bitcoin’s value dip by 4.9%, bringing its price to around $65,000—a sharp fall from its recent peak above $73,000.

Bitcoin (BTC) price chart on TradingView

Amid this bearish price action, IntoTheBlock, a notable crypto analytics firm, suggests the $61,000 level as a critical demand zone, highlighted by the significant volume of Bitcoin purchased at this price point.

This area is deemed attractive for accumulation by institutional investors and large-scale traders, suggesting a possible recovery in the near future.

Additionally, as Bitcoin navigates its current market challenges, cryptocurrency analyst Charles Edwards points out that a typical pullback during a Bitcoin bull run amounts to about 30%.

With BTC having experienced its longest winning streak in history, a corrective dip to $59,000 or even $51,000, as per some predictions, remains within the realm of possibility.

These levels represent potential buying opportunities for investors looking to capitalize on Bitcoin’s cyclical nature and its anticipated ascension post-pullback.

Featured image from Unsplash, Chart from TradingView

Crypto Report Says ‘Alameda Gap’ Is Gone After Bitcoin Rally, What This Means

In its most recent research newsletter, crypto research firm Kaiko alluded to an ‘Alameda Gap,’ which has been massively impacting the Bitcoin and crypto market for some time now. However, that seems to be in the past, as Kaiko stated that the gap no longer exists. 

What The Alameda Gap Is About

According to the report, the ‘Alameda Gap’ is the gap in liquidity that existed after the collapse of the collapse of the defunct crypto exchange FTX and its sister company Alameda Research. Alameda was one of the most prominent market makers then and provided massive liquidity to the market. 

Following Alameda’s collapse, this liquidity gap is said to have persisted as market makers “waited on the sidelines for sentiment and trading activity to recover.” Now, the market looks to have moved past this, as Kaiko revealed that, as of last week, the market depth has almost fully recovered and is back to its pre-FTX average

The research firm added that the Bitcoin 2% market depth is up 40% year-to-date (YTD) and briefly surpassed its pre-FTX average of $470 million. This increase is said to have been mainly due to the surge in Bitcoin’s price, which has risen faster than the market liquidity since the SEC approved the Spot Bitcoin ETFs in January. 

Bitcoin is up about 50% YTD and has already hit new highs since the beginning of the year, including a new all-time high (ATH) of $73,750. Meanwhile, the improvement in liquidity is also evident in the fact that the cost of trading has declined on the three major US crypto exchanges: Coinbase, Kraken, and Bitstamp. 

How Bitcoin Is Outperforming Gold

Kaiko also highlighted in its report that the Bitcoin-to-Gold ratio, which measures both assets’ relative performance, is inching closer to its ATH, which it last hit in November 2021. Interestingly, this increase means that BTC is outperforming Gold, even though both assets have recorded ATHs these past few weeks. 

Furthermore, funds linked to these assets show how Bitcoin has outperformed Gold. Kaiko noted that Bitcoin ETFs have attracted $11 billion since they launched in early January. Meanwhile, the largest physically-backed Gold ETFs (SPDR Gold Shares (GLD) and iShares Gold Trust (IAU) have registered outflows during the same period. 

Kaiko suggested that this could mean that investors were moving towards Bitcoin as the “new global store of value.” Interestingly, the CEO of Jan3 and Bitcoiner, Samson Mow, while giving reasons why Bitcoin will hit $1 million, also mentioned that people will start demonetizing Gold and substitute it for BTC at some point.  

Bitcoin price chart from Tradingview.com

Bitcoin Plunges Under $63,000, Here’s Where Next On-Chain Support Is

Bitcoin has deepened its decline in the past day with its price now slipping below $63,000. Here’s where the next potential support is, according to on-chain data.

Bitcoin Could Find Support At These Price Levels

In a new post on X, analyst Ali has discussed how the Bitcoin support and resistance levels are looking like right now based on on-chain data from Glassnode.

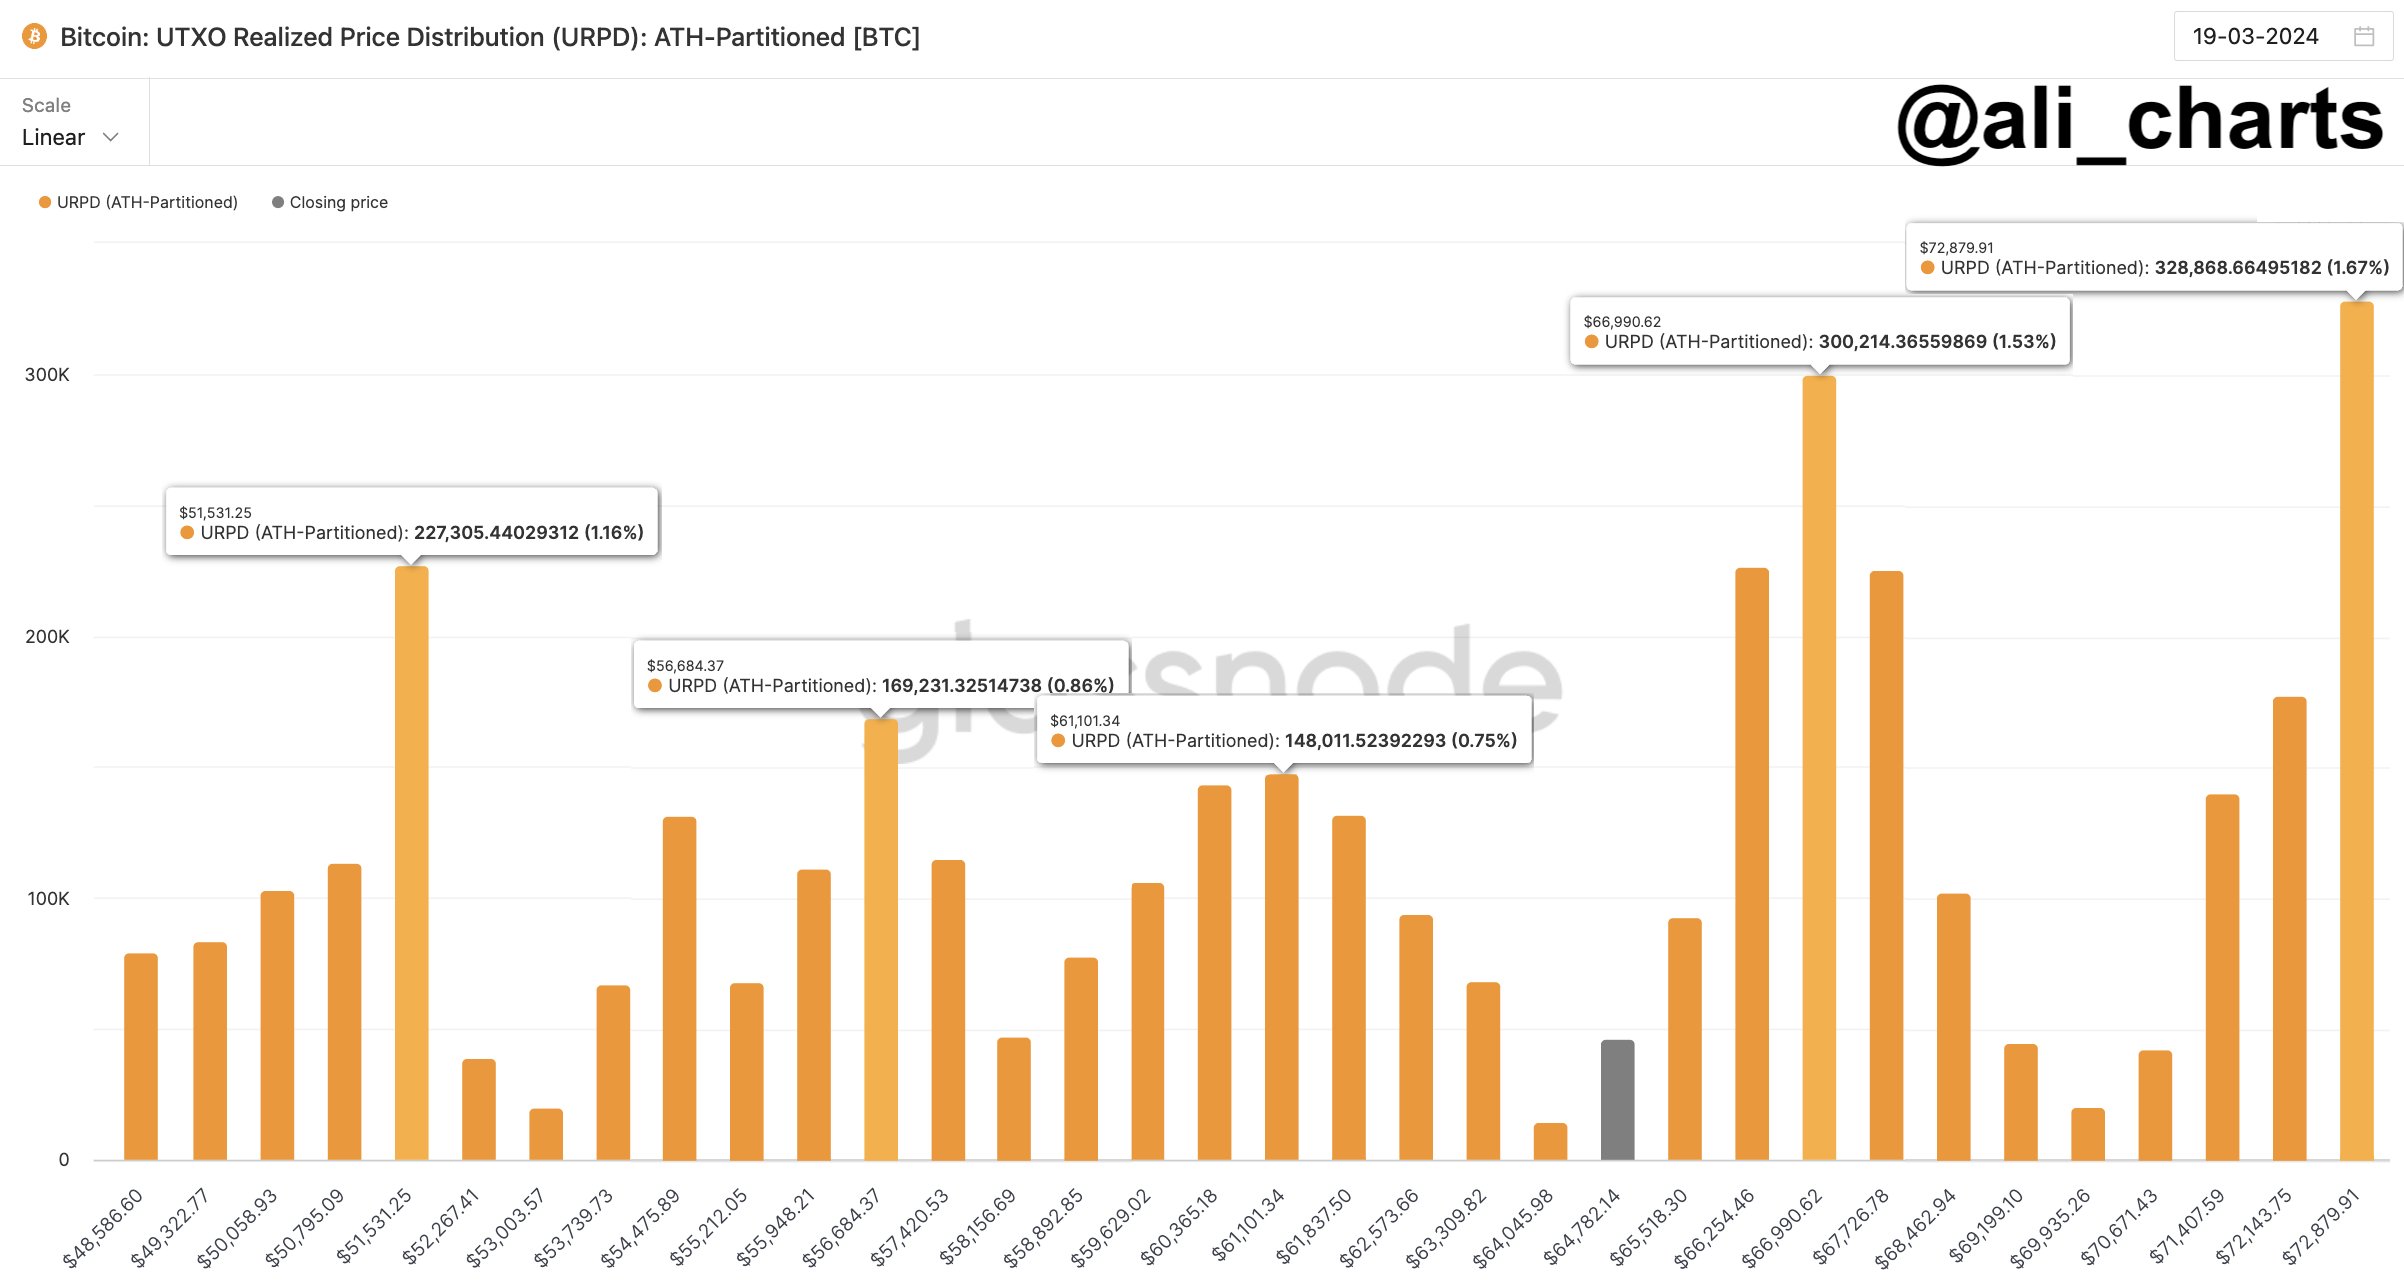
The indicator of relevance here is the “UTXO Realized Price Distribution” (URPD), which, in short, tells us about the amount of coins (or more precisely, UTXOs) that were last purchased at any given price level that the asset has visited in its history so far.

Below is the chart shared by the analyst that shows the data for this distribution for the price levels around the recent spot value of the cryptocurrency:

Bitcoin URPD

From the graph, it’s visible that there are a few price levels not far from the current one that particularly stands out in terms of the amount of buying that took place at them.

In on-chain analysis, the potential for any level to act as support or resistance is based on the total number of coins that have their cost basis at the level in question.

Levels thick with coins that are situated under the current price would be probable to act as points of support, while those above the spot value could prove to be resistance walls.

As is apparent from the graph, the $61,100, $56,685, and $51,530 levels are the ones below the current price that hold the cost basis of a notable amount of the supply right now. Naturally, this means that should the decline continue further, these would be the levels to watch for a possible rebound.

Two levels above, however, are even larger than all three of these support levels: the cost basis centers around $66,990 and $72,880. Interestingly, the latter of these is the single largest acquisition level out of all the price levels listed in the chart, implying that a large amount of FOMO buying has occurred at the asset’s all-time high levels.

In the scenario that Bitcoin regains its upward momentum, these levels of high cost basis population would be where the asset could be most probable to find some trouble.

Now, as for why acquisition centers are considered relevant for support and resistance in on-chain analysis is the fact that investors are likely to show some kind of reaction when a retest of their cost basis takes place.

When such a retest is from above, the holders may decide to accumulate more, believing that the price will go up again in the future. On the other hand, they may sell instead if the retest is from below, as they may think exiting at break-even is better than risking another drop.

A large number of coins having their cost basis at the same level means a potentially large degree of one of these reactions happening and, hence, a strong support or resistance effect on the price.

BTC Price

Bitcoin is inching closer to the first major on-chain support level as it has now dropped to $62,700.

Bitcoin Price Chart

Bitcoin Suffers Massive Drop On BitMEX, Is The Rally Over?

Since Bitcoin (BTC) witnessed a crash this week to $64,000, the crypto asset has not been able to reclaim its momentum, with the price falling even lower. This has led to a general market decline that has affected altcoins.

Bitcoin Plummets To $8,900 On BitMEX Exchange

In a devastating turn of events, Bitcoin witnessed a steep decline on the Seycelles-based cryptocurrency exchange BitMEX on Monday. Reports from blockchain media, Wu Blockchain, revealed that Bitcoin fell to around $8,900, following a massive BTC sell-off on the platform.

Wu Blockchain reported that a user sold over 400 BTC, which led to the price of Bitcoin falling to the aforementioned figure. Over the space of two hours, the unidentified user sold the 400 BTC in groups of 10–50 BTC.

Consequently, BitMEX’s market stability was impacted since the user sold the assets for incredibly low prices. However, according to reports from Blockchain Daily, the event was short-lived as prices have now returned to the normal level.

In response to the development, BitMEX has assured the crypto community that it is “looking into odd behavior” involving users selling substantial orders on the spot market for BTC-USDT.

The crypto platform further stated that while the investigation is ongoing, “the derivatives market will still be operational, including the index price for its popular XBT derivatives contracts.” Furthermore, the exchange confirmed the safety of users’ funds and assets, and the platform is “running as usual.”

Given that the price of Bitcoin was situated at $68,000 before the incident, the drop indicates an over 87% decline. After falling to $8,900, Bitcoin recovered, but the abnormal price fluctuations lasted for an additional 30 minutes before things returned completely to normal.

The development has since stirred quite a frenzy within the cryptocurrency landscape, leaving the community to ponder on the reason behind the drop. Several crypto enthusiasts believe that the incident was a move orchestrated by BitMEX to manipulate prices to liquidate investors and end up making a lot of money.

Larger Crash Might Take Place

As Bitcoin continues to move downward, Gold advocate and crypto critic Peter Schiff has forecasted a larger crash for prices. At first, Peter Schiff drew the crypto community’s attention to the 2021 rally, in which BTC peaked at $69,000.

However, the largest cryptocurrency witnessed a collapse the next year, and by November 2022, it was already trading at $16,000. As a result, Schiff mocked Bitcoin enthusiasts, asking, “How many of them still have their laser eyes on their profiles.”

Thus, considering that the majority are presently more optimistic about BTC, Schiff anticipates a “bigger crash” is probably on the horizon.

As of the time of writing, the price of Bitcoin was trading at $62,943, indicating an over 7% decline in the past 24 hours. Its market cap is down more than 7%, while its trading volume holds steady increasing by 63% in the past day.

Bitcoin

FOMC Preview: Bitcoin and Crypto’s Fate Tied To Fed Rate Move

In the lead-up to the Federal Open Market Committee (FOMC) meeting scheduled for Wednesday, March 20, the Bitcoin and crypto market is experiencing a severe downtrend. BTC price has plunged roughly -10% in the past two days, and Ethereum (ETH) is down -12% in the same period.

The anticipation surrounding the Fed’s stance on interest rates has heightened in the wake of recent economic indicators, including unexpected spikes in the  US Consumer Price Index (CPI) and Producer Price Index (PPI), stirring volatility across markets, including digital assets.

The consensus, with a 99% probability according to the CME FedWatch tool, suggests interest rates will hold steady. Nonetheless, the spotlight turns to the Fed’s dot plot, a graphical representation of the individual members’ expectations for future interest rates, which could provide crucial insights into the monetary policy outlook for the coming months and years.

CME FedWatch Tool

Anna Wong, Chief US Economist for Bloomberg, remarked via X (formerly Twitter), “Another reason why FOMC [is] not ready to cut: members not yet of broad agreement of that need. Here’s visualizing the dispersion of FOMC views with the help of our new weekly NLP Fed spectrometer. “

How Will Bitcoin And Crypto React?

Macro analyst Ted, expressing his perspective on X, underscores the nuanced relationship between macroeconomic trends and the crypto market at the moment. Ted elucidated that spot Bitcoin ETF flows have taken the backseat while macro factors came to the foreground.

He stated via X, “If BTC is to be considered digital gold, it’s expected to mirror gold’s market movements, albeit with a higher degree of volatility. In the current climate, with the market bracing for the Fed’s upcoming meeting, macroeconomic factors momentarily take precedence, driven by recent developments in PPI and CPI figures.”

He further speculates that “Despite the eventual remarks from [Fed Chair] Powell, the market has already adopted a hawkish stance in anticipation of a ‘higher for longer’ interest rate scenario.”

Michaël van de Poppe, a noted figure in the crypto analysis domain, provided his insights on the recent downward price movement of Bitcoin via X, citing a mix of factors including the anticipation of the FOMC meeting and significant capital outflows from Grayscale‘s Bitcoin Trust. Van de Poppe advises, “It’s typically in these pre-FOMC periods, perceived as risk-off intervals, that the savvy investor finds opportunities to ‘buy the dip’.”

In a reflection of market sentiment adjustments, analyst @10delta on X pointed out the strategic positioning of investors in anticipation of the Fed’s rate decisions. “The market is currently pricing in a reversal to the November ’23 interest rate levels, a clear indication that investors are adjusting their expectations based on the Fed’s potential pivot signaled in the previous dot plot,” he noted.

Accordingly, he argues that the FOMC & dot plot will be a “buy the news” event as the market expectations are being properly adjusted. “The macro worries […] should dissipate & crypto idiosyncratic bullish factors, such as the ETF inflows […] as well as the BTC halving take hold. All considered I think there’s a good R/R for ‘buying the dip’ heading into the March 20 event,” the analyst added.

Goldman Sachs Predicts (Only) 3 Rate Cuts This Year

Goldman Sachs Research recently provided a detailed analysis in their March FOMC Preview. The report highlights the nuanced balance the Fed seeks to achieve between controlling inflation and supporting economic growth.

“Our revised forecast now anticipates three rate cuts in 2024, a slight adjustment from our previous prediction, primarily due to a modest uptick in the inflation trajectory,” Goldman Sachs analysts elucidated. They further speculate, “While the immediate focus is on maintaining current rate levels, the trajectory for rate cuts will hinge on inflation dynamics and economic performance indicators.”

Goldman Sachs further predicts that the Fed will still target a first cut in June. “This combined with a default pace of one cut per quarter implies that the most natural outcome for the median dot is to remain unchanged at 3 cuts or 4.625% for 2024,” the banking giant remarked.

As the crypto market and broader financial ecosystems await the outcomes of the FOMC meeting, the prevailing sentiment is one of cautious anticipation. Market participants are closely monitoring the Fed’s commentary for indications of future monetary policy directions via the dot plot.

The question for the Bitcoin and crypto market is whether there will be an unpleasant surprise or whether market participants were right with their “higher for longer” policy assumption.

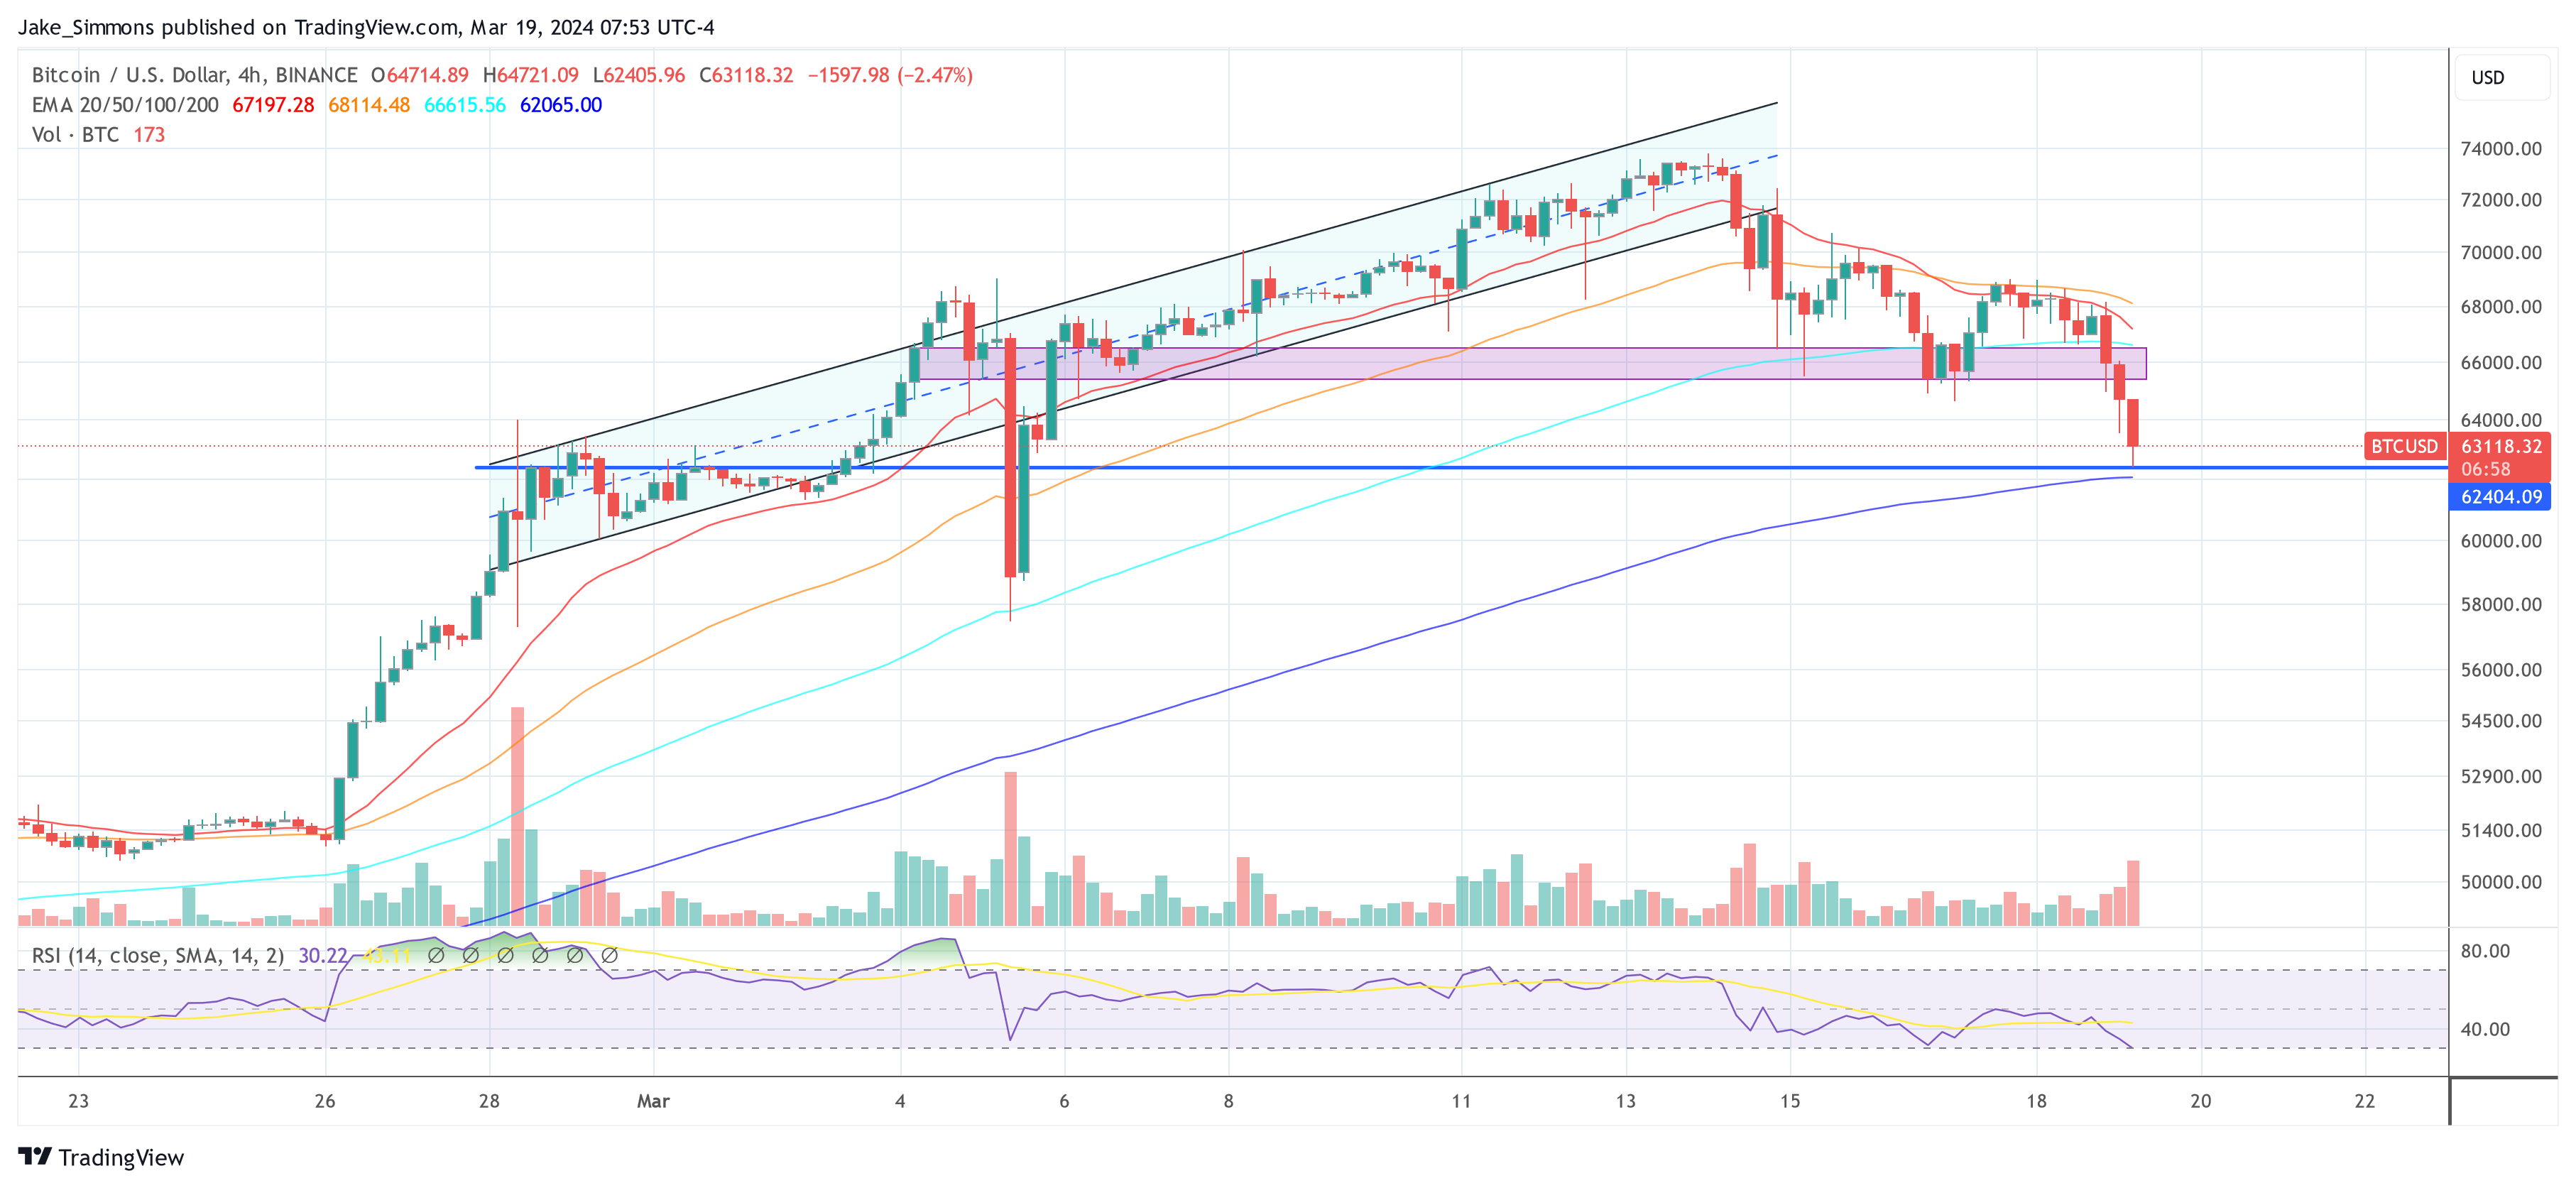
At press time, BTC found support at the $62,400 price level, trading at $63,118.

Bitcoin price

Top Reasons Why The Bitcoin Price Crashed Below $63,000

The flagship cryptocurrency, Bitcoin, dropped below the $63,000 mark in the last 24 hours and is currently on a price correction, having recently hit a new all-time high (ATH) of $73,750. This price dip is believed to be due to several factors, including the Bitcoin Halving, which is fast approaching. 

Bitcoin Price Is In The Second Phase Of The Halving Trend

Crypto trader and analyst Rekt Capital recently provided insights into the four phases of Bitcoin Halving, which provides a plausible explanation for Bitcoin’s recent decline. He suggested that Bitcoin was entering into the ‘Final Pre-Halving Retrace,’ having just concluded with the ‘Pre-Halving Rally.’

This ‘Final Pre-Halving Retrace’ is said to occur 28 to 14 days before the Halving event. However, it looks to have come earlier this time around (just like the Pre-Halving Rally), with the Halving still about 30 days away. Rekt Capital alluded to the Pre-Halving retrace in 2016 and 2020 when Bitcoin pulled back by 38% and 20%, respectively. 

Bitcoin has already pulled back over 11% in the past week. Interestingly, the analyst noted that this phase of the Halving can last “multiple weeks and up to 77 days.” Rekt Capital, however, expects it to be much shorter than historical ones. He added that this year’s Pre-Halving Retrace “would more likely be on the shallower side than on the deeper side.”

Long-Term Bitcoin Holders Are Taking Profit

Alex Thorn, Head of Research at Galaxy Digital, highlighted in an X (formerly Twitter) post that long-term Bitcoin holders are starting to sell. This is evidenced by different metrics, such as the movement in coins that had stagnated for over a year. 

Crypto analyst Ali Martinez previously alluded to this wave of profit-taking, noting data from market intelligence platform Glassnode, which showed that those holding over 1,000 BTC were increasingly cashing out. This has also led to a 4.83% drop in this category of BTC addresses this past few weeks. 

Thorn, however, sounded optimistic about Bitcoin’s future trajectory in his post, noting that new whales are entering (through the Spot Bitcoin ETF market) as some others are exiting. He also suggested that some of these whales aren’t exactly leaving the market but selling their spot BTC and investing in Bitcoin ETFs instead. 

Bitcoin Sentiment Is Currently Bearish

Data from Coinglass shows that the bears currently have the upper hand, with almost $82 million in long positions liquidated in the last 24 hours compared to just about $23 million of shorts liquidated during the same period. 

There has also been a decrease in open interest on these exchanges, which suggests that traders are choosing to stay out of the market at the moment. Therefore, activity in the derivatives market shows that the current outlook for Bitcoin is bearish, with many still expecting further declines. 

At the time of writing, Bitcoin is trading at around $63,000, down over 4% in the last 24 hours according to data from CoinMarketCap. 

Bitcoin price chart from Tradingview.com

Japan’s $1.5 Trillion Pension Fund To Assess Bitcoin For Diversification

The Government Pension Investment Fund (GPIF) of Japan, the world’s largest pension fund with assets totaling $1.5 trillion, has officially announced its initiative to explore diversification opportunities that include Bitcoin, alongside traditional investments such as gold and more unconventional assets like forests and farmland. This exploration marks a monumental potential pivot in the investment strategy of a fund traditionally associated with more conservative asset classes.

Japan GPIF Seeks Information On Bitcoin

According to a Bloomberg report dated March 19, 2024, GPIF is in the initial phase of this exploration, focusing on an information request stage rather than signaling an imminent expansion of its investment portfolio. The fund currently diversifies its holdings across a vast array of assets, including domestic and international stocks and bonds, infrastructure, and real estate. With assets under management valued at approximately 225 trillion yen as of the end of December 2023, the GPIF’s interest in Bitcoin and other illiquid assets underscores a notable shift towards broadening its investment aperture.

The GPIF stated, “In addition to basic knowledge about the assets targeted for information provision, we are also seeking information on how overseas pension funds incorporate them into their portfolios and actual investment cases.” This reflects a methodical approach to understanding the potential benefits and risks associated with diversifying into less traditional and more volatile asset classes like Bitcoin.

Recent years have seen the GPIF actively seeking to enhance the sophistication and diversity of its portfolio. “Since the fall of 2022, a total of 56 active funds have been selected in North American, developed country, and Japanese stocks,” the GPIF noted, highlighting its ongoing efforts to refine its investment strategies. The inclusion of Bitcoin and other non-traditional assets would represent a further step in these diversification efforts.

However, the GPIF has cautiously noted, “This announcement is a request for information and does not indicate that the company will expand its investment targets in the future.” This statement clarifies that any decision to incorporate Bitcoin or other proposed assets into its investment strategy will depend on the outcomes of its current research phase.

This move by the GPIF comes amid broader regulatory changes in Japan regarding Bitcoin and crypto investments. Just one month prior to this announcement, Japan’s administration, led by Prime Minister Fumio Kishida, moved to enable investment funds to hold Bitcoin and other cryptocurrencies directly. “The bill states that ‘measures will be taken to add crypto assets to the list of assets that can be acquired and held by investment limited partnerships,’” according to a statement from the Ministry of Economy, Trade, and Industry.

The GPIF’s exploration of Bitcoin and alternative assets not only underscores the growing institutional interest in Bitcoin, but is also in line with Japan’s regulatory advances aimed at integrating digital assets into the country’s economic framework. The potential inclusion of Bitcoin in the world’s largest pension fund would be huge news and could have implications for other countries and their investment strategies.

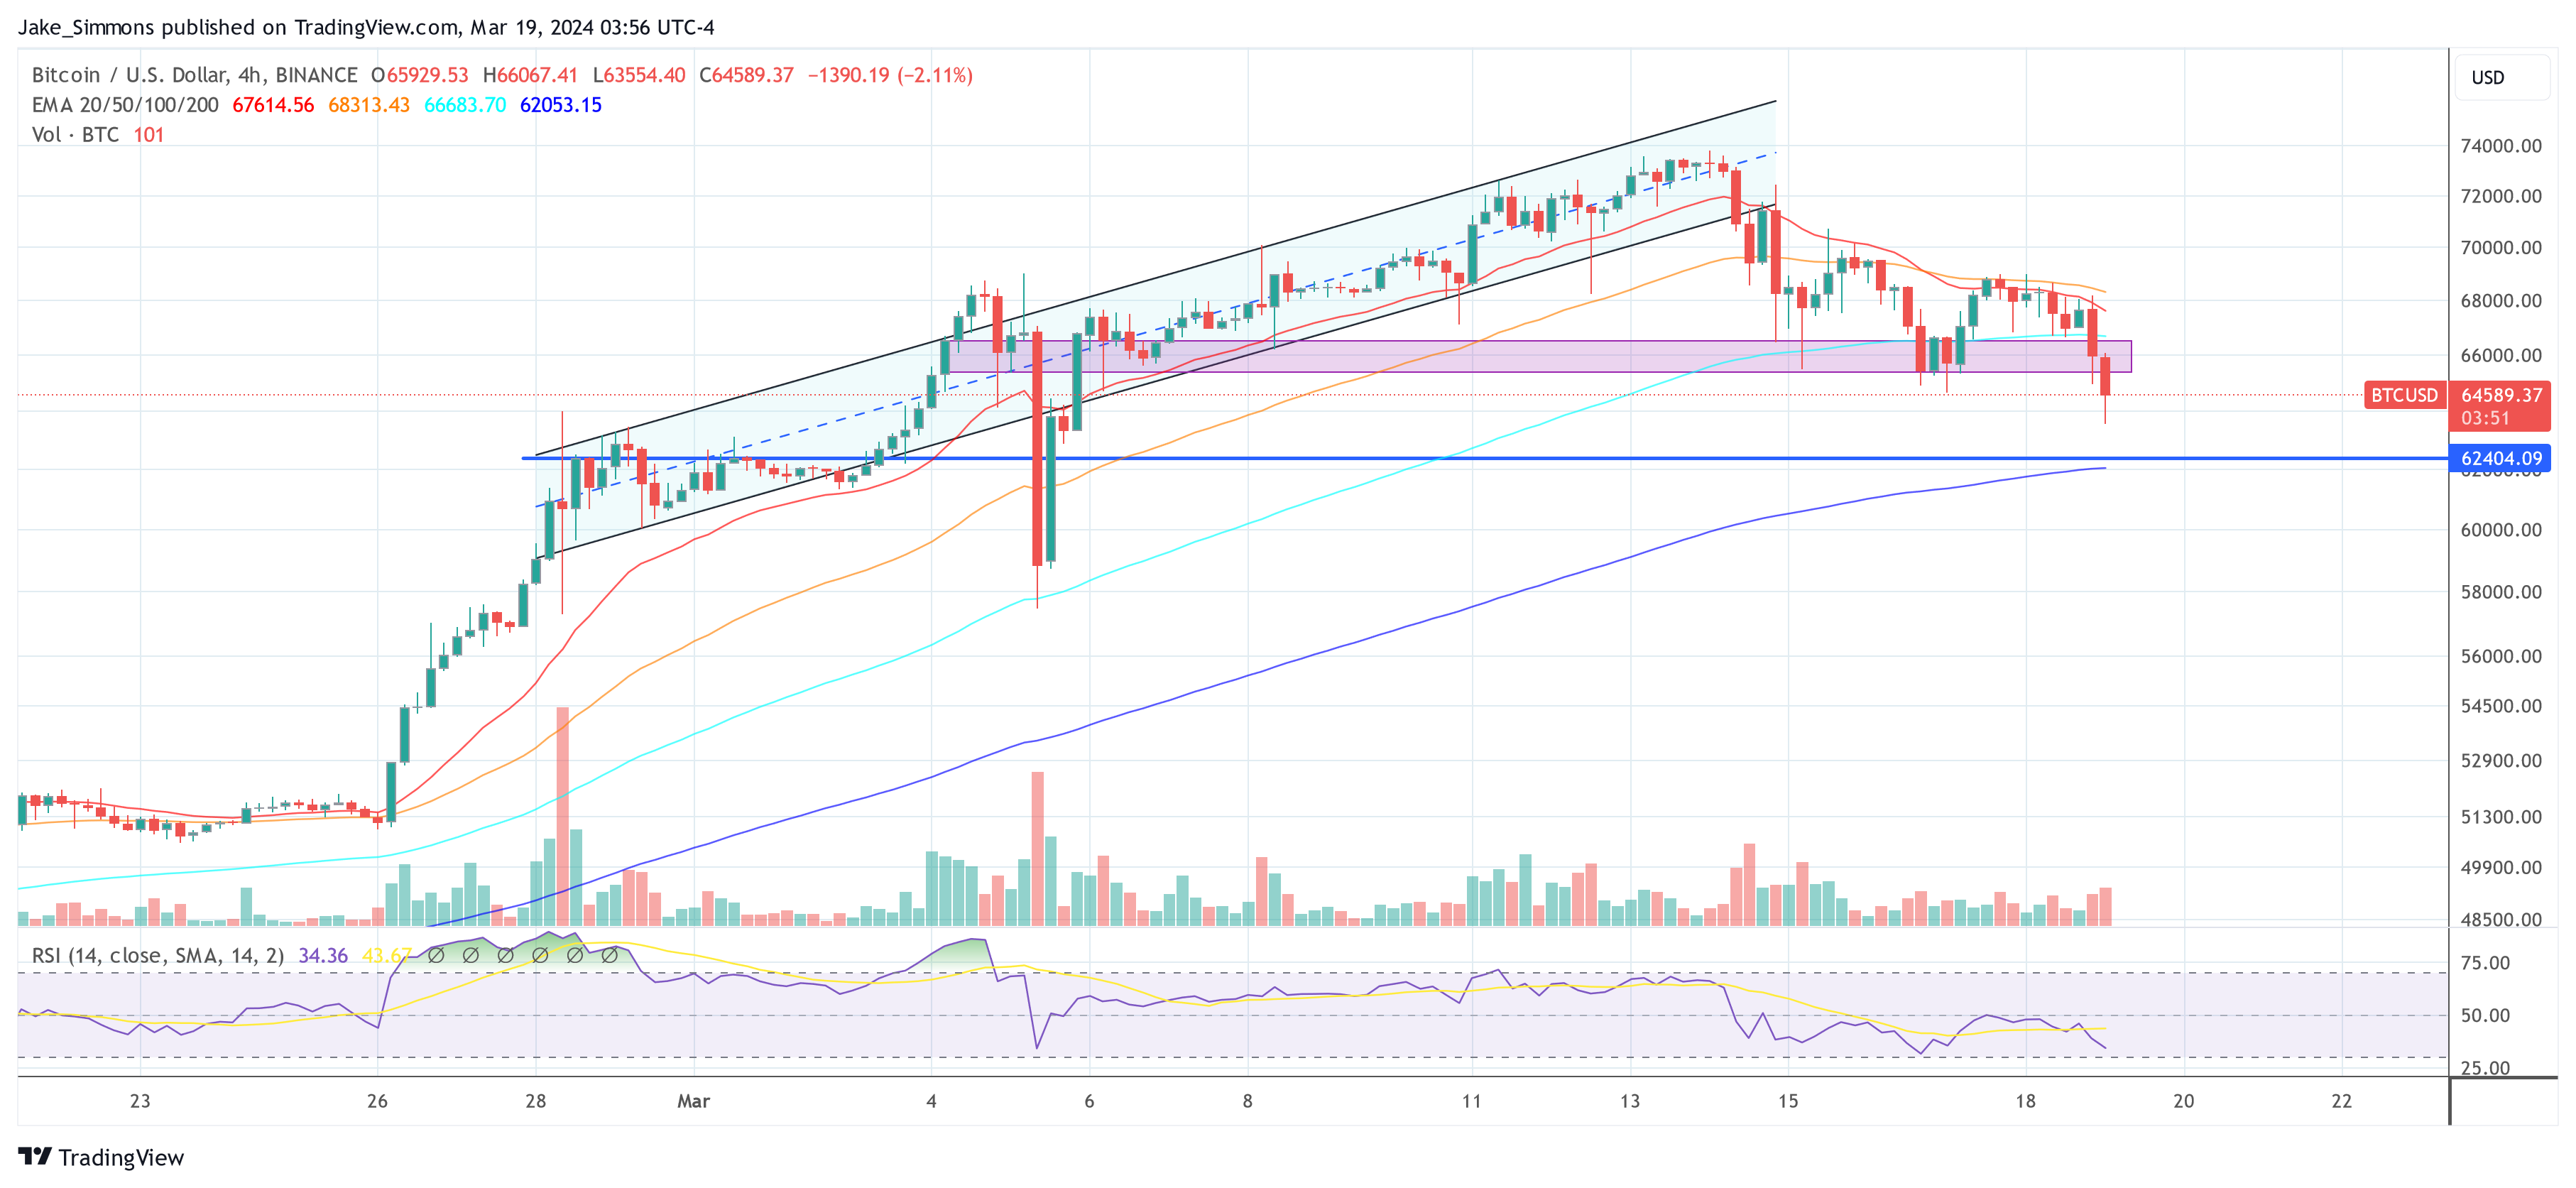
At press time, BTC traded at $64,589.

Bitcoin price

PlanB’s Bitcoin Forecast: A Journey To $5 Million Per BTC In The Next Decade

PlanB, a popular name within the Bitcoin community, thanks to his Stock-to-Flow (S2F) model, has shared the latest discourse on X, igniting a flurry of excitement and speculation. This discourse particularly highlights BTC’s potential journey through successive halving cycles.

PlanB’s analysis, deeply rooted in the S2F model, presents a narrative for Bitcoin’s future. This model scrutinizes the correlation between an asset’s existing reserves (stock) and annual production (flow) and lays the groundwork for PlanB’s bold predictions.

Navigating Through Predictions: A Community Aweigh

According to the model, the forthcoming halving cycle spanning 2020-2024 is expected to solidify Bitcoin’s price at around $50,000. But the real spectacle unfolds in the ensuing cycles, with projections setting the stage for Bitcoin to ascend to $500,000 in the 2024-2028 cycle, eventually reaching a monumental $5 million in the 2028-2032 cycle.

The predictions made by PlanB have sparked interest and debate among the crypto community. Many are curious to see if Bitcoin will experience the forecasted substantial growth.

An X user responded to PlanB’s post, expressing hopefulness yet advising caution due to the limited number of data points that can’t definitively predict precise future prices, like an average of $500k from 2024 to 2028.

PlanB acknowledged this caution, pointing out that his predictions are based on three past halving events and the significant pre-halving period, suggesting that while the Stock-to-Flow model can guide the general trend, its accuracy comes with a considerable margin of error.

For instance, while the 2020-2024 period was projected to see an average of $55k, the actual figure was around $33k.

Additionally, another user in the conversation, known as Phoenix of Crypto, remarked that while PlanB’s projection might seem “overly optimistic,” the true outcome remains to be seen, emphasizing the need for patience.

This user highlighted the uncertainty surrounding Bitcoin’s future, especially considering the potential impacts of ETFs and widespread adoption, signaling an open-minded but watchful approach to market developments.

Bitcoin Latest Price Action

Bitcoin is undergoing a notable decline, having decreased by 7.5% over the last week. This downward trajectory has extended into the last 24 hours, with the cryptocurrency dropping an additional 1.5%. Despite these setbacks, Bitcoin’s trading price remains at $67,167 at the time of writing.

Bitcoin (BTC) price chart on TradingView

Skew, a renowned trader, has provided technical analysis indicating a critical support range for Bitcoin investors between $60,000 and $67,000.

This range is seen as a possible pivot point for the market’s direction, concurrently noting the substantial selling activity on leading platforms such as Coinbase and Binance.

Featured image from Unsplash, Chart from TradingView