Bitcoin is preparing for a supersonic bull run towards $70,000 in April.
So believes Nick Spanos, co-founder of Zap.org — a decentralized oracle data feed startup. In an email interview, the market analyst said that he sees the bitcoin price higher due to two very supportive developments in the cryptocurrency market.
First, Mr. Spanos noted, the much-publicized direct listing of Coinbase Global Inc. shares on the Nasdaq Stock Market would propel the bitcoin prices upward. The Coinbase stock (Ticker: COIN) would serve as a gateway to more conservative investors to embrace the cryptocurrency and other digital assets.
“The upcoming public debut of Coinbase is particularly exciting to mainstream market investors,” Mr. Spanos told NewsBTC. “They will have a more direct opportunity to buy the shares of a company that plays a central role in Bitcoin and crypto space.”
ETF-ETF
Last, the analyst noted a recent spike in the number of companies seeking a bitcoin-enabled exchange-traded fund approval from the US Securities and Exchange Commission. The agency so far has denied every crypto ETF proposal that came to its table, citing concerns related to regulatory uncertainty and price manipulation.
Nevertheless, many believe that the US might see its first Bitcoin ETF, especially after Gary Gensler’s nomination for the SEC’s chairman position. Mr. Gensler taught courses on cryptocurrencies and appear to be softer on the sector, on the whole, than his predecessor Jay Clayton. Mr. Clayton is notorious for dragging many initial coin offering projects under the SEC’s controversial securities law, including Ripple Labs’ XRP token.
Matt Hougan, the chief investment officer of Bitwise Asset Management, which has sought to launch a Bitcoin ETF, believes the new derivative class could bring a lot more capital into the cryptocurrency market. North America’s first Bitcoin ETF in Canada has already amassed more than $1 billion in assets since its launch in February.
Mr. Spanos built his bullish narrative on a similar narrative, stating that the increasing count of companies seeking an ETF could Bitcoin to a new high of $70,000 by the end of April.
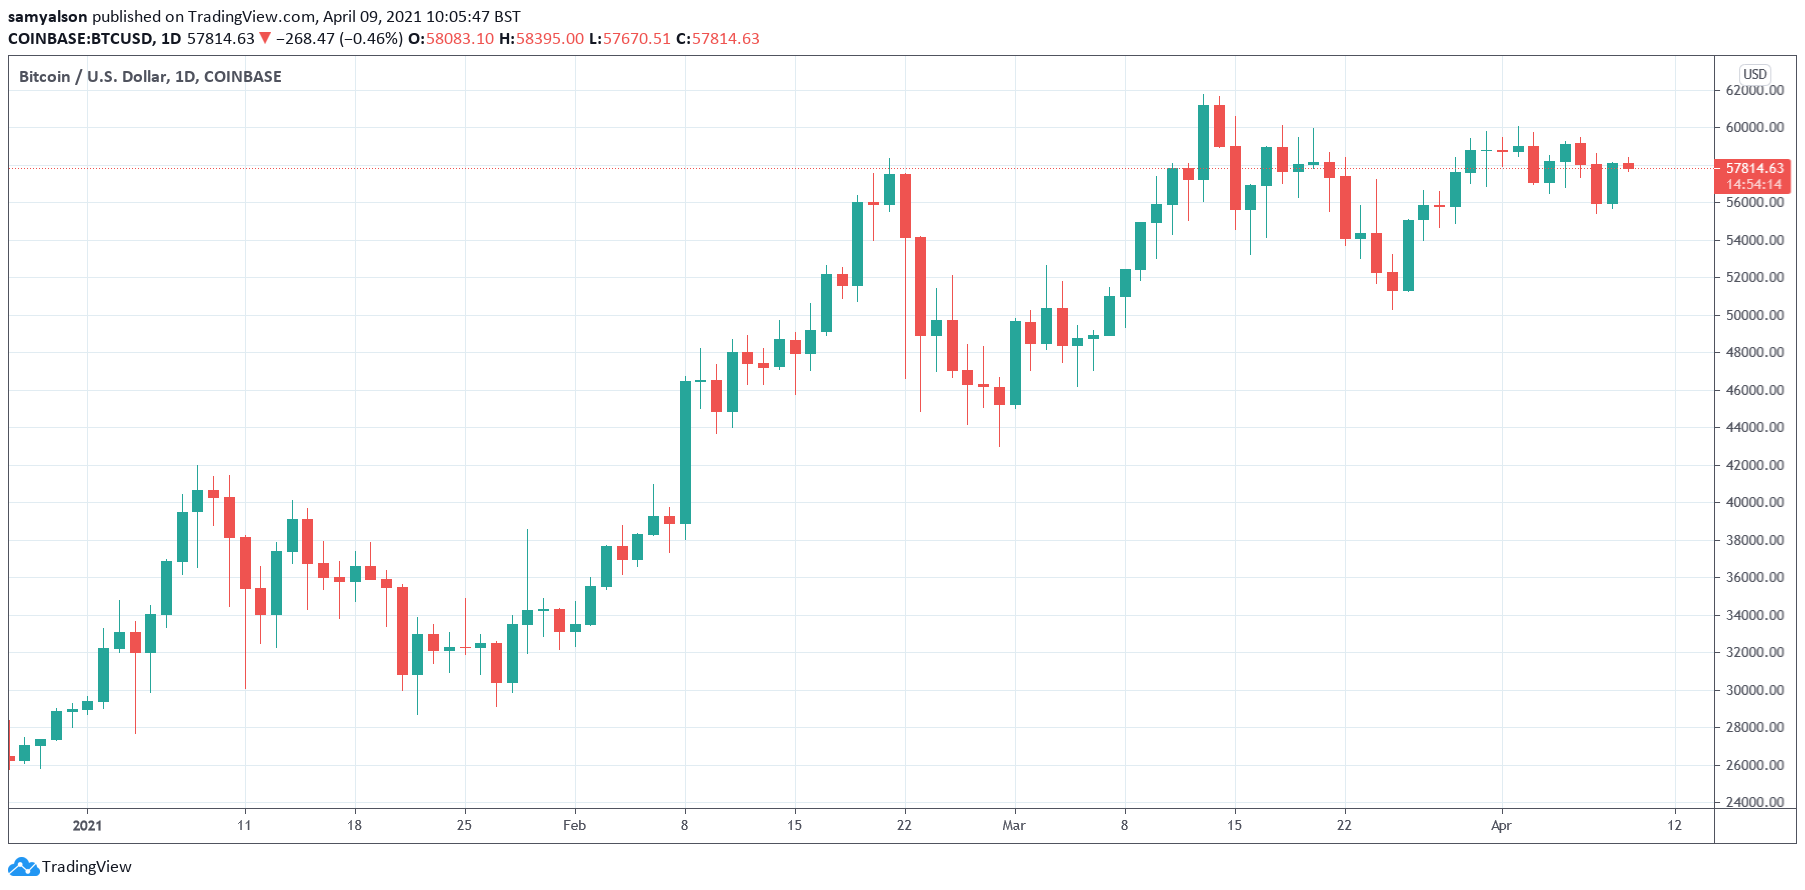
Bitcoin Technical Outlook
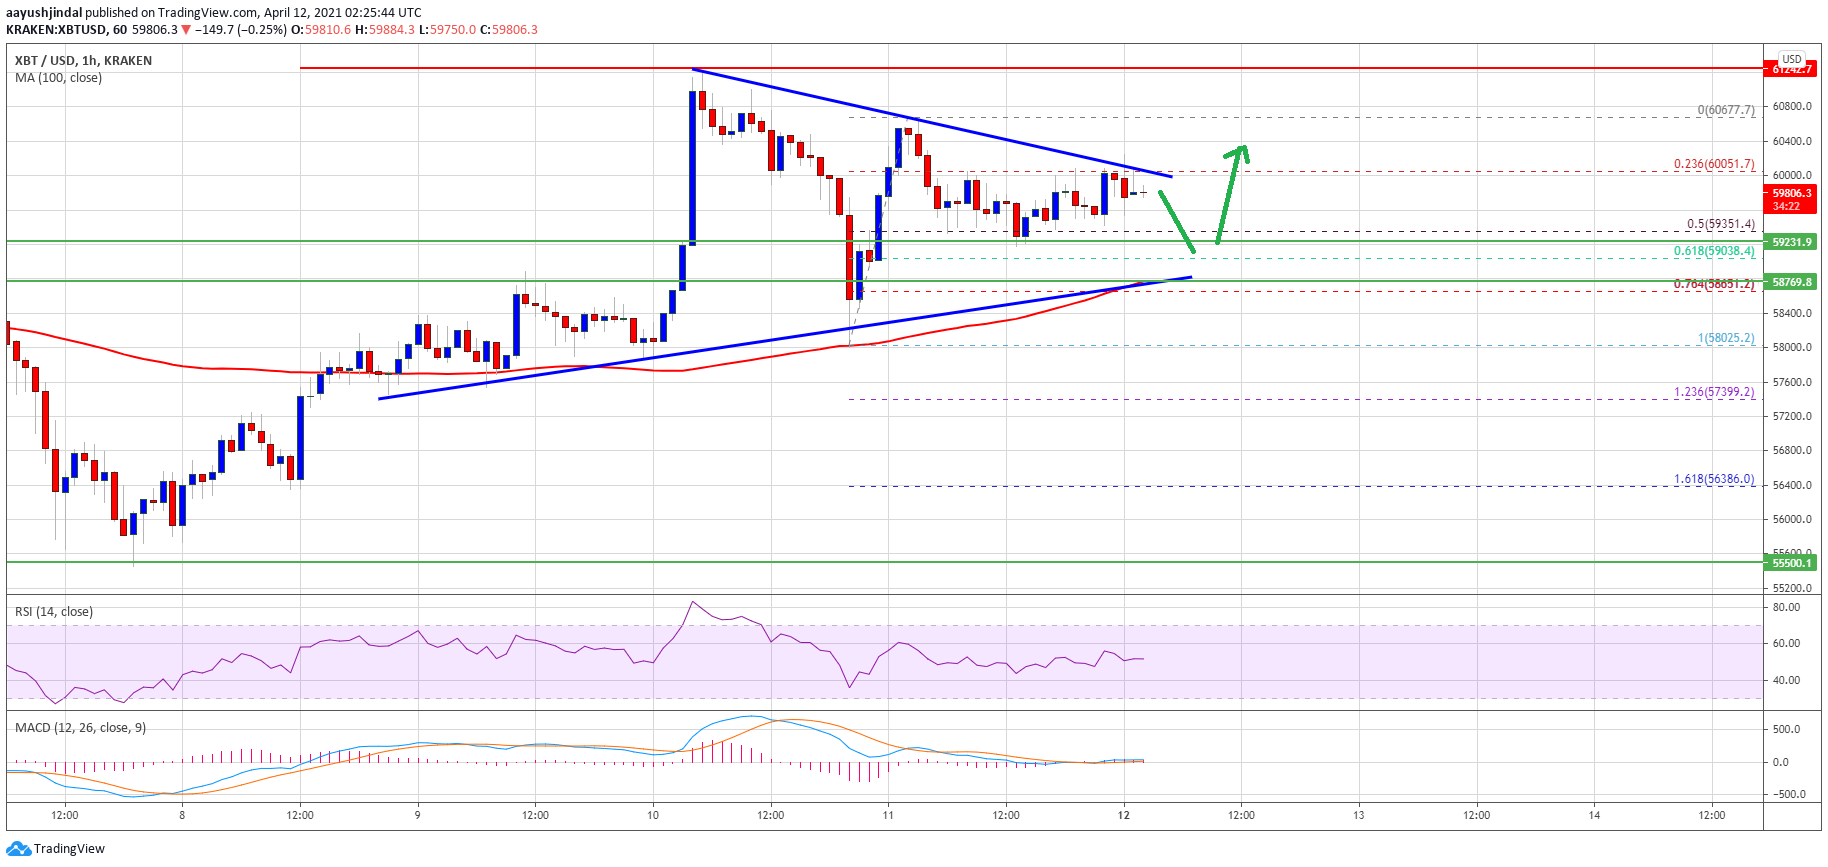
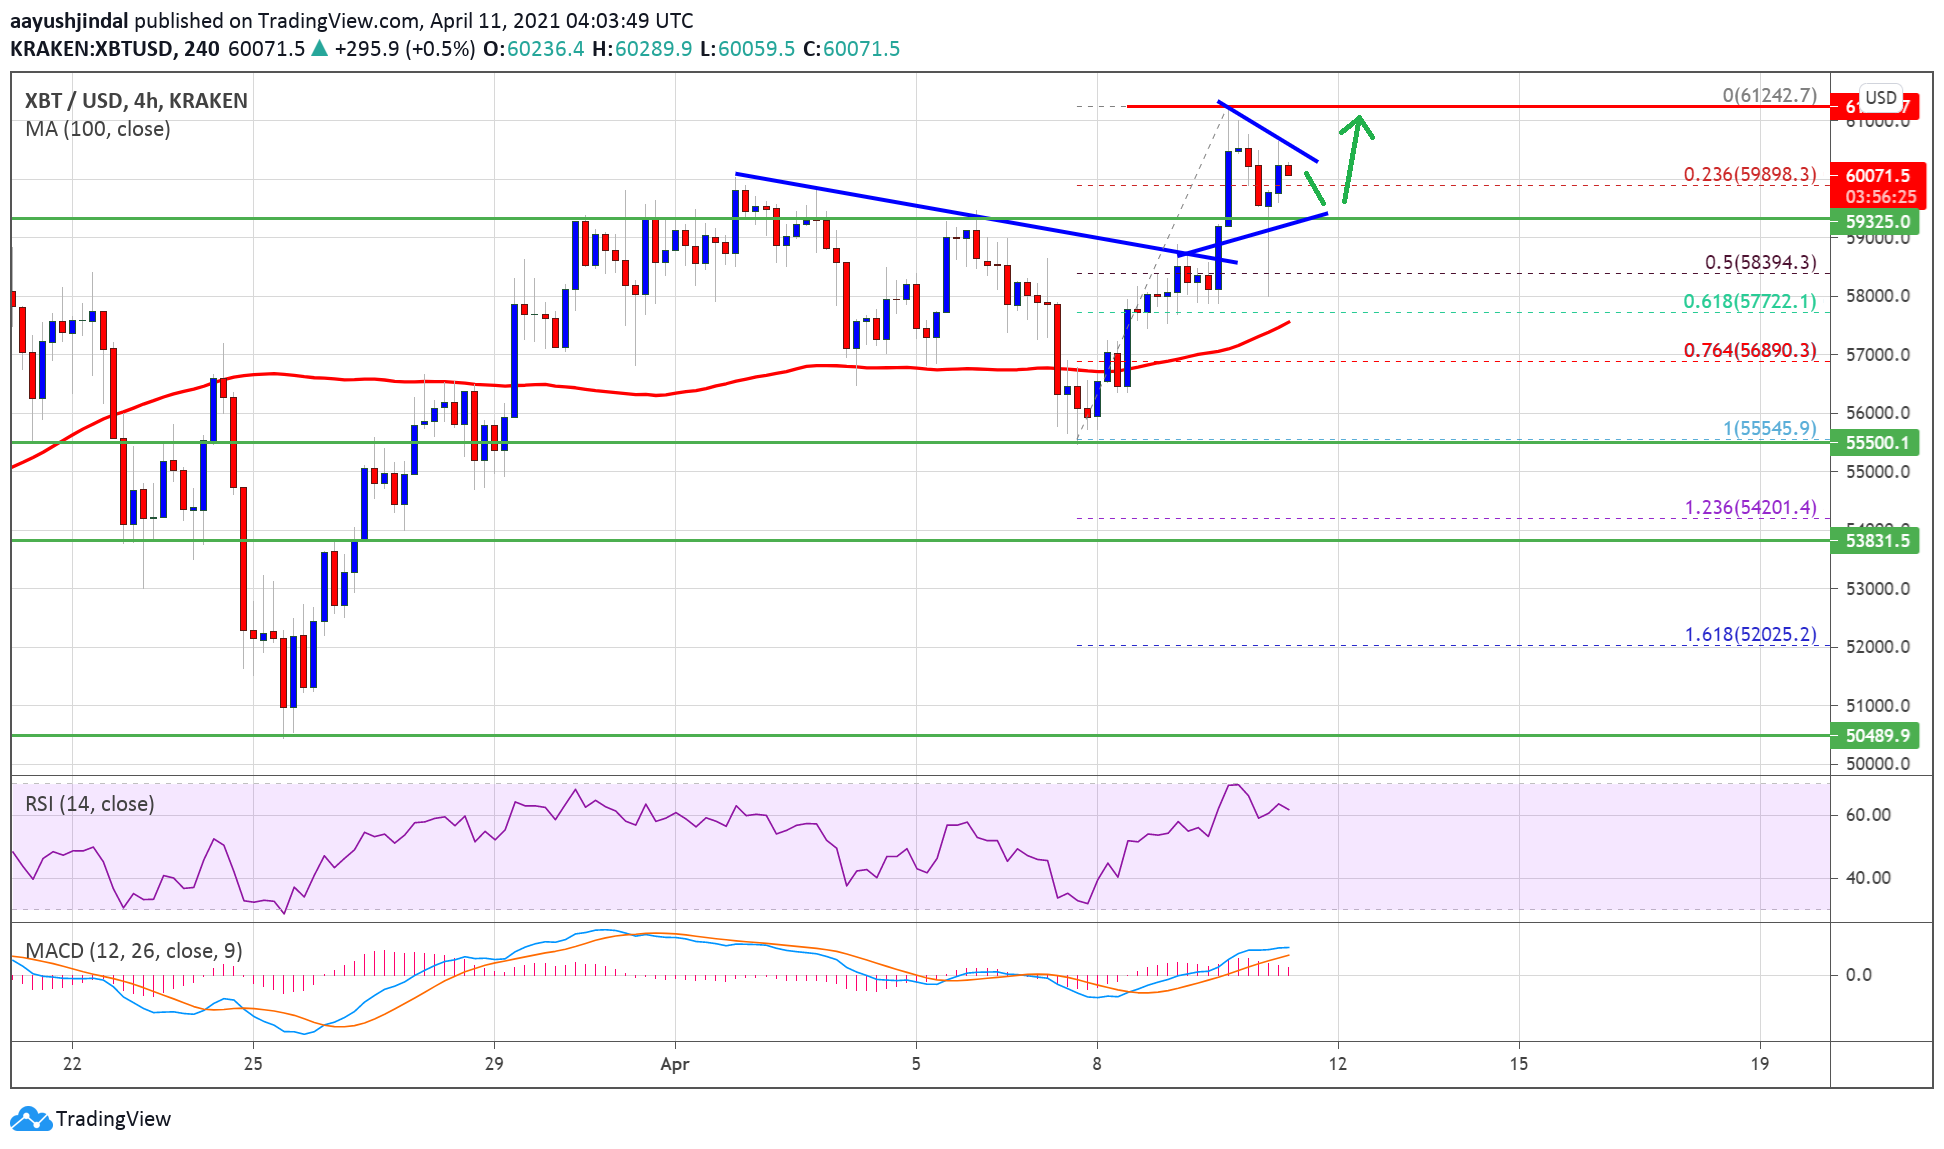
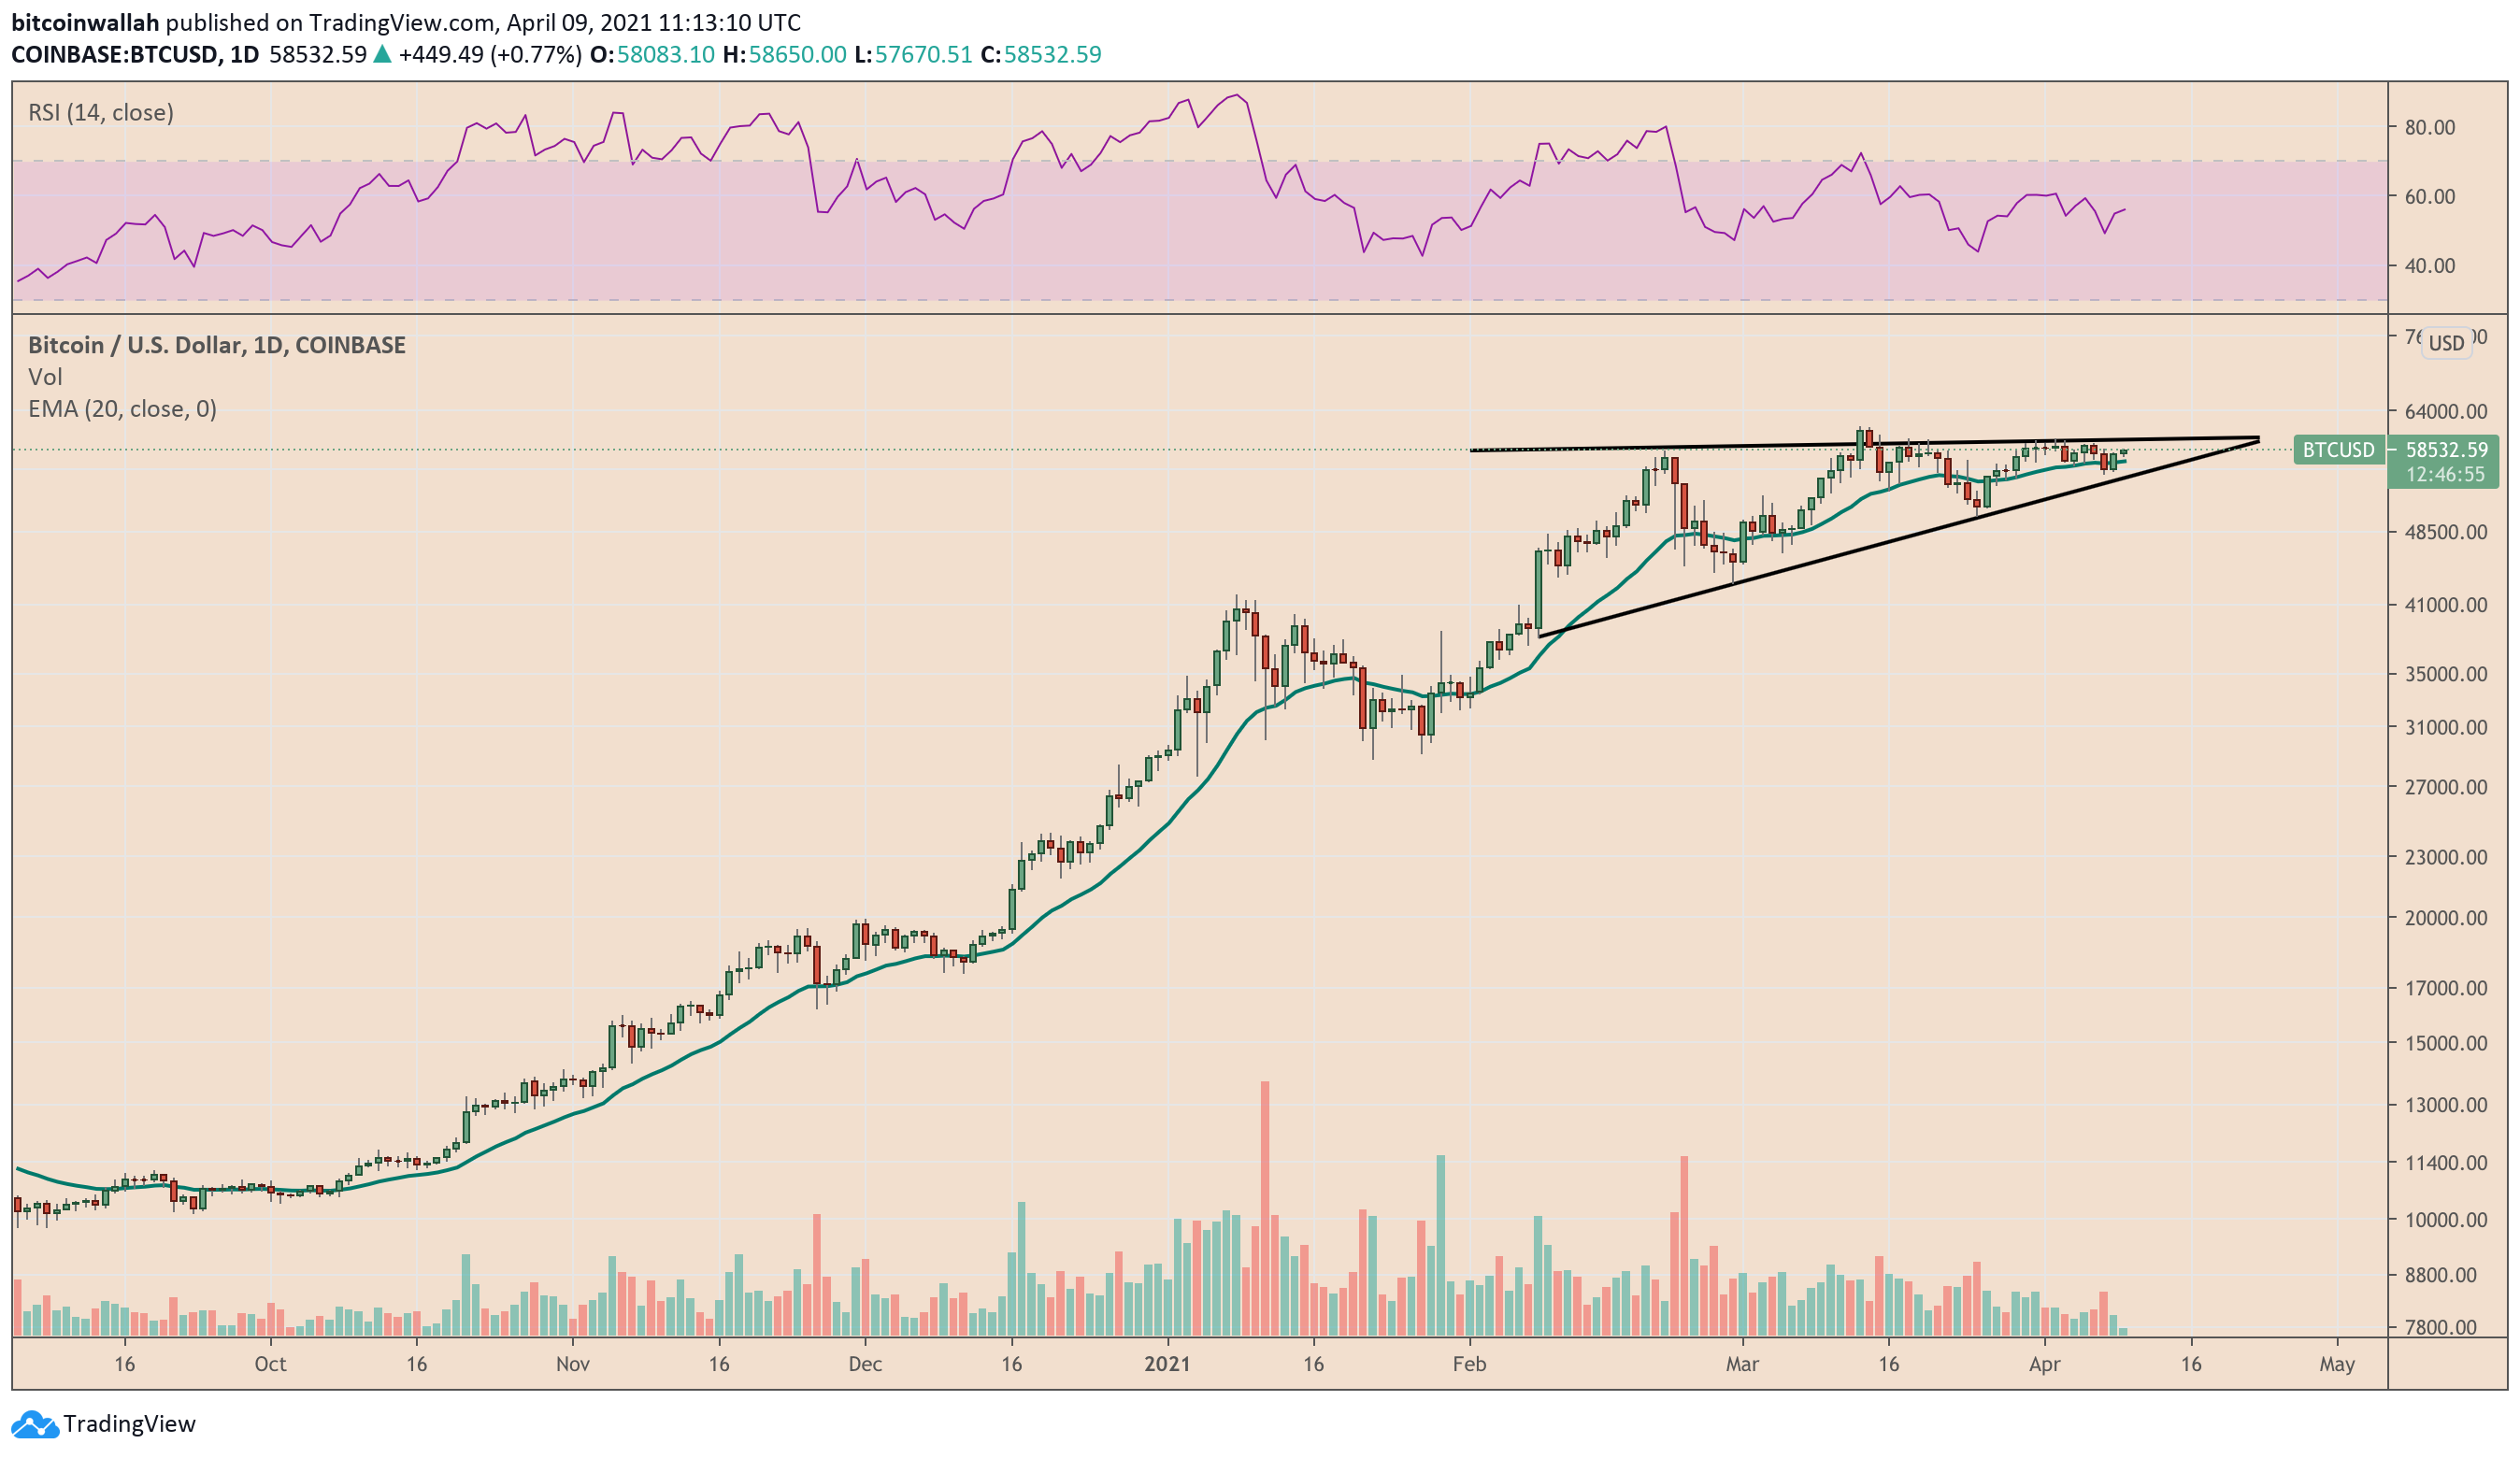
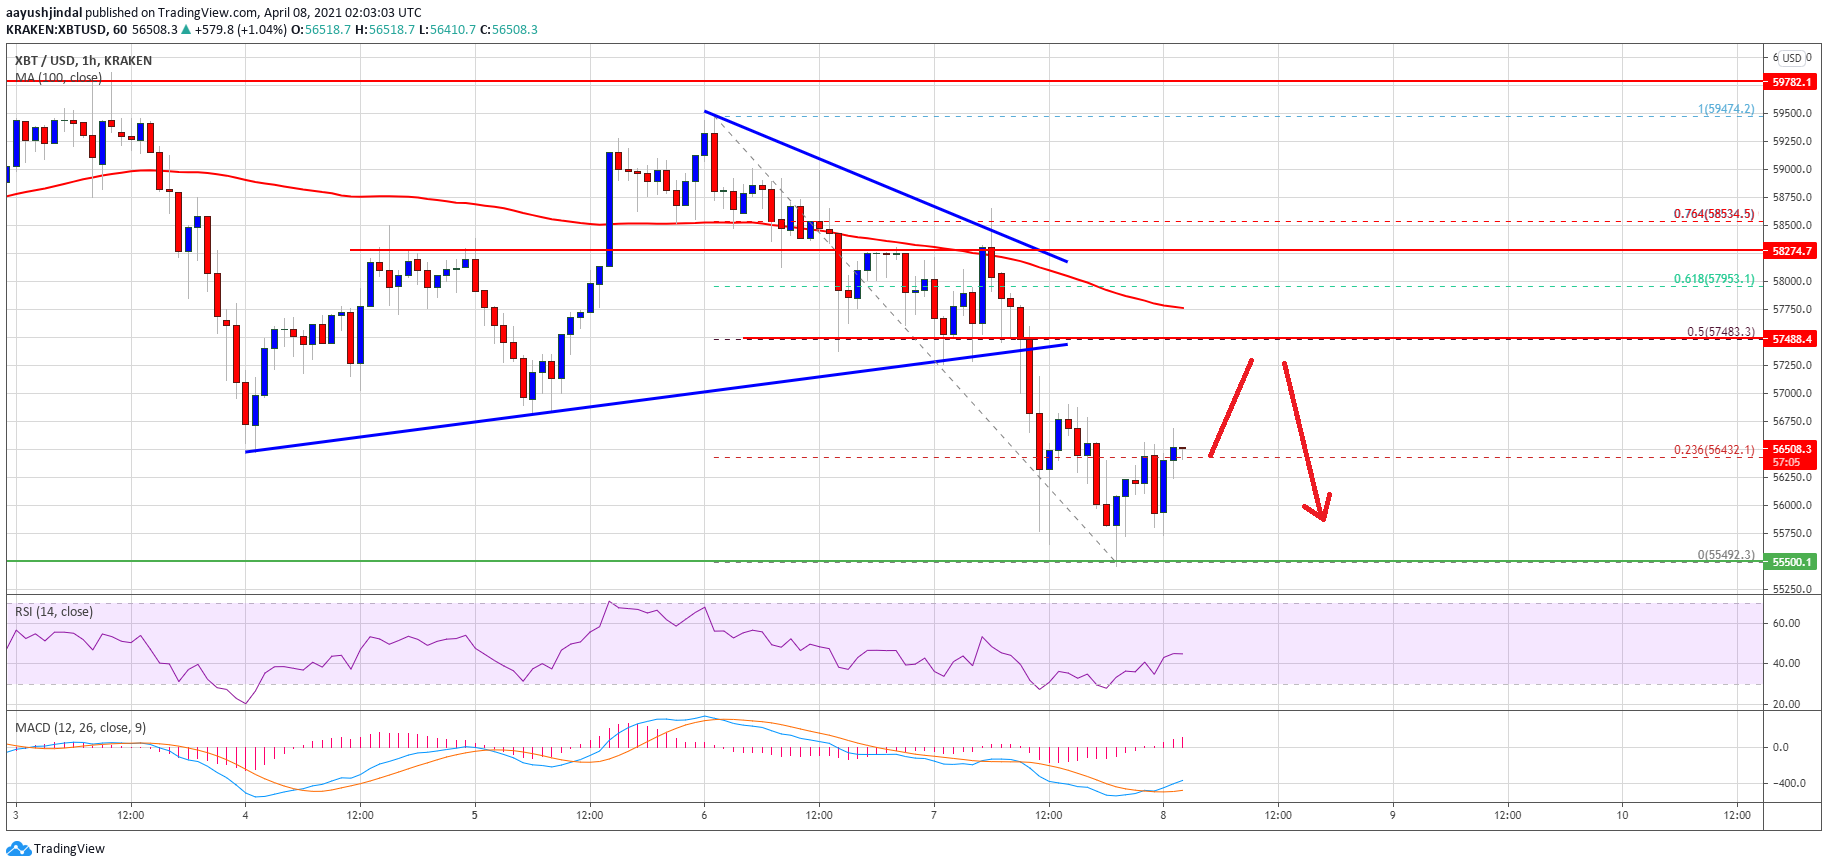
Technical indicators also point to a sustained rally towards $70,000 or beyond. One of them is Ascending Triangle, a bullish continuation pattern that is now in the process of logging a breakout move to the upside. The chart below shows the triangle.

Anticipations are high about a breakout move above the Triangle’s upper trendline that would at least send the price to $70,000. Its overall upside target remains at $80,000, equal to the maximum distance between Triangle’s upper and lower trendline.
Photo by Waldemar Brandt on Unsplash