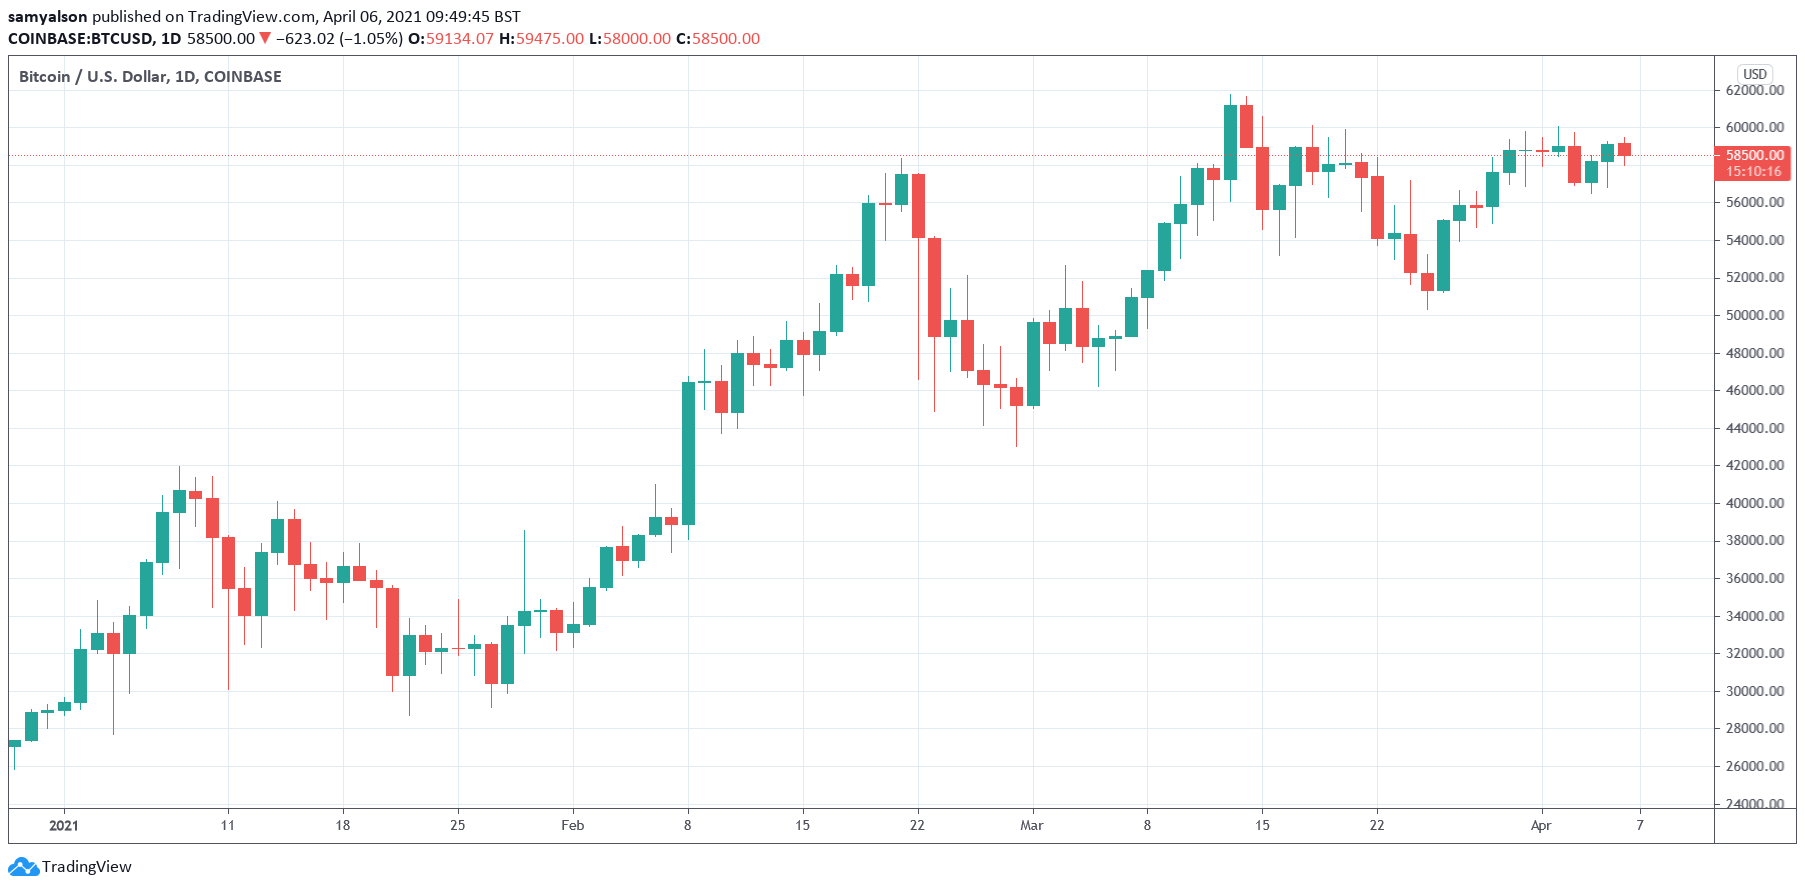
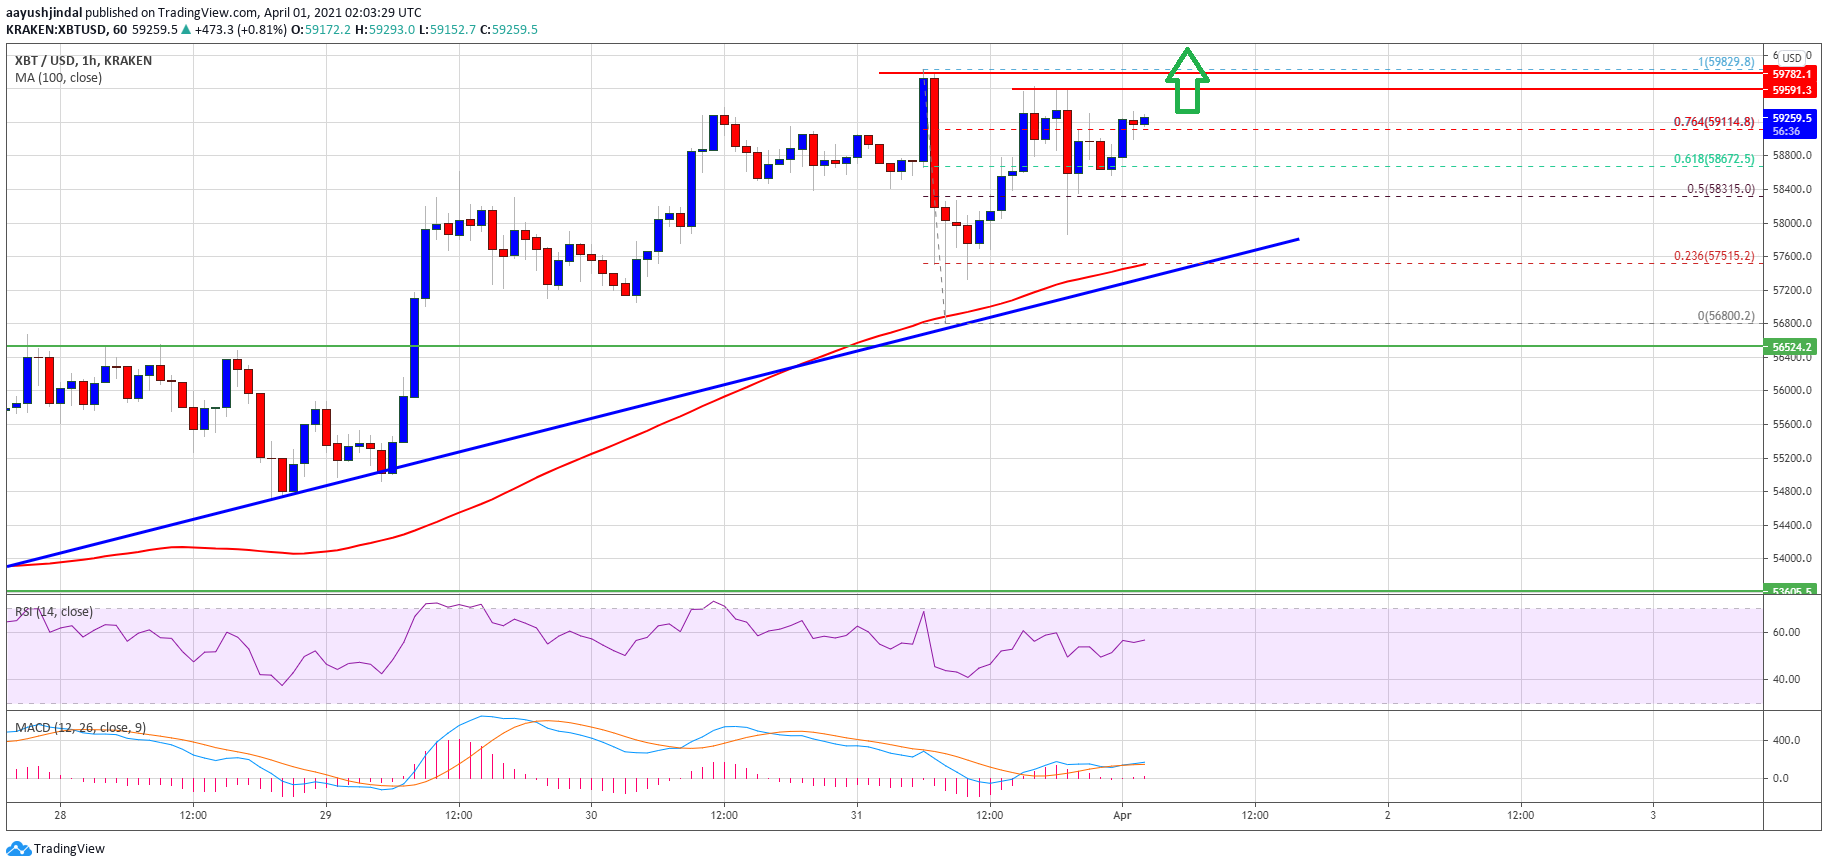
Bitcoin price failed to surpass the $59,500 resistance against the US Dollar. BTC is now trading below $58,000, but it is still above important supports such as $56,500.
- Bitcoin failed to gain strength above the $59,200 and $59,500 resistance levels.
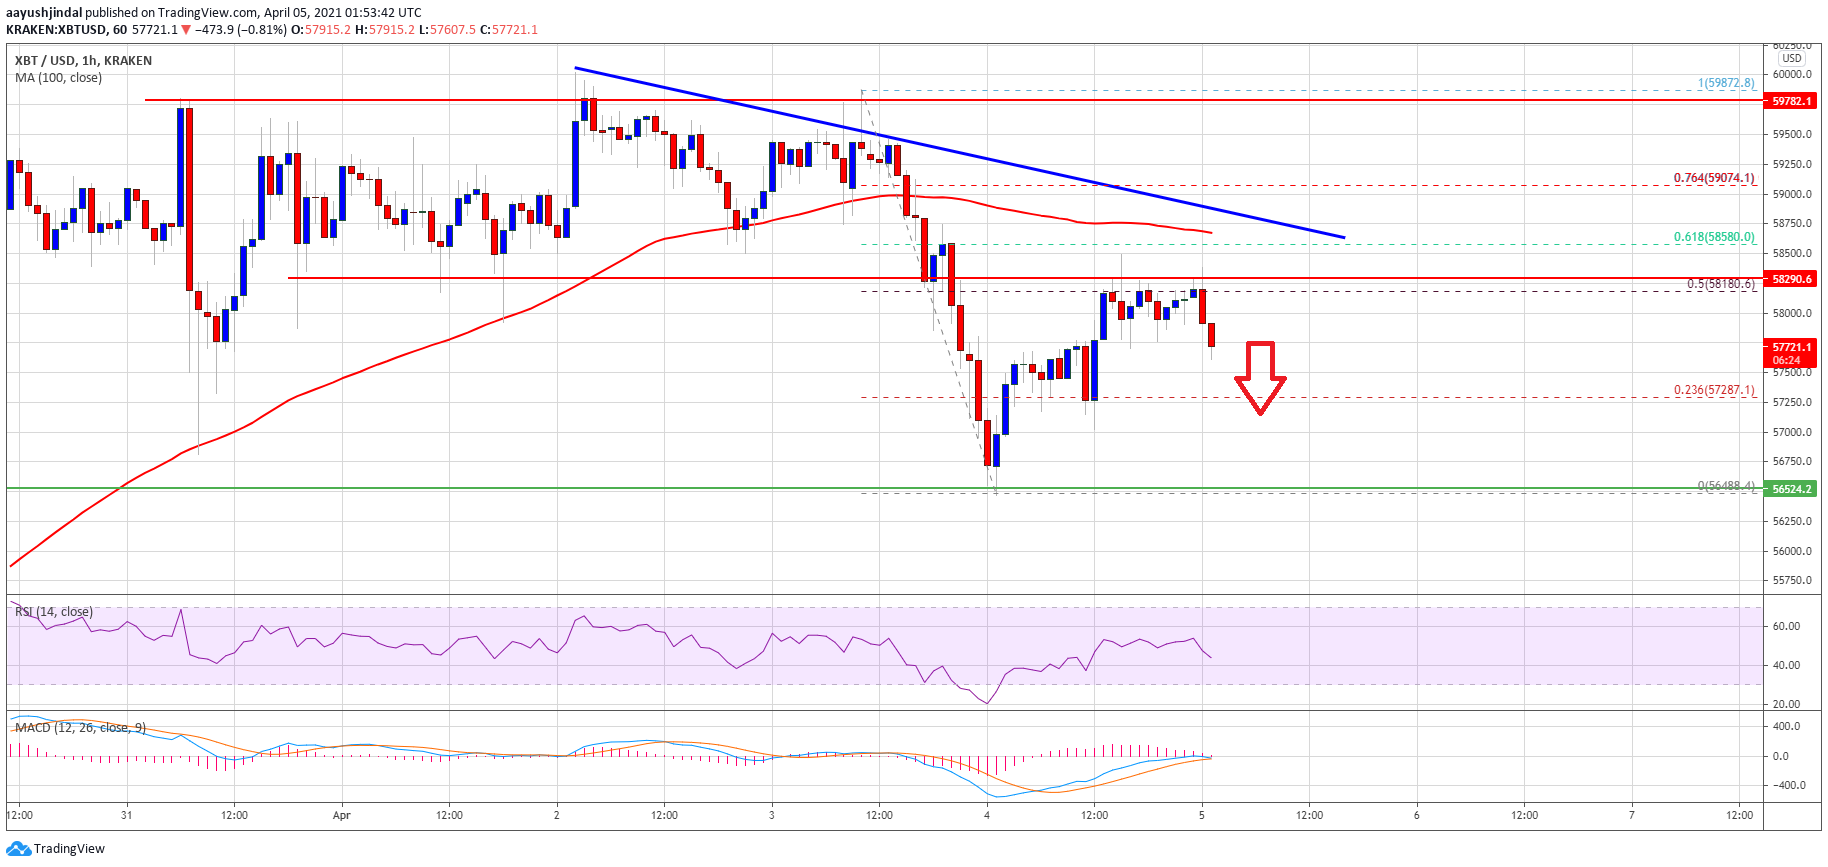
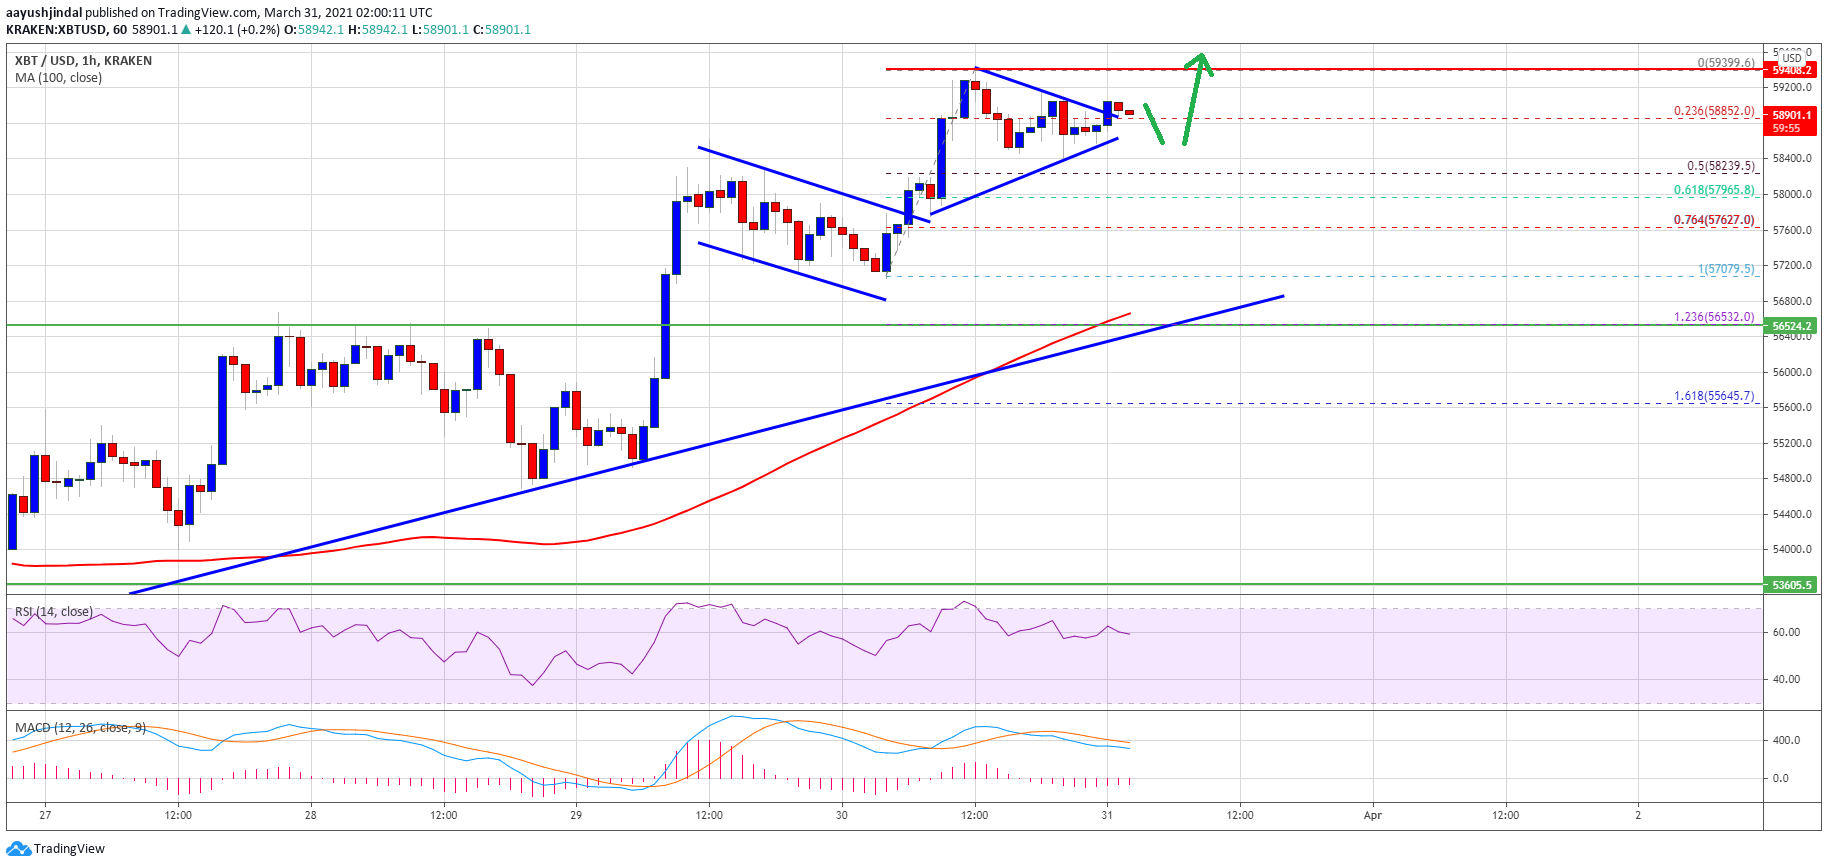
- The price is now trading below the $58,250 support and the 100 hourly simple moving average.
- There is a major contracting triangle forming with support near $57,400 on the hourly chart of the BTC/USD pair (data feed from Kraken).
- The pair is likely to start a fresh increase as long as there is no close below $56,500.
Bitcoin Price Corrects Lower
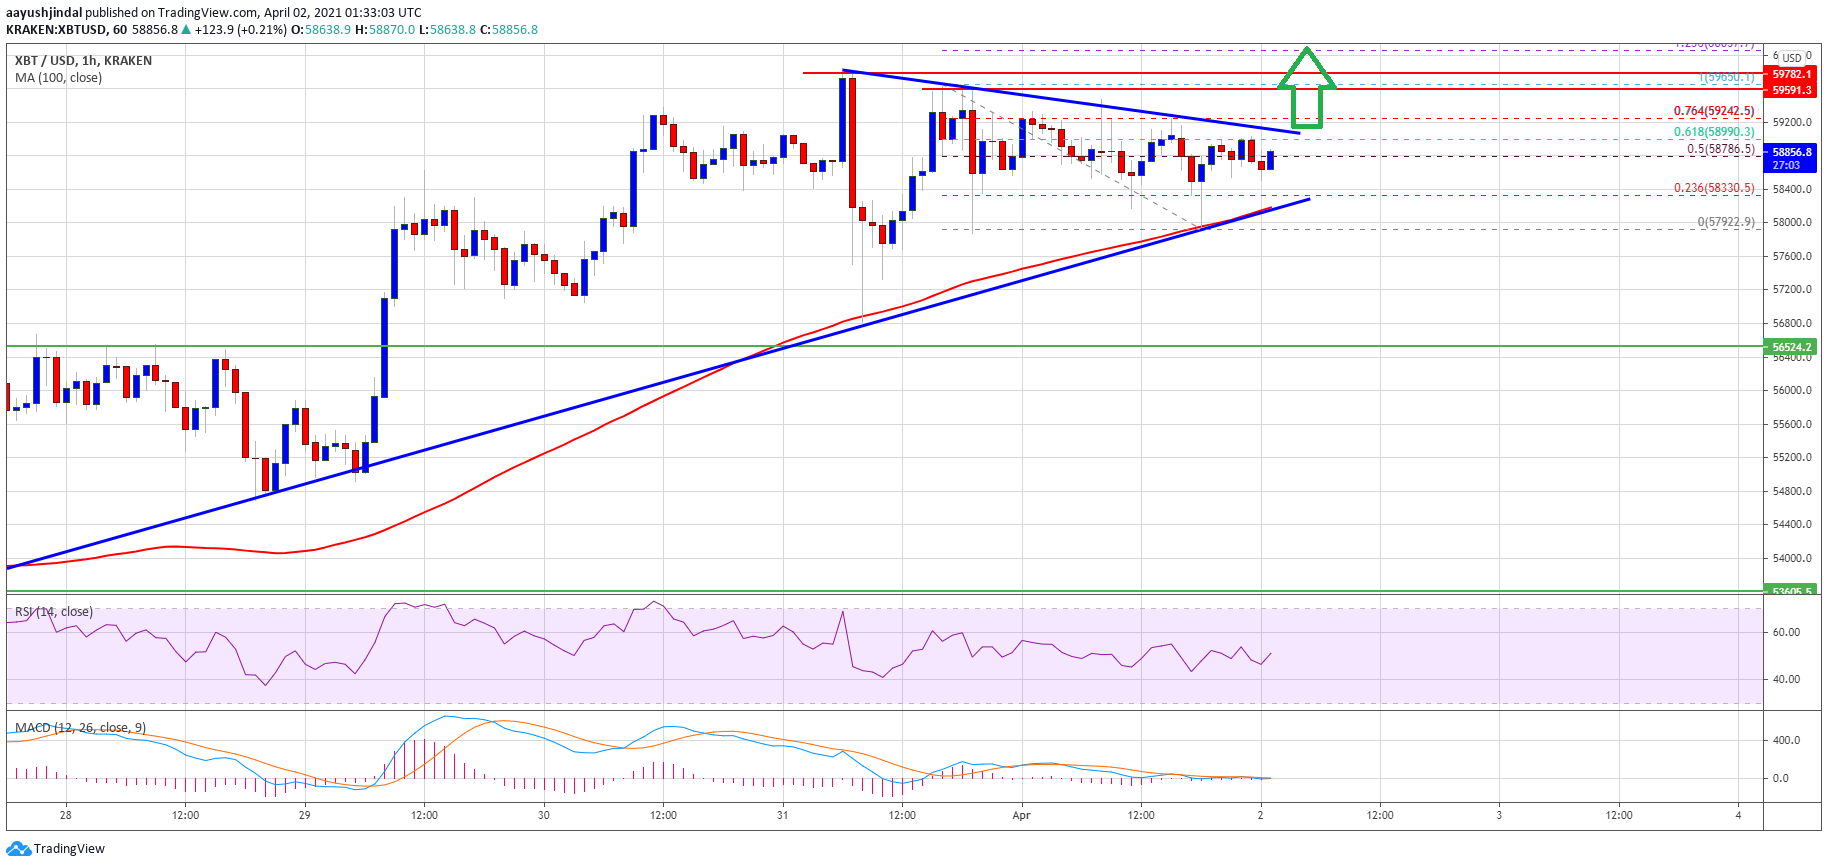
Bitcoin climbed above the $59,000 level, but it failed to gain strength above the $59,200 and $59,500 resistance levels. BTC traded as high as $59,475 and recently started a downside correction.
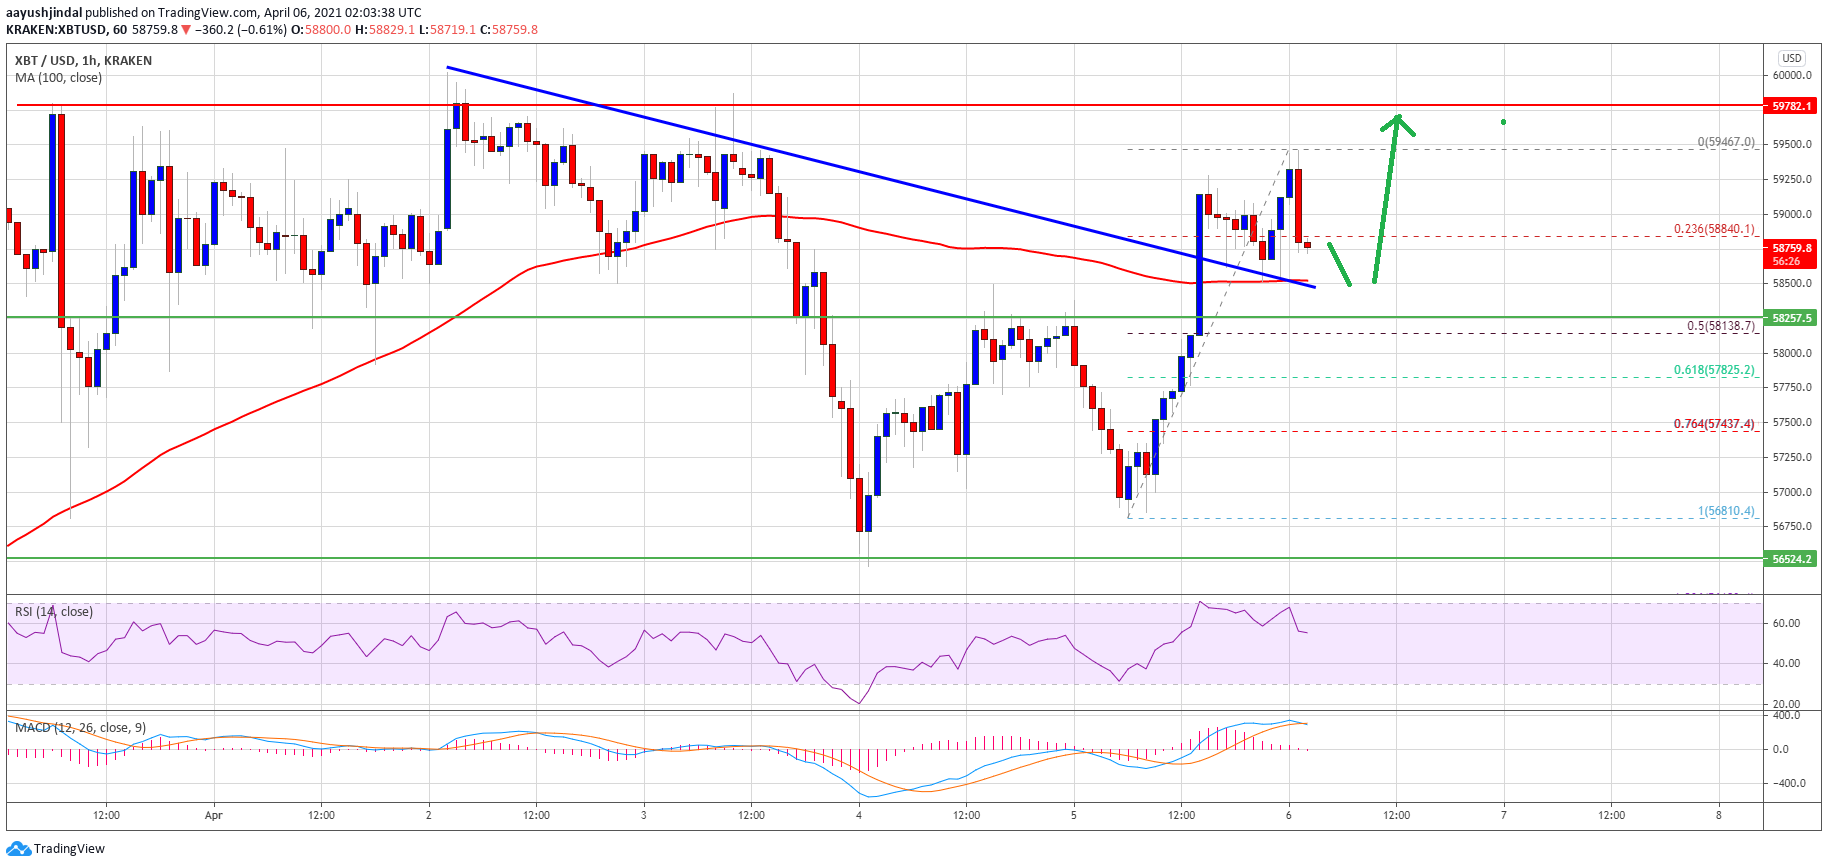
It traded below the key $58,250 support level and $58,000. It even settled below the $58,000 level and the 100 hourly simple moving average. A low is formed near $57,250 and the price is now consolidating losses near $57,500.
It seems like there is a major contracting triangle forming with support near $57,400 on the hourly chart of the BTC/USD pair. An immediate resistance on the upside is near the $57,800 level. It is near the 23.6% Fib retracement level of the recent decline from the $59,475 swing high to $57,250 low.
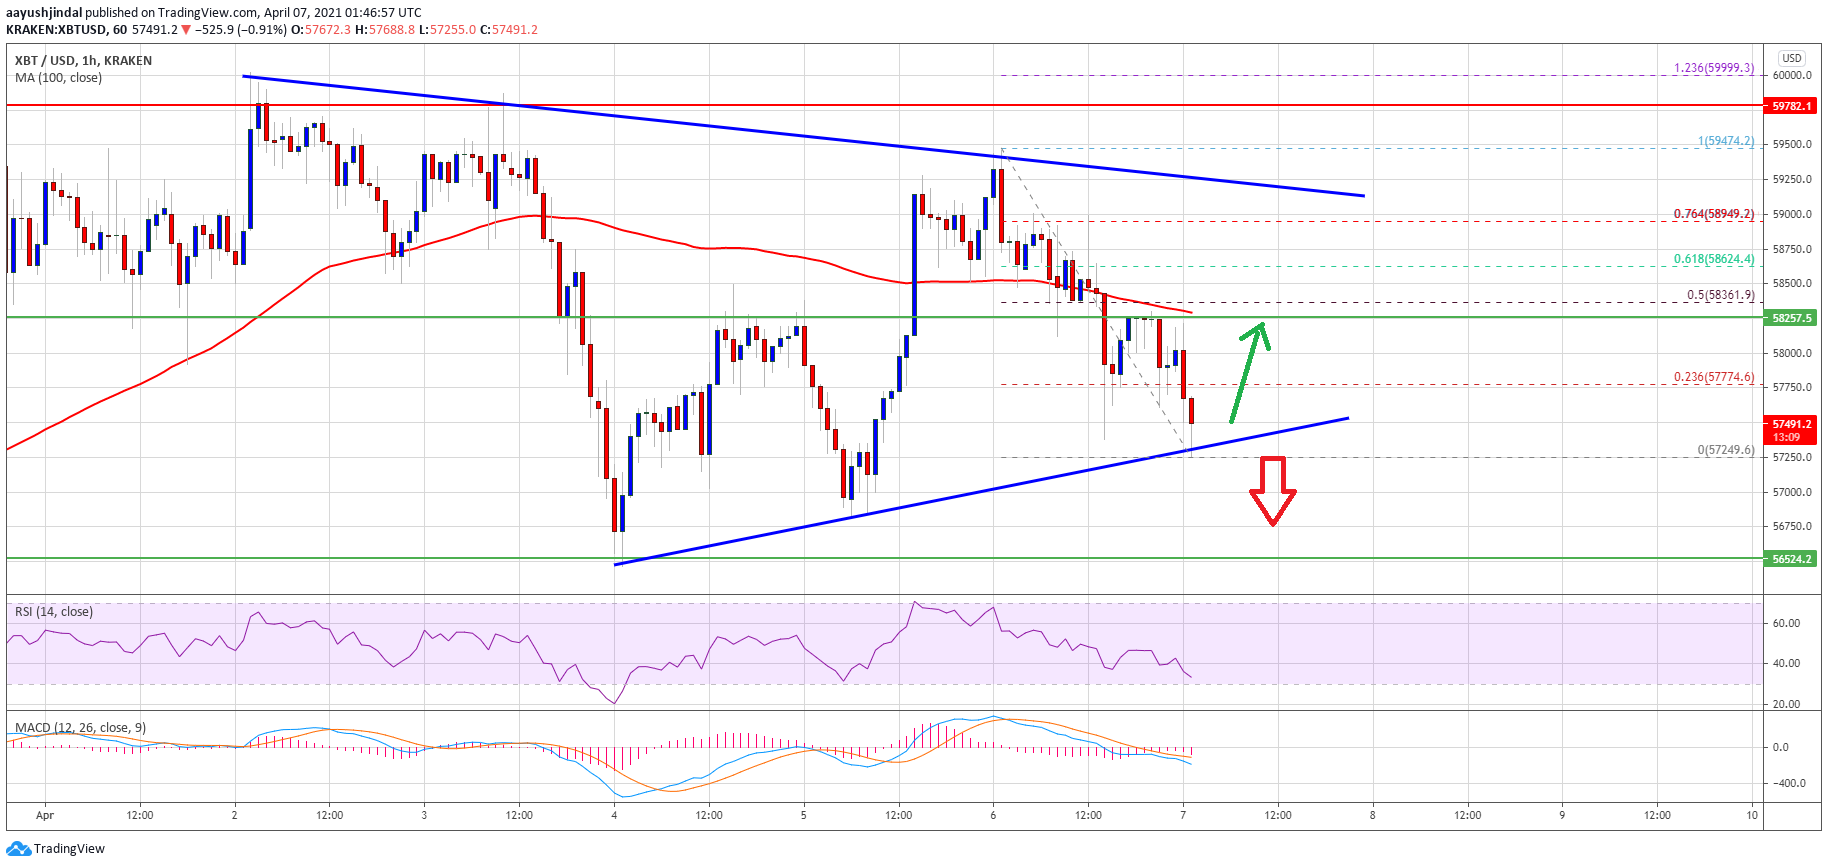
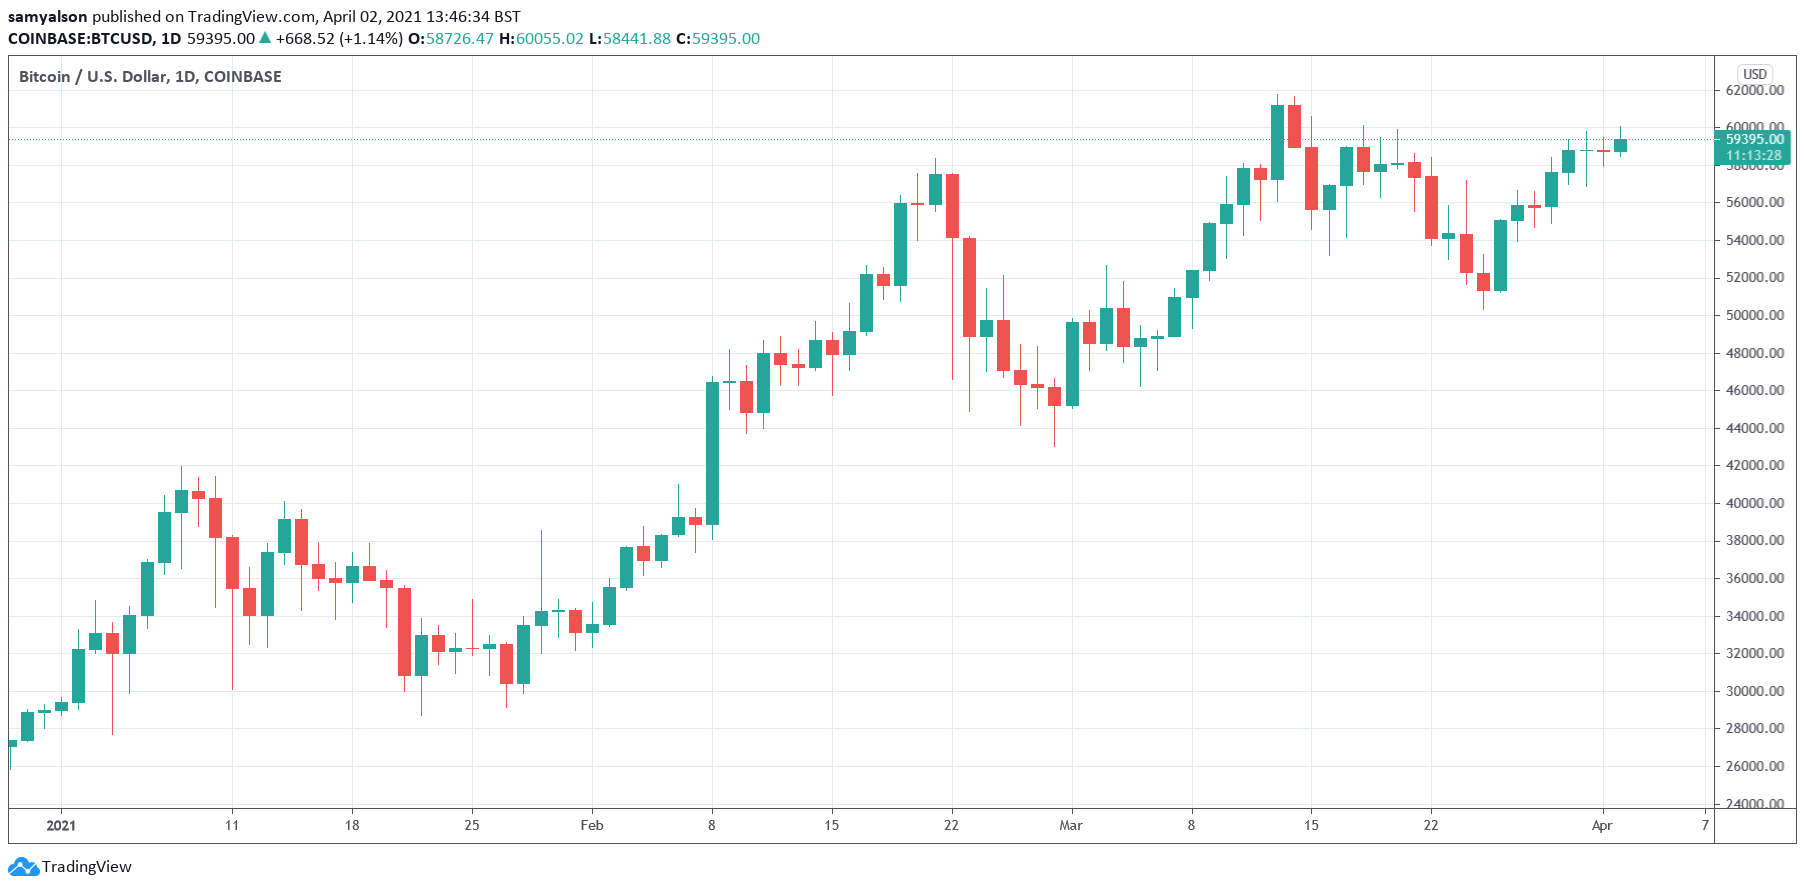
Source: BTCUSD on TradingView.com
The first major resistance is near the $58,250 level and the 100 hourly simple moving average. The 50% Fib retracement level of the recent decline from the $59,475 swing high to $57,250 low is also near $58,360.
A clear break above the $58,250 and $58,360 levels could open the doors for a steady increase. In the stated case, the price is likely to rise towards the $59,250 resistance.
Dips Limited in BTC?
If bitcoin fails to climb above $58,000 and $58,250, there could be more downsides. The first major support on the downside is near the $57,400 level and the triangle lower trend line.
A downside break below the triangle support could lead the price towards the main $56,500 support level. Any more losses might put a lot of pressure on the bulls in the near term.
Technical indicators:
Hourly MACD – The MACD is slowly losing momentum in the bearish zone.
Hourly RSI (Relative Strength Index) – The RSI for BTC/USD is now well below the 50 level.
Major Support Levels – $57,400, followed by $56,500.
Major Resistance Levels – $58,000, $58,250 and $59,200.