Crypto CEO “Convinced” Of Bitcoin Cycle Top, Warns Of Sell Side Intensity

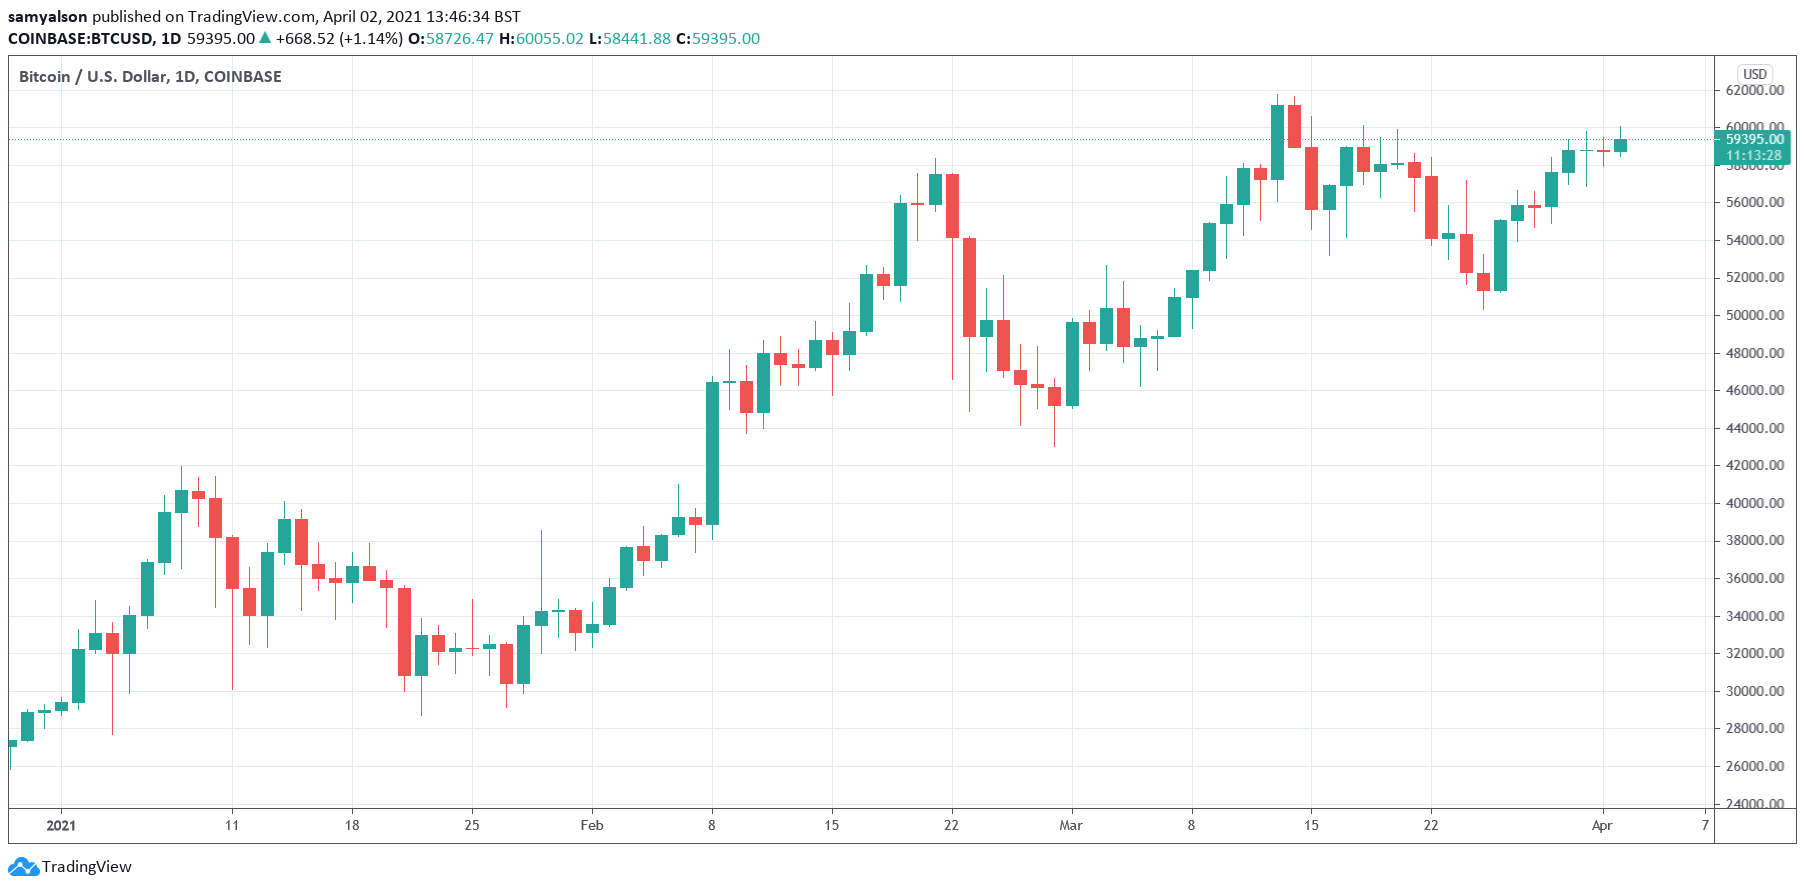
Despite the best efforts by bulls for what has been several weeks now, Bitcoin price can’t seem to get back above $60,000 and spend any meaningful time above it.

Fundamentals are as bullish as it gets for the top cryptocurrency, but bearish technicals might have finally caused sellers to step in. That’s according to one crypto company CEO, who has warned of sell side intensity increasing substantially in the last several hours. It’s caused them to be increasingly convinced that a cycle top is potentially in. Here’s a deeper look at why.

Bitcoin Bull Run On The Ropes As Technicals Face Off Against Fundamentals

Bitcoin price has had its best year on record yet dollar for dollars and fundamentals, the stock-to-flow, and just about all other data suggests that the bull run isn’t near finished yet.

Technicals have been long overheated given the strength of the showing by bulls, leaving a large string of green monthly candles on the price chart without any serious corrective behavior. The once trending strong cryptocurrency has begun to slow, struggling specifically with anything around $60,000.

Related Reading | Mathematical Mystery: Why Did The Crypto Rally Stop At The Golden Ratio?

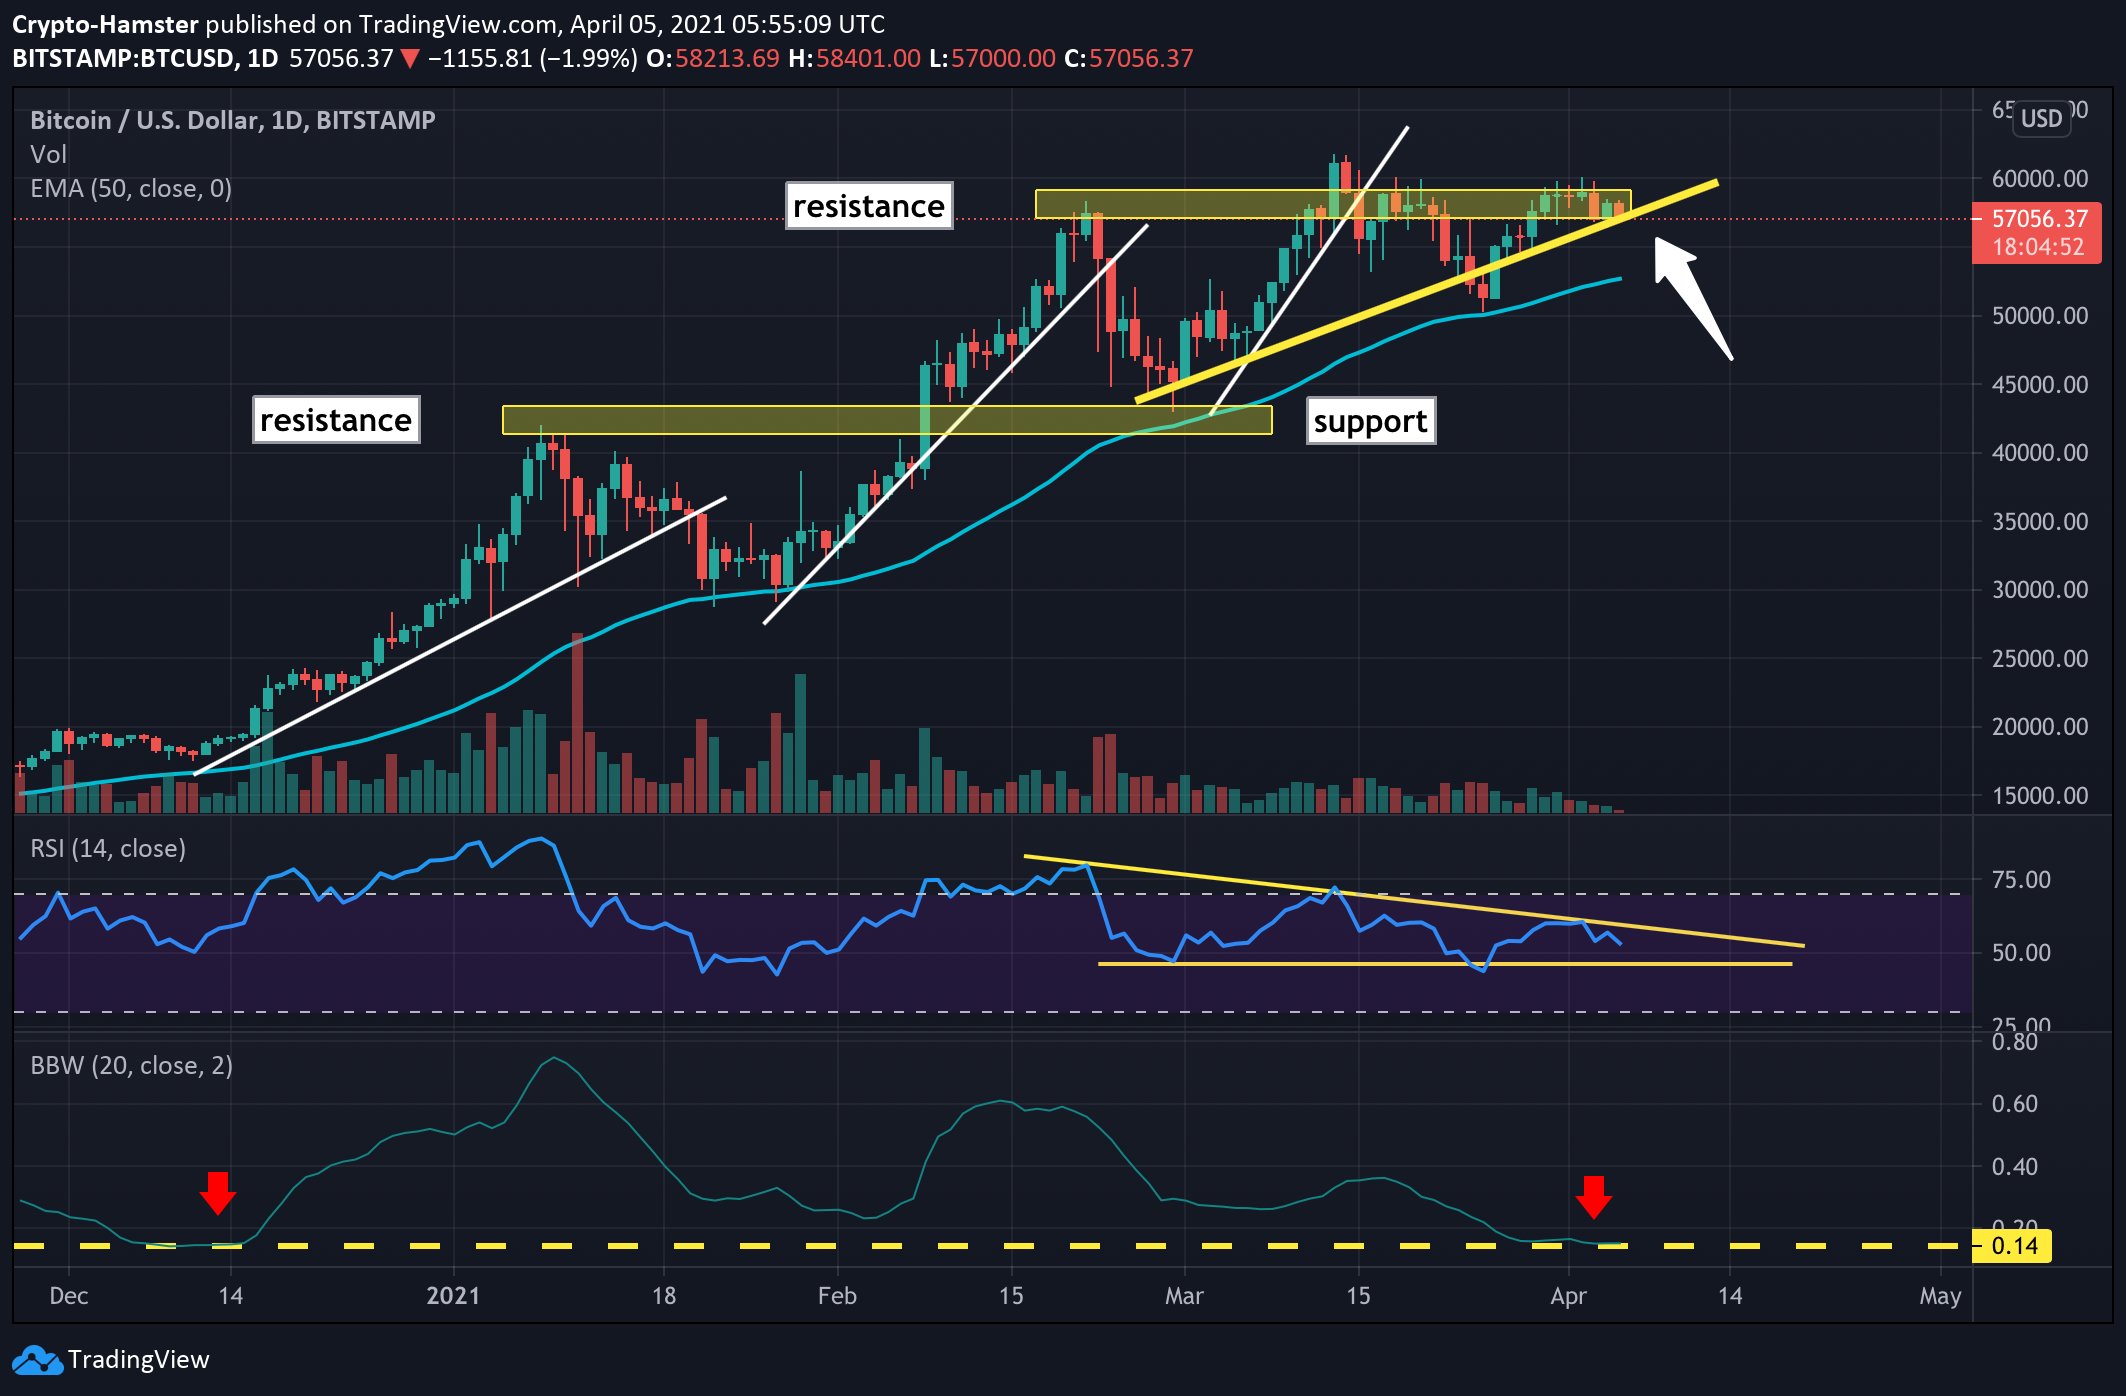
Indicators such as the logarithmic MACD are turning down on weekly timeframes for the first time since the bull phase began, and the quarterly candle just closed with the first ever bearish divergence in history. Yet the top cryptocurrency hasn’t corrected anywhere near it has in the past.

Yet it is for none of these reasons that Embily CEO Joe Saz says could very well cause the “cycle top.”

bitcoin btcusdt

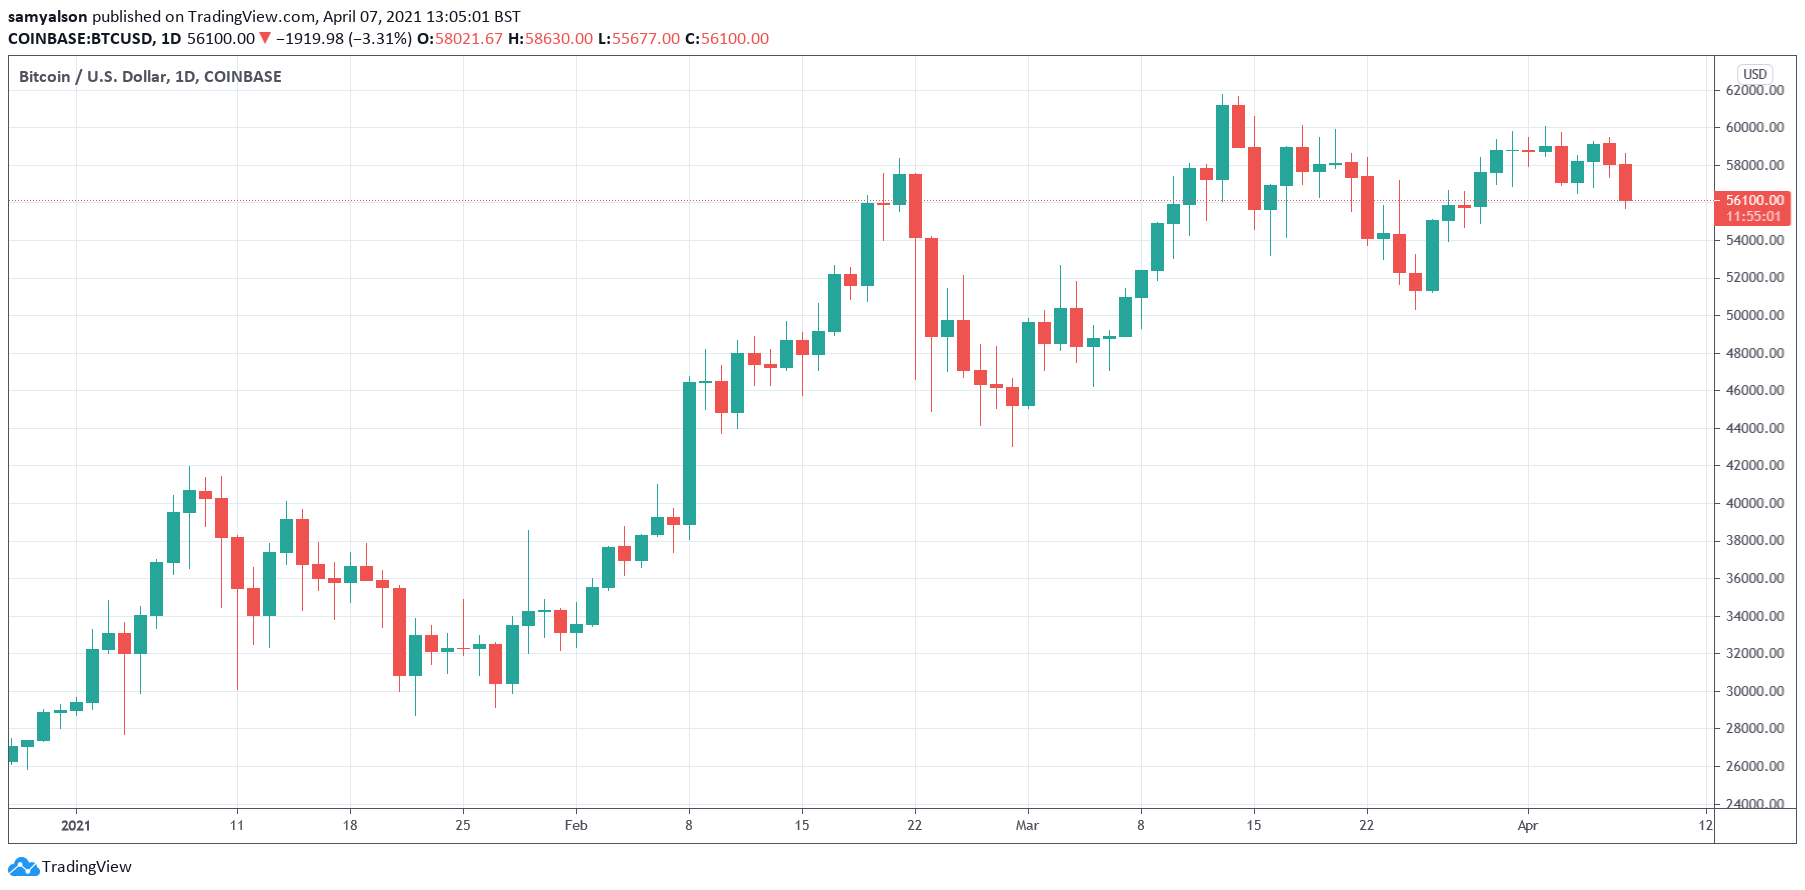
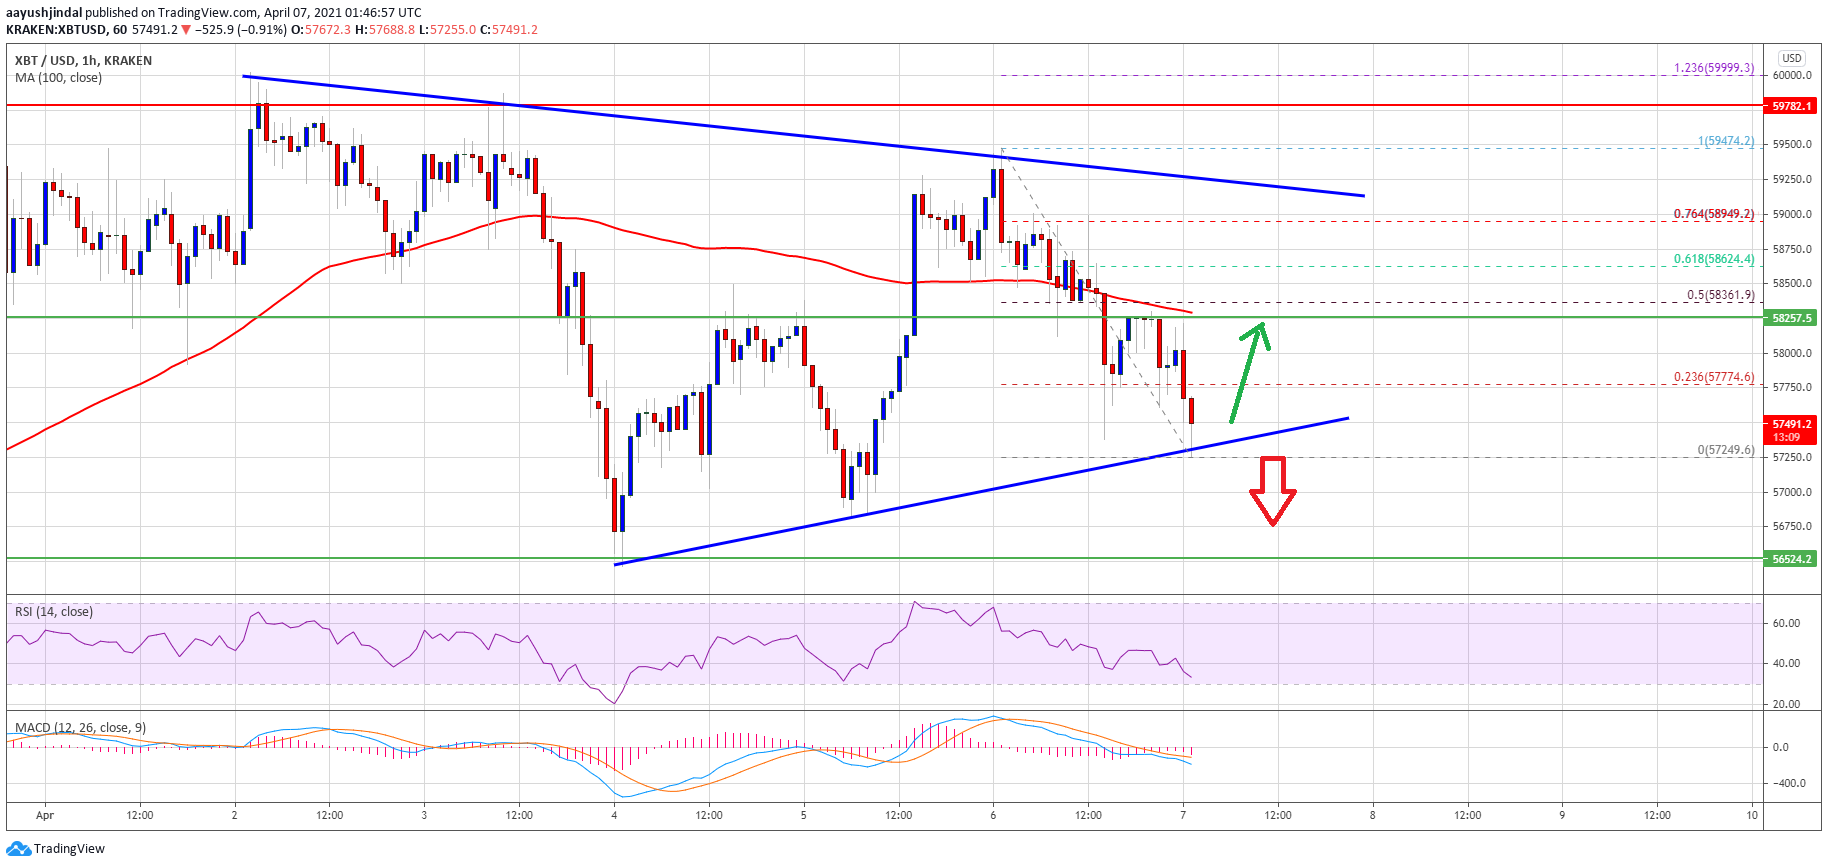
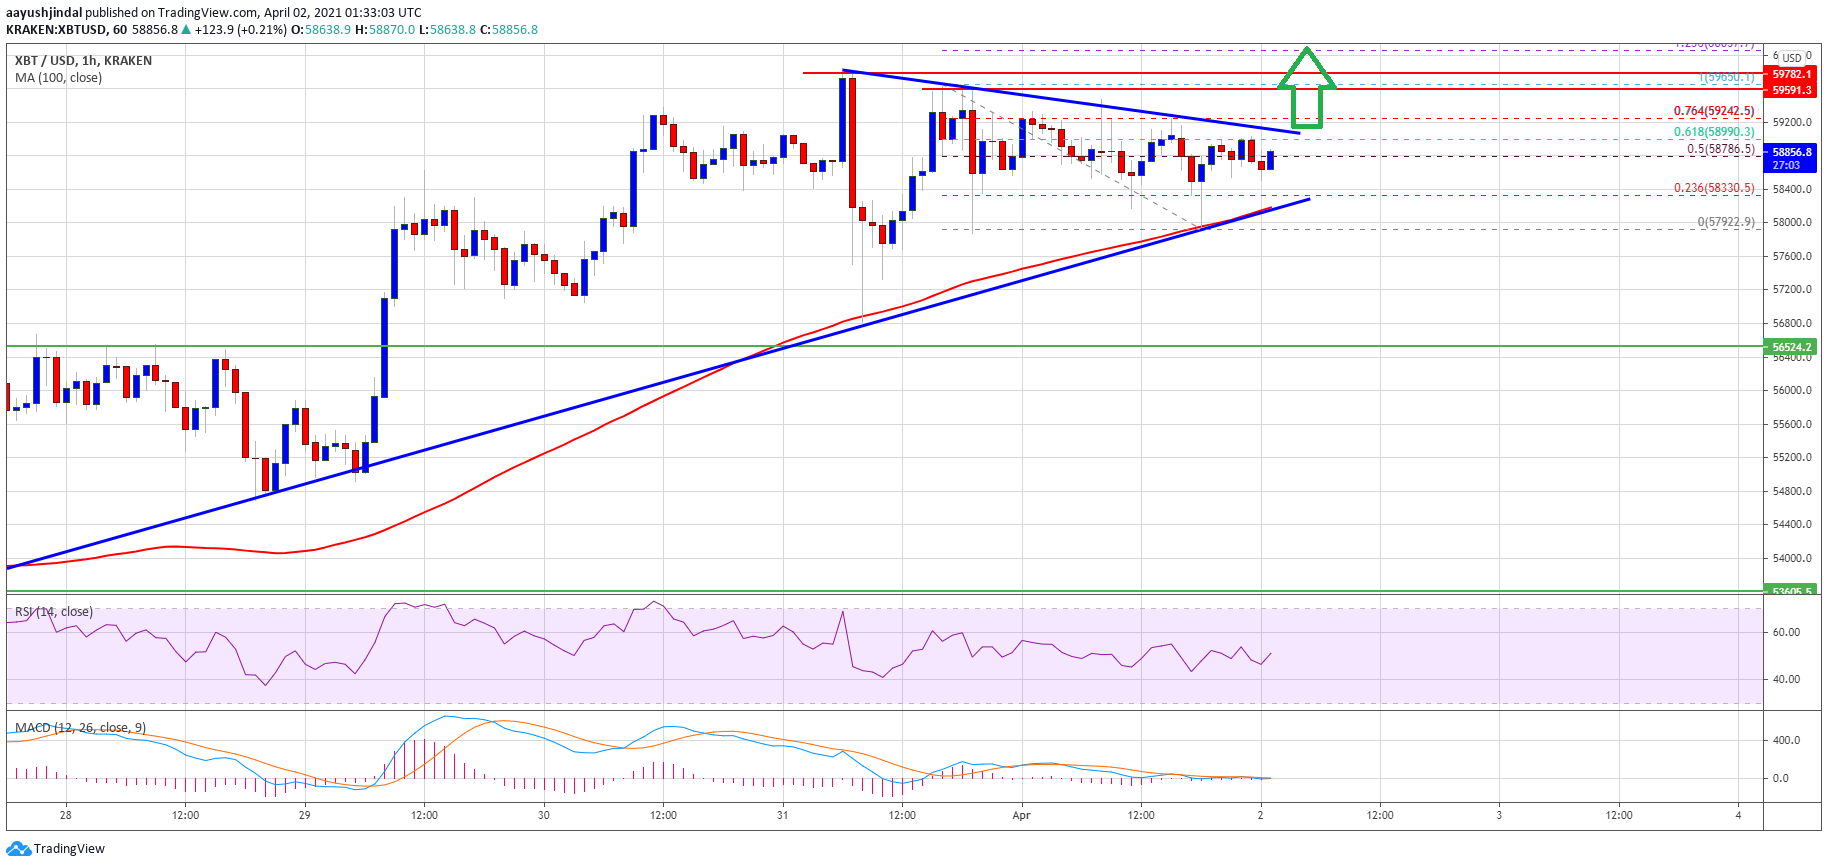
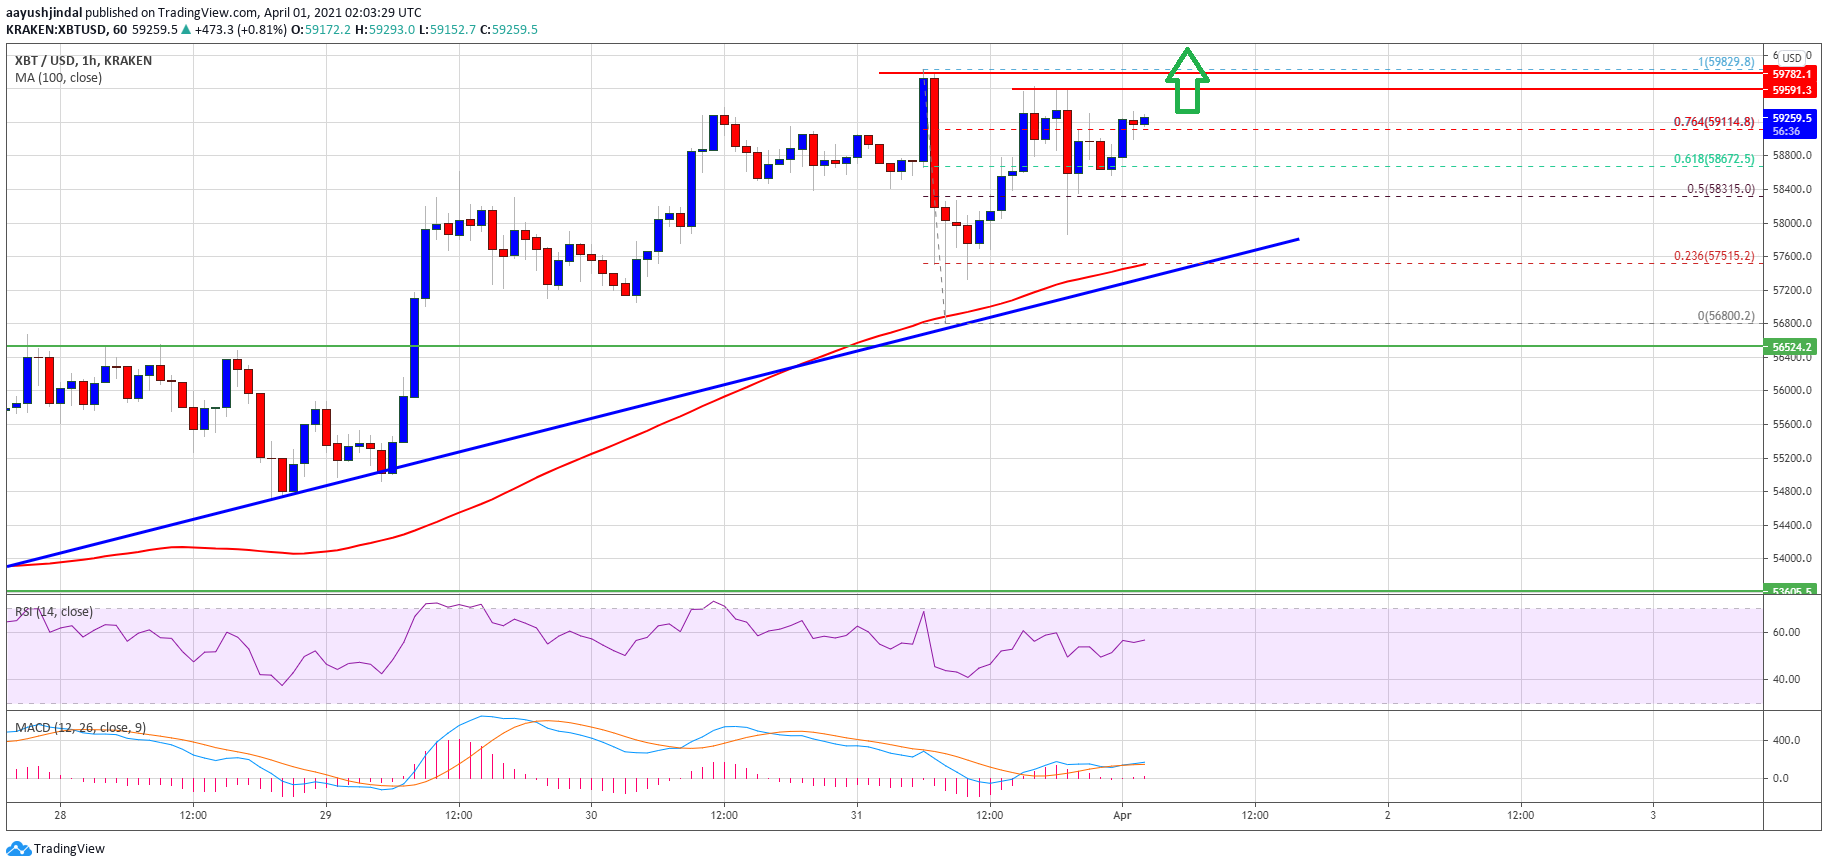
Bears have suddenly shown up just as the bull trend begins to falter | Source: BTCUSDT on TradingView.com

Why One Crypto CEO Says The Cycle Top Could Be In

Joe Saz like everyone else these days regularly offers their thoughts on what might happen next across crypto. In his latest self-proclaimed “chart spam,” he warns of something with the potential to put in the cycle top.

Saz focuses on what’s called OB, or order book analysis. He says that the rising red wave in the indicator pictures above is “ask dominance of aggregated spot markets” which he says depicts a “very serious sell side” with enough power that could topple the now struggling Bitcoin rally.

Related Reading | Why The Return Of The Kimchi Premium Doesn’t Bode Well For BTC

Essentially, what this translates to is a sudden spike in sellers appearing at current levels – more so today as price has been rising than recently. At this point, it will be a showdown between bulls and bears, but also fundamentals versus technicals.

Fundamentals remain heavily bullish for Bitcoin, but bearish technicals could at least cause the first serious correction, if not the cycle top that Saz is warning of.

Featured image from Deposit Photos, Charts from TradingView.com

Bitcoin Reclaims $58K After Fed Underscores Continued Recovery Support

Bitcoin rallied on Thursday after the Federal Reserve vowed to support the economic recovery in the United States.

The benchmark cryptocurrency jumped 3.80 percent to $58,083 after declining two days in a row. Meanwhile, its rivals across the crypto space, including the second-largest token Ethereum and its runner-up Binance Coin, also surged higher. Almost all alternative cryptocurrencies have a positive correlation with Bitcoin.

Dovish Fed

Traders started flocking into the cryptocurrency sector after minutes from the Federal Reserve’s March meeting, released on Wednesday, which showed the central bank officials are optimistic about a sustained rebound in inflation. They committed to keep their easy monetary policies unchanged until employment recovers fully from the pandemic-led economic aftermath.

“Those big mental readjustments by the market contemplating the growth outlook and what that would mean for inflation have been fully digested,” said April LaRusse, head of investment specialists at Insight Investment.

The US dollar index, which tracks the greenback’s strength against six major foreign currencies, was initially firm to the Fed’s continued dovish stance. Nevertheless, it fell by 0.38 percent on Thursday, raising fears that the dollar might resume its downtrend after inching higher so far into 2021.

US dollar index turns lower after Fed commits loose monetary policies. Source: DXY on TradingView.com

Bitcoin, which does well when the dollar underperforms, rose inversely to the greenback’s performance in the previous 48 hours.  Tom Jessop, president of Fidelity Investments’ digital assets wing, noted that the cryptocurrency has now matured as a global investment asset, which might continue to get better in coming years.

“I think we continue to see adoption at an accelerated pace for a host of reasons,” he said at an event hosted by MarketWatch and Barron’s this Wednesday.

Bitcoin Technical Outlook

The BTC/USD exchange rate showed possibilities of breaking bullish above $60,000.

Bitcoin eyes ascending channel breakout. Source: BTCUSD on TradingView.com

The pair trades inside an ascending triangle, which is technically a bullish continuation pattern in an uptrend. Its breakout target sits as high as the maximum distance between its upper and lower trendline. Therefore, if bitcoin breaks bullish above the Triangle’s upper trendline resistance (around $60,000), it would target at least $70,000 as its next upside target.

Number Of Bitcoin Mentions In Company Earnings Reports Goes Parabolic

Among the many reasons for the ongoing bull run in Bitcoin, has been the emergence of corporations and businesses adding BTC to their company treasury reserves.

The sudden increase in demand for large sums of BTC during a period of low supply has caused prices to go parabolic. Interestingly, so have the numbers of mentions in company earnings reports that reference the first ever cryptocurrency by name.

Bitcoin Becomes Corporate Treasury Asset, Led By MicroStrategy CEO Michael Saylor

2020 was undeniably the year Bitcoin officially matured as an asset. Rather than pure speculation, the cryptocurrency network has shown it is here to stay, and instead the underlying asset is being leveraged to protect against dollar inflation.

Related Reading | Mathematical Mystery: Why Did The Crypto Rally Stop At The Golden Ratio?

Hedge funds began dumping gold expecting Bitcoin to be the better performing safe haven asset and economic hedge, and shortly thereafter major publicly traded corporations started swapping out useless cash reserves for an asset that over its lifecycle has appreciated more than anything else in history.

bitcoin corproate fomo

The bull trend took off once corporations began buying BTC | Source: BTCUSD on TradingView.com

The effort was first led by Michael Saylor, CEO of the Nasdaq-listed software firm MicroStrategy, who has since attracted more high-level CEOs and brands to the cryptocurrency sector, such as Elon Musk’s Tesla, and long-time Bitcoin supporter Jack Dorsey, whose company Square Inc. also bought a lion’s share of BTC.

Mentions Of Top Cryptocurrency During Company Earnings Reports Breaks Record

Since the trend of corporations suddenly scrambling to buy the ultra scarce cryptocurrency first began, the price per coin has gone parabolic once again. Also climbing at a similar rate, is the number of mentions from company quarterly or annual earnings reports that include “Bitcoin.”

According to the Twitter handle Documenting Bitcoin via the website Compeete.com, the total mentions in earnings reports has followed a similar trajectory as the price action above.

bitcoin company mentions

Mentions of the top crypto during earnings report discussion are rising | Source: Documenting Bitcoin on Twitter

Bitcoin price is currently struggling to make it above $60,000 and push higher. However, these companies boasting about earnings could cause further FOMO-effect once other businesses learn of how much revenue participation in cryptocurrencies brought.

Related Reading | Why The Return Of The Kimchi Premium Doesn’t Bode Well For BTC

Coinbase is about to go public and its Bitcoin-related revenue has been record-breaking. FOMO might only get frothier from here on out, as the aforementioned Saylor held a seminar earlier this year focused on educating other executives on how to get BTC on the books.

The fruits of that labor could begin to blossom in the following months as those executives take a page from Saylor’s playbook, and get in on the growing earnings mentions due to rising Bitcoin revenue.

Featured image from Deposit Photos, Charts from TradingView.com

TA: Short-Term Bearish? Why Bitcoin Price Could Struggle Above $57.5k

Bitcoin price extended its decline and tested the $55,500 support against the US Dollar. BTC is now recovering, but it is likely to face a strong resistance near the $57,500 level.

  • Bitcoin failed to hold the $57,000 zone and extended its decline towards the $55,500 level.
  • The price is now trading well below the $57,500 support and the 100 hourly simple moving average.
  • There was a break below a key contracting triangle with support near $57,450 on the hourly chart of the BTC/USD pair (data feed from Kraken).
  • The pair could correct higher, but the bulls are likely to face a strong selling interest near $57,500.

Bitcoin Price Dips Further

Bitcoin struggled to restart its upward move above the $58,000 zone, resulting in a bearish move. BTC broke the $57,500 and $56,200 support levels to move further into a bearish zone.

There was also a break below a key contracting triangle with support near $57,450 on the hourly chart of the BTC/USD pair. The pair spiked below the $56,000 level and tested the next key support near the $55,500 zone.

A low is formed near $55,492 and the price is consolidating losses. It is now trading above $56,000, and testing the 23.6% Fib retracement level of the recent drop from the $59,475 swing high to $55,492 low. On the upside, the first key resistance is near the $57,000 level.

Bitcoin Price

Source: BTCUSD on TradingView.com

The main resistance is now forming near the $57,500 level (the recent breakdown zone). The 50% Fib retracement level of the recent drop from the $59,475 swing high to $55,492 low is also near the $57,500 level to act as a massive hurdle. A clear break above the $57,500 level could open the doors for a steady increase.

More Losses in BTC?

If bitcoin fails to climb above $57,000 and $57,500, there could be more downsides. The first major support on the downside is near the $56,000 level.

The main support is now forming near the $55,500 level. A downside break below the recent low and $55,500 could accelerate losses. The next target for the bears might be $53,200 or even $52,500 in the near term.

Technical indicators:

Hourly MACD – The MACD is slowly losing momentum in the bearish zone.

Hourly RSI (Relative Strength Index) – The RSI for BTC/USD is still well below the 50 level.

Major Support Levels – $56,000, followed by $55,500.

Major Resistance Levels – $57,000, $57,500 and $58,000.

How Bitcoin Dominance Bullish Engulfing Could Signal An End To Altcoin Season

Bitcoin price is diving currently, shaking up the crypto market as a whole. In addition to the correction in the top cryptocurrency by market cap, altcoins have taken an even more severe beating.

With top alts like Ethereum and Litecoin are seeing an even further drop on BTC trading pairs, Bitcoin dominance has formed a bullish engulfing candle just as a key technical indicator reach overheated status. Here’s how that could put an abrupt end to the ongoing altcoin season.

Bitcoin Price Drop Causes Altcoins To Flop

Bitcoin is the first ever cryptocurrency that an entire industry was built from since, and anything that isn’t BTC is considered an altcoin. Ethereum is currently the king of that camp, and is outpacing Bitcoin in performance since its inception.

But due to first move advantage and just how dominant Bitcoin is, it represents more than 50% of the entire crypto market cap. The BTC dominance metric was created to measure the rest of the crypto market and its weight compared to all altcoins.

Related Reading | Following Bitcoin “Reset,” It’s “Off To The Races Again”

BTC dominance has dropped by 18% since end of 2020 highs, leaving a red streak behind. However, during today’s crypto market bloodbath, the metric began to make a comeback and has formed a bullish engulfing candle.

A bullish engulfing candle is a type of Japanese candlestick formation, that typically suggests a short term reversal is in the coming. It forms when after a sharp bearish move, sellers are overwhelmed by a sudden surge in bullish buying. It is then up to bulls to continue the reversal.

bitcoin dominance btc.d reversal bullish engulfing

A bullish engulfing appears as daily RSI reached oversold conditions | Source: CRYPTOCAP-BTC.D on TradingView.com

BTC Dominance Reversal Could Put An End To Alt Season

Coinciding with the bullish engulfing candle pictured above, the daily Relative Strength Index fell sharply into oversold territory. If a reversal plays out in BTC dominance, whatever altcoin season that’s been going on recently, will be over.

Adding more credence to the theory of further reversal in the relationship between Bitcoin and altcoins, on weekly timeframes a hidden bullish divergence has formed, just as BTC.D touches down at the bottom Bollinger Band.

Bitcoin dominance hidden bull div

A bull div on the RSI has formed as dominance falls to Bollinger Band support | Source: CRYPTOCAP-BTC.D on TradingView.com

Divergences occur when price action moves opposite a technical indicator – in this case the Relative Strength Index again on weekly timeframes. Although daily has fallen into completely oversold levels, weekly either has more to go, or buyers are secretly showing up ready to stage a reversal.

Counter Point | Why Bitcoin Dominance Is No Longer Relevant To Crypto

If bulls can begin the comeback starting with a bullish engulfing today, and close out next week with a powerfully bullish move, a morning star doji pattern will be left on weekly charts, adding yet another signal that an extended reversal could result.

Any reversal in BTC.D, could either have Bitcoin leaving alts in its dust, or the coins crash far further than the top cryptocurrency does on its way back down. All that’s left to do, is wait and see.

Featured image from Deposit Photos, Charts from TradingView.com

Palihapitiya Replies to Munger’s Bitcoin is a “Scum Ball Activity” Assessment

The Founder of Social Capital, Chamath Palihapitiya said Buffett, Munger, and Gates are wrong about their negative assessment of Bitcoin. Like Buffett and Munger, the Canadian venture capitalist is also considered something of a savvy investor. However, when it comes to cryptocurrency, that’s where the similarities end.

Palihapitiya Defends Bitcoin

During a CNBC interview, a series of short clips featuring Buffett, Munger, and Gates was shown.

On Bitcoin, Buffett said, “the asset itself is creating nothing.” Whereas Munger led with “I think it’s a scum ball activity.” While Gates holds little hope of sustained price appreciation saying, “I would short it if there was an easy way to do it.”

Responding to the comments Palihapitiya said he thinks all three are wrong. Explaining further, he was quick to credit Buffett and Munger, adding that he considers himself a disciple of their achievements. But he also pointed out that technology falls outside of their “circle of competence.”

“Look, not everybody is right all of the time, and I think we have to acknowledge that we all have biases. And look, I’m a disciple of Buffett and Munger, and one of the things that they have said for years, which I believe, is you define a circle of competence and you stay within it.”

Answering the argument that Bitcoin is not technology, rather it’s a nonproductive asset similar to gold, Palihapitiya acknowledged this comparison. But in true Michael Saylor fashion, said he believes Bitcoin is a replacement for gold.

Sharing his own investment strategy, Palihapitiya said he holds 99% risk on and 1% risk-off. Saying holding 1% Bitcoin in the risk-off bucket is ultimately about buying insurance.

“The people that own Bitcoin in 2012 all the way up to now, the majority of those people view it as a hedge to the traditional financial infrastructure. Whether that’s true or not is unclear, but that’s how we’ve all viewed it.

2020 is The Most Correlated Year on Record

There is debate on whether Bitcoin is a hedge asset or not.

Data from Morningstar going back to 2013 shows an overall weak correlation between major asset classes and Bitcoin. This lends support to the argument that Bitcoin is a hedge asset.

However, last year saw a greater degree of positive correlation between all major asset classes and Bitcoin, with gold being the most correlated.

Source: etftrends.com

Analysts put this down to increasing Bitcoin adoption, citing record volumes and increasing activity from payment networks.

“This rise in correlation may be a result of its increasing adoption, as evidenced by record volumes traded, the rise in OTC-traded bitcoin funds and an increasing number of payment networks enabling bitcoin and digital asset buying and selling on their networks.”

If so, would mass adoption mean the loss of Bitcoin’s hedge status?

Bitcoin daily chart

Source: BTCUSD on TradingView.om

Rich Dad Poor Dad’s Kiyosaki is Buying More Bitcoin Today, But Why?

People usually buy Bitcoin in hopes that they would be able to sell it to others for higher profits. But for a celebrated financial expert like Robert Kiyosaki, Bitcoin is an opportunity to break away from government surveillance.

The ‘Rich Dad Poor Dad’ author delivered a tweet Wednesday morning in which he said that he would buy Bitcoin because of his anxieties over “digital yuan,” a federally-controlled version of Bitcoin, put to trial by the People’s Bank of China on Tuesday after taking years for developing it.

Bitcoin versus Digital Yuan Battle Heats Up

In retrospect, Digital Yuan falls in the category of central bank digital currencies, or CBDC, whose sole purpose is to put a national currency atop a private blockchain ledger. Bitcoin serves in contrast as a decentralized cryptocurrency, managed by not one but hundreds of thousands of entities — aka miners.

As usual, no government or central bank gains control over Bitcoin’s source code, making it more independent than a regular CBDC.

But with China’s involvement in the CBDC space, things have become more about gaining virtual control over people’s financial lives. In his statements to the Financial Times, a Wall Street banker noted that President Xi Jinping’s authoritative regime would use digital yuan or digital renminbi to bring people’s everyday transactions under its radar — a thing it is already doing via its strict internet policies.

“The [digital renminbi] is heavily about the [Chinese Communist] party’s ability to exercise control,” also said Samantha Hoffman, senior analyst at the Australian Strategic Policy Institute.

Such fears alone have prompted people to opt for Bitcoin. While every transaction on Bitcoin’s blockchain is traceable, its backers tend to hide behind gibberish alphanumeric identities, thus gaining a thin layer of security from regulatory watchdogs.

Snapshot of a live transaction on the Bitcoin network. Source: BTC.com

Nevertheless, they risk being traced if even one entity in their long chain of bitcoin transactions reveals itself either by using a wallet that has gone through a know-your-customer process or just by practicing human negligence.

But…

…despite its limitation, Bitcoin appears better than a digital yuan to many. Mr. Kiyosaki is one among them.

“I would rather have Bitcoin than government fake surveillance crypto,” he said Wednesday. “Buying more [of the cryptocurrency].”

Shark Tank investor and software entrepreneur Kevin O’Leary also said in an interview with CNBC that he would rather buy Bitcoin than China’s “blood money,” citing carbon issues related to the cryptocurrency mining process in the country.

Many also see Bitcoin as a de-facto Chinese currency. More than 65 percent of the cryptocurrency’s mining pools/companies operate from China, according to Statista, giving the Jinping regime unprecedented — and potential — access to its supply to the rest of the world.

According to Mr. O’Leary himself, investors remain concerned about China’s excessive control of Bitcoin. They remain put off by the cryptocurrency, he noted.

The cost of one Bitcoin has increased twofold in 2021 due to institutional interest. The cryptocurrency was trading shy of $57,000 at the time of this writing.

TA: Bitcoin Corrects Below $58K, But Here’s Why Uptrend Is Still Intact

Bitcoin price failed to surpass the $59,500 resistance against the US Dollar. BTC is now trading below $58,000, but it is still above important supports such as $56,500.

  • Bitcoin failed to gain strength above the $59,200 and $59,500 resistance levels.
  • The price is now trading below the $58,250 support and the 100 hourly simple moving average.
  • There is a major contracting triangle forming with support near $57,400 on the hourly chart of the BTC/USD pair (data feed from Kraken).
  • The pair is likely to start a fresh increase as long as there is no close below $56,500.

Bitcoin Price Corrects Lower

Bitcoin climbed above the $59,000 level, but it failed to gain strength above the $59,200 and $59,500 resistance levels. BTC traded as high as $59,475 and recently started a downside correction.

It traded below the key $58,250 support level and $58,000. It even settled below the $58,000 level and the 100 hourly simple moving average. A low is formed near $57,250 and the price is now consolidating losses near $57,500.

It seems like there is a major contracting triangle forming with support near $57,400 on the hourly chart of the BTC/USD pair. An immediate resistance on the upside is near the $57,800 level. It is near the 23.6% Fib retracement level of the recent decline from the $59,475 swing high to $57,250 low.

Bitcoin Price

Source: BTCUSD on TradingView.com

The first major resistance is near the $58,250 level and the 100 hourly simple moving average. The 50% Fib retracement level of the recent decline from the $59,475 swing high to $57,250 low is also near $58,360.

A clear break above the $58,250 and $58,360 levels could open the doors for a steady increase. In the stated case, the price is likely to rise towards the $59,250 resistance.

Dips Limited in BTC?

If bitcoin fails to climb above $58,000 and $58,250, there could be more downsides. The first major support on the downside is near the $57,400 level and the triangle lower trend line.

A downside break below the triangle support could lead the price towards the main $56,500 support level. Any more losses might put a lot of pressure on the bulls in the near term.

Technical indicators:

Hourly MACD – The MACD is slowly losing momentum in the bearish zone.

Hourly RSI (Relative Strength Index) – The RSI for BTC/USD is now well below the 50 level.

Major Support Levels – $57,400, followed by $56,500.

Major Resistance Levels – $58,000, $58,250 and $59,200.

Kevin O’Leary Predicts Emergence of Distinct Clean vs. Dirty Bitcoin Markets

We’re all familiar with the concept of organic vs. non-organic food, but Shark Tank’s Kevin O’Leary sees a similar distinction being applied to Bitcoin. He predicts the divergence of Bitcoin into two classes, the clean “virgin” coin mined using renewable energy in “whitelisted” countries, and, in reference to the diamond trade, what he calls “blood coins.”

O’Leary had previously called Bitcoin garbage and worthless. His reasoning, back then, was the inability to buy goods and services with it.

O’Leary Will Only Buy Clean Bitcoin

Speaking to CNBC, O’Leary said he would only purchase sustainably produced Bitcoin and never “blood coins” from China. He added that this contrast would become more apparent in the next year or two, forming distinct markets in the process.

“I’m not buying coin unless I know where it was mined, when it was mined, the provenance of it. Not in China. No blood coin for me.”

The Canadian entrepreneur said investors increasingly want to know where their investments are sourced. As the Chair of O’Shares ETFs, O’Leary mentioned that institutional investors had inundated him with queries asking if he was buying “blood coins” from China.

More and more, institutions impose restrictions on the assets they hold to comply with environmental and corporate governance rules. Issues to do with human rights and environmental damage get the thumbs down. He also said “made in China” is increasingly becoming shunned.

“institutions will not buy [BTC] mined in China, coins that have been mined using coal to burn for electricity, or coins mined in countries with sanctions on them.”

U.S.-China Trade War Still On-Going

Talk of a U.S.-China trade war was prominent a year or so ago. Flashpoints included the arrest of Meng Wanzhou, the daughter of Huawei’s founder, on Canadian soil at the request of the U.S., And the trade ban restricting U.S. firms from dealing with the Chinese, in particular tech and chip companies.

While these stories have faded in recent times, O’Leary claims the trade war between the U.S. and China continues. He calls for more aggressive action against China to “level the playing field.” His suggestions include delisting Chinese stocks and restricting access to U.S. legal system.

O’Leary maintains that this is how U.S. firms are dealt with in China. He added that even as a manufacturer in China, he could not sell into the Chinese market.

“I can’t sell my product there, and yet they enjoy those benefits in North America and in Europe.”

The World Bank ranks China 31st out of 190 countries for ease of doing business. While the U.S. takes 6th place in the same report.

Many foreign companies persevere in accessing the lucrative Chinese market. In some cases, the Chinese government requires a partnership or joint venture with a Chinese firm to do business in China.

Bitcoin daily chart

Source: BTCUSD on TradingView.com

TA: Bitcoin Settles Above 100 SMA, Why BTC Could Retest $60K

Bitcoin price started a fresh increase and it cleared the $58,250 resistance against the US Dollar. BTC is now showing positive signs and it might soon revisit $60,000.

  • Bitcoin started a fresh increase above the $58,000 and $58,250 resistance levels.
  • The price is now trading nicely above $58,250 and the 100 hourly simple moving average.
  • There was a break above a major bearish trend line with resistance near $58,650 on the hourly chart of the BTC/USD pair (data feed from Kraken).
  • The pair is now consolidating above the 100 hourly SMA and it might continue higher towards $60,000.

Bitcoin Price Breaks Key Resistance

Bitcoin formed a support base above the $57,000 level and recently started a fresh increase. BTC broke a couple of key hurdles near $57,500 and $58,250 to move into a positive zone.

There was a break above the $58,500 resistance zone and the 100 hourly simple moving average. Moreover, there was a break above a major bearish trend line with resistance near $58,650 on the hourly chart of the BTC/USD pair.

The pair settled nicely above the $58,250 level and the 100 hourly SMA. It traded as high as $59,467 and it is currently consolidating gains. It is trading just below the 23.6% Fib retracement level of the recent wave from the $56,810 low to $59,467 high.

Bitcoin Price

Source: BTCUSD on TradingView.com

An initial support is near the $58,500 level and the 100 hourly simple moving average. An immediate resistance is near the $59,000 level, followed by the $59,467 high.

The main resistance is still near the $60,000 level. If there is an upside break above $60,000, there are chances of a steady increase towards the $62,000 zone in the near term.

Dips Limited in BTC?

If bitcoin fails to climb above $59,000 and $59,500, there could be a downside correction. The first major support on the downside is near the $58,500 level and the 100 hourly SMA.

The next major support is near the $58,250 level (the recent breakout zone). It is close to the 50% Fib retracement level of the recent wave from the $56,810 low to $59,467 high. Any more losses might lead the price towards the $57,500 support zone in the coming sessions.

Technical indicators:

Hourly MACD – The MACD is slowly losing momentum in the bullish zone.

Hourly RSI (Relative Strength Index) – The RSI for BTC/USD is now above the 50 level.

Major Support Levels – $58,500, followed by $58,250.

Major Resistance Levels – $59,000, $59,500 and $60,000.

Why The Return Of The Kimchi Premium Doesn’t Bode Well For Bitcoin

Bitcoin price is currently trading at a substantial premium on South Korean crypto exchanges – more than $6,000 per coin in USD equivalent. However, in the past this so-called “Kimchi Premium” has signaled the end of the bull trend.

Is this a sign that things  across the crypto market could soon turn bearish? Or is there something else afoot going on with the US dollar and the South Korean won that is causing the discrepancy?

Bitcoin FOMO Comes To A Boiling Point In South Korea, According To Price Premium

Bitcoin is an asset unlike anything else in the world before it. There’s no company involved like stocks; no country like fiat currencies; nor does it have a physical form like a commodity.

Because the decentralized cryptocurrency technology is controlled by no state actor, the underlying asset could some day become the first non-sovereign global reserve currency.

Related Reading | Mathematical Mystery: Why Did The Bitcoin Rally Stop At The Golden Ratio?

The crypto market like these other assets, however, also trades globally, and is subject to deviations in price data depending on how aggressive one region’s currency is being exchange to buy up BTC.

Once again, crypto FOMO has taken hold in the country of South Korea, resulting in the return of something called the “Kimchi Premium.”

bitcoin kimchi premium

The Kimchi Premium has Bitcoin priced nearly $6,000 higher in South Korea | Source: BTCUSD on TradingView.com

The Return Of The Kimchi Premium Could Spell Danger For The Ongoing Crypto Bull Run

The chart above demonstrates the sizable deviation between BTCUSD and BTCKRW. The discrepancy is roughly $6,000 USD currency and climbing. The crypto community has dubbed this unusual phenomenon the “Kimchi Premium.”

Related Reading | Heads Up: Bearish Bitcoin Technical Pattern Shouldn’t Be Shrugged Off

It isn’t clear what’s causing such FOMO amongst South Korean investors, but the so-called premium hasn’t been around since the last week of 2017.

bitcoin kimchi premium zoomed

The last time the Kimchi Premium was so prominent, it was the peak of the last bull market. | Source: BTCUSD on TradingView.com

Zooming out, the last time the Kimchi Premium moved away from the standard BTCUSD ticker priced in dollars, that was the grand finale for the previous bull market.

While the USD trading pair made lower highs, the KRW trading pair made another higher high before together falling into the 2018 bear market. Thus far, the premium has never been used as a signal to take action, as historically, it hasn’t appeared often enough to take action on.

But its existence is undeniable, nor what came after the two country’s Bitcoin price tickers separated by this much in the past. Whatever the case may be, the Kimchi Premium should be something to pay close attention to for the near future.

Featured image from Deposit Photos, Charts from TradingView.com

5 Critical Bitcoin Trading Takeaways for This Week as Price Falls

Bitcoin opened this week in negative territory as its price wobbled around a key support/resistance level of $57,000.

The benchmark cryptocurrency was down 0.97 percent, trading for $57,639 ahead of the New York opening bell Monday. Its move downhill came as a part of a broader bearish correction that started after the price crossed $60,000 late last week. From then to this press time, the bitcoin price fell roughly 4 percent.

Bitcoin struggles to post a breakout above $60,000. Source: BTCUSD on TradingView.com

The cryptocurrency’s latest correction downhill marked the second time its price rejected breakout attempts above $60,000. In March, the BTC/USD exchange rate had declined by more than 18.50 percent after logging a record high of $61,778 (data from Coinbase). That increased the prospect of Bitcoin heading lower after the latest upside rejection.

Nevertheless, a pseudonymous analyst called the $57,000 level an “important point” to determine the bitcoin market’s next bias. He listed five critical factors that traders should focus on to guess where the price would head next, listed as follows.

#1, #2, and #3: Resistance Area, Ascending Triangle, and 50-EMA

Three technical patterns join together to provide Bitcoin a bullish setup this week: a resistance area that has faced repeated breakout attempts since mid-March; an ascending triangle structure that expects to shoot prices upward; and a 50-day exponential moving average that provides support to the overall short-term bullish bias.

Bitcoin trade setup, as presented by CryptoHamster. Source: BTCUSD on TradingView.com

As the analyst presented, Bitcoin needs to hold its Ascending Triangle support.

If the cryptocurrency fails to do so, a decline towards the 50-EMA would still protect its upside bias. Meanwhile, the resistance area, which somewhat operates as an upper trendline area for the Ascending Triangle pattern, would ultimately give up for a breakout attempt, shooting the BTC/USD rates upward by as much as the Triangle’s maximum length.

That would put the pair en route to $70,000. But for now, it risks declining towards $54,000 to test the 50-EMA.

#4 and #5: Descending Triangle on Bitcoin RSI, BB Width

The analyst spotted two anti-bullish indicators: a descending triangle on Bitcoin one-day Relative Strength Indicator and a very squeezed Bollinger Bands Width.

A declining RSI against a rising price medium-term alerted about a potential bearish divergence. That means that bitcoin’s upside momentum is slowing down. Traders may express their bullish exhaustion down the road.

Meanwhile, with Bolinger Bands Width lowering, it reflects declining price volatility in the Bitcoin market. That typically leads to a sudden trend explosion to either end: uptrend or downtrend. Coupling that with the bearish divergence alert, the maximum risk appears to be on the downside.

Photo by Nadine Shaabana on Unsplash 

TA: Bitcoin Faces Hurdles Near $58.5K, Why Dips Remain Attractive

Bitcoin price is currently facing resistance near $58,250 and $58,500 against the US Dollar. BTC could dip in the short-term, but the bulls are likely to remain active near $57,000.

  • Bitcoin recovered above $57,500, but it is facing resistance near $58,250.
  • The price is still trading well below $58,500 and the 100 hourly simple moving average.
  • There is a key bearish trend line forming with resistance near $58,600 on the hourly chart of the BTC/USD pair (data feed from Kraken).
  • The pair could dip again, but the bulls are likely to remain active near $57,000.

Bitcoin Price is Facing Hurdles

Bitcoin remained well bid above the $56,500 support zone. As a result, BTC started a fresh increase above the $57,000 and $57,250 resistance levels.

The price even cleared the 23.6% Fib retracement level of the recent drop from the $59,872 high to $56,488 low. However, the price seems to be facing a strong resistance near the $58,250 and $58,500 levels.

It is now trading well below $58,500 and the 100 hourly simple moving average. An immediate resistance is near the $58,180 level. It is near the 50% Fib retracement level of the recent drop from the $59,872 high to $56,488 low.

Bitcoin Price

Source: BTCUSD on TradingView.com

The main resistance is forming near the $58,500 level (a multi-touch zone). There is also a key bearish trend line forming with resistance near $58,600 on the hourly chart of the BTC/USD pair.

If there is an upside break above the $58,250 and $58,500 resistance levels, there are chances of a steady increase. In the stated case, bitcoin price is likely to rise towards the $60,000 and $60,500 levels.

Dips Limited in BTC?

If bitcoin fails to climb above $58,250 and $58,500, there could be a downside correction. The first major support on the downside is near the $57,500 level.

The next major support is near the $57,150 level, below which the price might decline towards the main $56,500 support zone. If there is a downside break below the $56,500 support level, the bulls are likely to lose control. In this case, the bears are likely to aim a test of the $55,000 level.

Technical indicators:

Hourly MACD – The MACD is slowly gaining momentum in the bearish zone.

Hourly RSI (Relative Strength Index) – The RSI for BTC/USD is now below the 50 level.

Major Support Levels – $57,000, followed by $56,500.

Major Resistance Levels – $58,180, $58,250 and $58,500.

Why Bitcoin Price Could Restart Rally Unless It Dives Below $56.5K

Bitcoin price is correcting gains from $60,000 against the US Dollar. BTC is likely to start a fresh increase as long as there is no close below $56,500 and $55,250.

  • Bitcoin gained bullish momentum above $58,000, but it failed to settle above $60,000.
  • The price is now trading above the $56,500 support and the 100 simple moving average (4-hours).
  • There is a key bullish trend line forming with support near $56,800 on the 4-hours chart of the BTC/USD pair (data feed from Kraken).
  • The pair could start a fresh increase unless the bears gain strength below $56,500 in the near term.

Bitcoin Price is Holding Key Support

This past week, bitcoin price saw a steady increase above the $55,500 resistance against the US Dollar. The BTC/USD pair broke the $58,000 resistance and it settled above the 100 simple moving average (4-hours).

The pair even climbed above the $59,500 level and spiked above the $60,000 resistance. However, there was no close above the $60,000 level. A high was formed near $60,030 and the price started a fresh decline. It broke the $58,500 and $58,000 support levels.

The price declined below the 23.6% Fib retracement level of the upward move from the $50,465 swing low to $60,030 swing high. There was also a break below a connecting bullish trend line with support near $59,000 on the 4-hours chart of the BTC/USD pair.

Bitcoin Price

Source: BTCUSD on TradingView.com

The pair tested the $56,500 support zone and the 100 simple moving average (4-hours). There is also another bullish trend line forming with support near $56,800 on the same chart.

If there is a downside break below the trend line support, $56,500, and the 100 simple moving average (4-hours), there are chances of a major decline towards $55,250. It is close to the 50% Fib retracement level of the upward move from the $50,465 swing low to $60,030 swing high. Any more losses might call for a test of $53,800.

Fresh Increase in BTC?

If bitcoin stays above the $56,500 support and the 100 simple moving average (4-hours), there are chances of a fresh increase.

The first key resistance is near the $58,000 level. A successful close above the $58,000 level might open the doors for a fresh push toward the main $60,000 resistance zone. The next key barrier sits near $62,000.

Technical indicators

4 hours MACD – The MACD for BTC/USD is gaining momentum in the bearish zone.

4 hours RSI (Relative Strength Index) – The RSI for BTC/USD is now well below the 50 level.

Major Support Level – $56,500

Major Resistance Level – $58,000

Garlinghouse: 1 Bitcoin Transaction Requires 75 Gallons of Gasoline

Ripple CEO Brad Garlinghouse said performing a single Bitcoin transaction requires burning 75 gallons of gasoline. This shocking statistic gives a degree of the scale of Bitcoin’s possible environmental impact.

Bitcoin Gets a Thumbs Down From Environmentalists

It emerged recently that Bitcoin’s annual energy consumption currently matches that of a mid-sized country, with Argentina given as an example.

Garlinghouse said Bitcoin’s proof-of-work consensus model ensures the problem will get worse as the network grows. This is because rising price correlates positively with energy consumption, as more miners join the network to take advantage.

“As the price of Bitcoin goes up the energy consumption and the carbon footprint of a proof-of-work, that mining that happens to validate the transactions, that continues to scale aggressively also. And we can’t lose sight that one Bitcoin transaction is about the equivalent of 75 gallons of gasoline being burned.”

Charles Hoskinson, the CEO of IOHK, said the amount of energy used by the BTC network has gone up more than four times since the peak of the last bull market.

“Bitcoin’s energy consumption has more than quadrupled since the beginning of its last peak in 2017 and it is set to get worse because energy inefficiency is built into bitcoin’s DNA.”

And with the price of Bitcoin predicted to go up further during this bull cycle, future energy consumption will inevitably rise to that of a large country. Estimates put a $100k Bitcoin on par with the energy consumption of France or Germany.

What’s The Solution?

There are no easy answers to this issue. But Garlinghouse suggested users switch to more energy-efficient platforms, such as Ripple and XRP, especially for payment transactions.

“We at Ripple use the XRP Ledger because it’s extremely fast and it’s about one hundred thousand times more energy-efficient than Bitcoin. In that context, it works really well for payments…”

At the same time, Bitcoin advocates say high energy consumption is not a valid argument as most of the energy comes from renewable sources.

Head of Research at CoinShares Christopher Bendiksen states that Bitcoin mining is a mobile affair drawn to unwanted and cheap energy sources. He claims the majority source comes from otherwise underutilized renewables.

“Bitcoin mining is extremely competitive, but even more importantly, mobile, and therefore tends to cluster around the unwanted (read: cheapest) energy sources of the world. These sources happen to be largely composed of stranded or otherwise underutilised renewables, particularly hydro power.”

What’s more, Bendiksen goes as far as to say the electricity cost is worth it for what we get in return – a global apolitical monetary system. Rather than condemn Bitcoin’s energy usage, he argues that Bitcoin mining has an important role to play in improving the renewable grid architecture.

Bitcoin daily chart

Source: BTCUSD on TradingView.com

TA: Why Bitcoin Looks Set For A Massive Bullish Break above $60K

Bitcoin price is consolidating gains above the $58,000 resistance against the US Dollar. BTC is likely to surge above the $59,500 and $60,000 resistance levels in the near term.

  • Bitcoin is showing a lot of bullish signs, but it is still below the $60,000 resistance zone.
  • The price is trading nicely above the $58,000 support and the 100 hourly simple moving average.
  • There is a crucial contracting triangle forming with resistance near $59,200 on the hourly chart of the BTC/USD pair (data feed from Kraken).
  • The pair could start a strong increase once it clears the $59,200 and $59,500 levels.

Bitcoin Price is Likely to Rally Soon

Bitcoin failed to settle above the $59,500 resistance and recently started a downside correction. BTC broke the $59,000 level and it even traded below the $58,500 support.

However, the bulls were active near the $58,000 support and the 100 hourly simple moving average. A low is formed near $57,922 and it seems like the price is trading in a contracting range. It has already recovered above the $58,500 level.

There was a break above the 50% Fib retracement level of the recent decline from the $59,650 high to $57,922 low. Bitcoin is now facing resistance near the $59,200 level.

Bitcoin Price

Source: BTCUSD on TradingView.com

It seems like there is a crucial contracting triangle forming with resistance near $59,200 on the hourly chart of the BTC/USD pair. The triangle resistance is near the 61.8% Fib retracement level of the recent decline from the $59,650 high to $57,922 low.

A successful break above the triangle resistance could open the doors for a massive bullish wave. The next major resistance is near the $59,500 zone, above which the price is likely to rally above $60,000.

Dips Limited in BTC?

If bitcoin fails to climb above $59,200 and $60,000, there could be a downside correction. The first major support on the downside is near the $58,500 level.

The next major support is near the $58,350 level, the 100 hourly SMA, and the triangle trend line. If there is a downside break below the triangle support, the price could dive towards $56,500.

Technical indicators:

Hourly MACD – The MACD is slowly gaining momentum in the bullish zone.

Hourly RSI (Relative Strength Index) – The RSI for BTC/USD is just above the 50 level.

Major Support Levels – $58,500, followed by $58,350.

Major Resistance Levels – $59,200, $59,500 and $60,000.

Mathematical Mystery: Why Did The Bitcoin Rally Stop At The Golden Ratio?

Bitcoin is one of the most interesting and powerful pieces of mathematical code out there, launched as an open source project by the mysterious Satoshi Nakamoto.

In yet another one of the many ways math and mystery come together in relation to the cryptocurrency, its origins, and the underlying technology, the current peak in recent price action also just so happens to taken place perfectly at the golden ratio. But why?

Math, Mystery, And So Much More: Crunching The Cryptocurrency Numbers

Math is one of those love it or hate it subjects in school, but no one can discount just how powerful it is when used effectively. It is by definition “the study of quantity, structure, space, and change.”

When it comes to Bitcoin, math is everywhere around it. The hard-capped “quantity” of BTC will always remain at 21 million, while the “structure” of its code maintains that maximum cap.

Related Reading | Third Time’s The Harm: Trader Warns Of Bitcoin Reversal Pattern

“Space” in this case, isn’t in reference to moonshots, but in the geometric shapes and patterns that appear on Bitcoin price charts, which “change” with each buy or sell order.

Math is integral to quantifying data in fundamental analysis, and measurements go into plotting the lines and averages of technical indicators.

However, there’s no easy way to explain why the cryptocurrency’s recent bull rally, has topped out at a key mathematical area.

bitcoin golden ratio

Why did Bitcoin stop at the golden ratio? | Source: BTCUSD on TradingView.com

Bitcoin Bull Rally Takes Pause At Golden Ratio, But Why?

Strangely, the current high in Bitcoin price is $61,800. At first glance, nothing appears to out of the ordinary about the number. But there very well could be some serious significance that could explain why momentum is beginning to turn around.

The number, now more than three times its 2017 record, just so happens to be 61.8% to the price point most investors are HODLing for, which is $100,000 per coin.

The golden ratio itself is 1.618, with the inverse as 0.618. The number is used in technical analysis as one of the Fibonacci retracement levels with the most significance.

Fib retracement and extensions are measured from lows to highs or vice versa, while in the case of the current rally, price action stopped instead at 61.8% of the way to the speculate target of $100,000.

Related Reading | Heads Up: Bearish Bitcoin Technical Pattern Shouldn’t Be Shrugged Off

It is a theory that cannot be proven, nor is it fully understood why the golden ratio is found so commonly throughout nature and within the price charts of assets like cryptocurencies.

Renowned twentieth-century artists such as Salvador Dalí have included the golden ratio within their works, “believing this to be aesthetically pleasing,” according to Wikipedia.

It also appears in various places within nature, such as within the pattern of leaves, or the spiral of the Nautilus shell. But could it also be the ideal zone for the speculators to begin taking profit before the bull market keeps going?

Featured image from Deposit Photos, Charts from TradingView.com

Bitcoin Closes Best Quarter In History, But A Bearish Signal Lingers

Bitcoin price closed the historically red month of March not only in the green, but with the largest dollar for dollar gain on in the cryptocurrency’s short history.

Unfortunately, despite how strong the ongoing bull trend has been during the first quarter of the year so far, the quarterly candle which ended alongside March, also closed with a massively bearish signal.

Bitcoin Closes Quarterly With Record Gain, But Bearish Signal Couldn’t Be Avoided

Due the fact that both of Bitcoin’s largest bull markets topped as the fourth quarter of each year the concluded, Q1 is one of the worst quarters for the leading cryptocurrency by market cap.

Even in 2020, the quarter ended with a bearish bang, taking Bitcoin back under $4,000 before it was all said and done. This year, March came, but bulls sustained the month in the green, closing out what is now the largest monthly candle in terms of total dollars moved.

Related Reading | Heads Up: Bearish BTCUSD Technical Pattern Shouldn’t Be Shrugged Off

The quarterly candle climbed double during the month, adding more than $28,000 per coin to the trending cryptocurrency’s price tag. Despite the enormous move, Bitcoin would have had to pump more than $20,000 to $30,000 more to avoid the first ever bearish divergence on the quarterly RSI.

Bitcoin btcusd quarterly bearish divergence

The quarterly Bitcoin candle closed with the largest gain ever, but left a bearish divergence behind | Source: BTCUSD on TradingView.com

Relative Strength Index Forewarns of Bearish Second Quarter of 2021, Before Bull Trend Resumes

According to the Relative Strength Index, a trend strength measuring gauge, the current trend is less strong than the buying momentum that took Bitcoin to $20,000 the first time – even though it is currently trading at three times that.

A bearish divergence appears when price action and technical indicators move in the opposite manner, revealing weakness in price action.

The current bull market peak is set at $61,800, and if the bearish divergence confirms, things could turn down for some time. The raging bull cryptocurrency, however, has shaken off nearly every bearish signal since Q4 of last year when the initial breakout took place.

Related Reading | Third Time’s The Harm: Trader Warns Of Bitcoin Reversal Pattern

A correction at current levels would likely be healthy for Bitcoin, bringing more interest and demand to the market with more supply to be bought overall.

Bitcoin has never closed more than five consecutive quarterly candles green, however, and the most recent close was its fourth. If the current quarterly candle closes green, chances are the top in Bitcoin could be in.

If things close red, however, the bull run might have another full year left of upward trajectory, once any short-term correction is out of the way.

Featured image from Deposit Photos, Charts from TradingView.com

TA: Why Bitcoin Breaking This Resistance Could Spark a Significant Surge

Bitcoin price is trading in a bullish zone above $57,600 against the US Dollar. BTC is likely to accelerate higher once it clears the $59,800 and $60,000 resistance levels.

  • Bitcoin is trading in a positive zone, but it is facing hurdles near $60,000.
  • The price is now well above the $58,000 support and the 100 hourly simple moving average.
  • There is a major bullish trend line forming with support near $57,800 on the hourly chart of the BTC/USD pair (data feed from Kraken).
  • The pair could start a sharp rally if it clears the $59,800 and $60,000 resistance levels.

Bitcoin Price is Showing Positive Signs

Bitcoin mostly traded in a positive zone above the $57,000 pivot level. BTC extended its upward move above the $59,500 resistance level and it settled nicely above the 100 hourly simple moving average.

However, the bulls faced a strong resistance near the $59,800 and $60,000 resistance levels. A high was formed near $59,829 before there was a downside correction. The price declined below the $59,000 and $58,000 levels.

There was also a spike below the $57,500 level, but the bulls protected the 100 hourly simple moving average. A low is formed near the $56,800 level and the price is now back above $58,000. The bulls pushed bitcoin above the 50% Fib retracement level of the downward move from the $59,829 high to $56,800 low.

Bitcoin Price

Source: BTCUSD on TradingView.com

It is currently trading well above the $58,000 support and the 100 hourly simple moving average. There is also a major bullish trend line forming with support near $57,800 on the hourly chart of the BTC/USD pair.

Bitcoin seems to be consolidating just above the 76.4% Fib retracement level of the downward move from the $59,829 high to $56,800 low. The key hurdle is near the $59,800 and $60,000 levels. A successful close above the $60,000 level will most likely pump the price towards the $62,000 level in the coming sessions.

Dips Supported in BTC?

If bitcoin fails to climb above $59,800 and $60,000, there could be a downside correction. The first major support on the downside is near the $58,400 level.

The next major support is near the $58,000 level, the 100 hourly SMA, and the trend line. If there is a downside break below the trend line, the price could revisit $56,800.

Technical indicators:

Hourly MACD – The MACD is now gaining momentum in the bullish zone.

Hourly RSI (Relative Strength Index) – The RSI for BTC/USD is well above the 50 level.

Major Support Levels – $58,500, followed by $58,000.

Major Resistance Levels – $59,800, $60,000 and $60,800.

Go Phish: How This Bitcoin Investor Lost 17 BTC To An iPhone App

Bitcoin is once again making headlines everywhere, mostly for all the right reasons this time around. However, where there’s money to be made, there’s also scammers waiting in the shadows to steal funds whenever they can.

The latest situation involves a highly sophisticated replica of a popular Apple iPhone app, a malicious application from Apple’s App Store, and a now stolen 17 BTC.

Bitcoin Investor Has Half A Million Dollars Worth Of BTC Stolen

During the height of the 2017 bull market, one of the symbols that cryptocurrencies had “made it” was when Coinbase had been topping the Apple App Store for iOS devices for days on end. Investors were flocking to the platform in droves as Bitcoin FOMO took over.

These days, there’s much more variety out there, including more ways to buy or store cryptocurrencies beyond just Coinbase alone. The platform remains the most popular out there, set to go public within the next year or so.

Related Reading | Bitcoin Searches Spike On Google After Twitter Scam Goes Viral

Investors can also store their coins in third-party wallets, or use an app interface to interact with their hardware wallets, like Ledger or Trezor.

That’s exactly what Phillipe Christodoulou meant to do, but instead lost a staggering 17.1 BTC – worth over a half a million dollars – in a phishing scam.

bitcoin phishing 17 btc

The more expensive Bitcoin gets, the more scammers it attracts | Source: BTCUSD on TradingView.com

Beware Of Phishing Scams In Apple App Store, Social Media, And Elsewhere

Christodoulou downloaded a highly rated, five-star app from Apple’s App Store, the company’s flagship and regularly quality-controlled platform. Apple maintains certain standards, and works to prevent situations like this from happening.

But then why did it? Christodoulou is furious with the company and rightfully so. He is also demanding answers and justice.

“They betrayed the trust that I had in them,” he told The Washington Post. “Apple doesn’t deserve to get away with this.”

Scammers regularly pull this tactic with Apple’s App Store, and unfortunately, this application somehow snuck through. The app was posing as a Trezor app, bearing the company’s logo and all.

Related Reading | The Most Common Bitcoin Scams And How To Avoid Them

But after loading it with his life-savings, it wasn’t until later he had realized what had unfolded. The app was a phishing app, and now his 17.1 BTC are in the hands of a scammer.

Scams like this are unfortunately common wherever users aggregate and offer a back door to crypto assets. Even real, verified apps or in other situations, social media accounts, can still get hacked and result in a loss of coins.

It’s also important to always keep legitimate apps or wallets fully up to date, to avoid any loop holes or security vulnerabilities that have since been fixed, but must be installed through user intervention.

Featured Image From Deposit Photos, Charts From TradingView.com