Dogecoin Usurped: These Memecoins Overtake DOGE In Active Trader Count

On-chain data suggests Dogecoin is no longer the dominant meme coin in terms of its weekly active trader count. Here are the coins above it.

Dogecoin Has Been Surpassed In Trader Count By Other Memecoins

According to data from the market intelligence platform IntoTheBlock, DOG and DEGEN are the two assets that have managed to surpass the original meme-based cryptocurrency in terms of weekly trader count.

A “trader” here refers to an investor who has been holding onto their coins since less than 30 days ago. These investors generally tend to move their coins often, as they play the role of active traders in the market. They are certainly not the HODLers of the sector.

When the number of these traders goes up for any asset, it means that some fresh interest is potentially coming into the coin. Price actions like rallies are only sustainable when they have an ever-increasing fuel coming in, so the trader count going up can perhaps be a bullish indication in this direction.

On the other hand, the metric going down implies traders either are losing interest in the cryptocurrency or have decided to hold onto it in the long term, thus maturing past the 30-day threshold. Whatever the case be, though, a drawdown in the indicator does suggest a lack of new hands coming into the market.

Now, here is a chart that shows the trend in the number of traders for the various meme coins in the sector:

Dogecoin Number of Traders

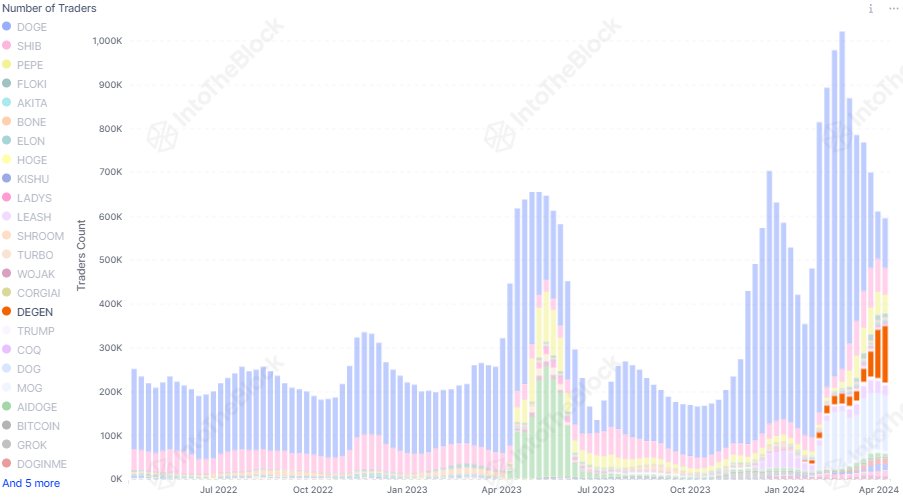
As displayed in the chart, Dogecoin (in blue) has consistently remained number one in terms of the number of traders, which only makes sense as DOGE has generally been the most popular meme coin, as its market cap would indicate.

Hype and excitement are usually the number one driver for attracting users to a cryptocurrency. It would appear, though, that DOGE has recently been falling off in this metric.

“While DOGE has long dominated almost every metric in the memecoin market, it seems to be losing some of its dominance,” says the analytics firm. The interest behind the coin may thus not be at the same level anymore.

As for which meme coins have overtaken the cryptocurrency so far, IntoTheBlock notes, “DEGEN currently leads with 129k active traders, followed by DOG with 126k.”

Given this high interest in these memecoins, it’s possible they may be likely to go through some volatility in the near future as all these traders make moves at once.

In theory, this volatility can take these coins in either direction, but as the intelligence platform explains, “a strong increase in traders usually coincides with bullish momentum.”

DOGE Price

Dogecoin had slipped below the $0.17 level last week, but the coin has since bounced back as it’s now trading just under $0.20.

Dogecoin Price Chart

Traders Not Showing Dogecoin FOMO, Good Sign For Rally?

On-chain data suggests traders haven’t been showing FOMO towards Dogecoin despite the latest rally, a sign that could be positive for its continuation.

Dogecoin Total Amount Of Holders Has Remained Flat Recently

According to data from the on-chain analytics firm Santiment, FOMO, which would normally be associated with tops, has been absent from the Dogecoin market recently.

The indicator of relevance here is the “Total Amount of Holders,” which, as its name suggests, keeps track of the total number of DOGE addresses that are carrying a non-zero balance right now.

When the value of this metric goes up, it can be because of a number of reasons. A major one would naturally be fresh adoption, as new investors coming into the sector would open up new addresses and add balance to them, thus raising the indicator’s value.

Other reasons can include existing users reconsolidating their holdings among multiple addresses (usually for a purpose like privacy) or old investors coming back to reinvest in the meme coin.

In general, whenever the metric shows this kind of trend, it means that some net adoption of the asset is taking place, which can be a positive sign in the long term.

On the other hand, a decline in the indicator implies some holders may have decided to exit from the cryptocurrency as they have completely cleared out their addresses.

Now, here is a chart that shows the trend in the Dogecoin Total Amount of Holders over the last few months:

Dogecoin Total Amount of Holders

As displayed in the above graph, the ‘Total Amount of Holders’ for Dogecoin has been flat for many weeks now, implying that the adoption of the meme coin has hit the brakes.

Interestingly, this sideways trajectory has come despite the fact that DOGE’s price has gone through some volatile price action during this period. Generally, events like rallies are attractive to traders, so a notable amount of them tend to jump into the asset during them.

It would appear that the traders have either not been paying attention to the recent DOGE rally or just not taking it seriously. In the past couple of weeks, the ‘Total Amount of Holders’ for the meme coin has gone up by only 0.21%, despite the fact that the price has rallied more than 40% in the same window.

Historically, when a large number of traders join the blockchain at once during price surges, it’s a sign that FOMO around the asset is spreading. Usually, the meme coin’s price tends to go against the expectations of the majority, so when there is widespread FOMO, a top can become likely to take place.

As there hasn’t been any such FOMO for Dogecoin recently, it’s possible that it could be a positive sign for the rally’s continuation. There is also another signal brewing, however, that may not be so constructive.

From the chart, it’s visible that the Mean Dollar Invested Age, a metric that keeps track of the average age of DOGE investments, has plunged recently, implying that the experienced hands have been on the move. When this signal formed earlier in the year, the coin’s price approached the top not too long after.

DOGE Price

Dogecoin had surpassed the $0.22 level earlier, but it seems the asset has gone through some drawdown as it’s now back under $0.21.

Dogecoin Price Chart