Bitcoin Pullback Has Ended? Analyst Declares “Worst Is Over”

After a stunning retrace, Bitcoin witnessed a notable recovery as Wednesday closes rising from the $61,000 price mark to $67,000, triggering hopes within the cryptocurrency community that a bullish movement might be imminent. However, the crypto asset has not exactly returned to the point it was a week ago, especially since BTC reached a new all-time high last week when it surged beyond $73,000.

Bitcoin Correction Has Bottomed Out

With Bitcoin surpassing its previous all-time high and rising even further to set a new peak of $73,000, March has been a momentous month for the cryptocurrency. And following the recent recovery, several cryptocurrency experts and traders believe that the recent price correction has reached rock bottom.

Crypto analyst and enthusiast, Crypto Jelle has offered a positive prediction regarding the price action of Bitcoin and its potential to move upward. His analysis delves into the current state of BTC’s price and the possibility of the retracement coming to an end.

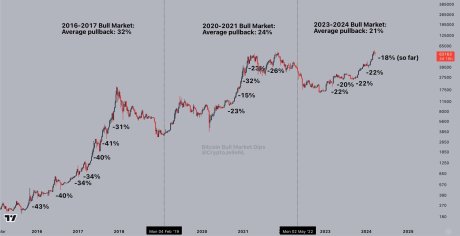
According to Crypto Jelle, the average correction in “this bull market is almost 20%.” Meanwhile, the pullback is “roughly 18% deep” presently. As a result, Jelle believes that “we have most likely witnessed the worst of the drop,” suggesting that the price might be ready to undergo full recovery. 

Bitcoin

Jelle claims that the fall “should be bottoming out” any moment from now. However, this might not be happening soon, since “these things take time to form,” urging the crypto community not to rush it.

The post read:

The average pullback in this bull market is almost 20%. Since the current downturn is just about 18% deep, the worst is most likely behind us. Although these things take time to form, the bottom should be close. Do not rust it.

In another X post, Crypto Jelle noted that the market has once again begun to “display signs of a local bottom.” Due to this, the largest cryptocurrency asset by market cap still has “work to do.”

Crypto Jelle anticipates Bitcoin to hold above the $65,300 threshold, in order for the price to “regain that 2021 bull cycle peak.” Additionally, when his forecast takes place, he believes that prices “will be off” in the upward direction in no time.

Amount Of BTC To Buy Using DCA Strategy

As Bitcoin continues to struggle, crypto analyst Ali Martinez has underlined the amount of BTC to purchase within specific price levels using the Dollar-Cost Averaging (DCA) strategy.

According to Martinez, when BTC is within the range of $65,130, $64,130, $63,130, and $62,130, investors should buy 0.5 BTC. Meanwhile, at the $61,130, $60,130, $59,130, and $58,130 levels, investors should acquire about 0.65 BTC.

Furthermore, around $57,130, $56,130, $55,130, and $54,130, Martinez advocates the acquisition of 0.8 BTC. Lastly, a portion of 0.95 BTC should be purchased around $53,130, $52,130, $51,130, and $50,130.

At the time of writing, Bitcoin was trading at $67,299 on the daily timeframe, indicating an increase of over 4%. Its market cap has risen by 4.97% in the past day, while its trading volume is down by over 12%.

Bitcoin

Bullish AF: Bitcoin At $42K, Comparing Today’s Leverage With That Of February

Bitcoin reached $42K before, but not with these characteristics. The market seems healthy and practically unleveraged. Greed is just showing its face after months of Fear. How did we get here? Calmly and consistently stacking sats, that’s how. What does this mean for the future of BTC’s price? Is the rocket about to take off?

Related Reading | Volatility Inbound: Bitcoin Traders are Upping Their Leverage as Election Nears

Before going into that, let’s look at the chart from Bitcoin Magazine’s Dylan LeClair. It gives the US Central Bank balance sheet a run for its money as the most bullish Bitcoin chart.

Leverage the first time we hit 42k $BTC in February compared to now.

This is all spot driven. pic.twitter.com/QjtJ0zWSgj

— 🟠Dylan LeClair🟠 (@BTCization) August 6, 2021

The difference is astonishing. In February, Bitcoin got here by borrowing money from exchanges. The futures market was on fire and growing. The bloodbath was a month away.  Nowadays, leverage is just raising its head after a few months in the red. The casino is almost empty. Real money drove the climb back from hell. Gradually, step by step.

Does this mean we’re up for a sudden blast into space?

BTC price chart for 08/07/2021 on Bitstamp | Source: BTC/USD on TradingView.com
If Not From Leverage, Where Is The Money Coming From?

Some institutions are probably buying. Chances are we’ll see Bitcoin holdings declared next quarter. However, according to on-chain analyst Will Clemente, there’s evidence that real, everyday people, are constantly joining the network. And those new Bitcoiners are joining an army of believers that never stop buying.

Bitcoin’s Gini coefficient is getting healthier and healthier. According to William Clemente, when you filter out ETFs and Grayscale, on-chain analytics show that “over time whales are just distributing their coins.” According to him, entities with less than 10 BTC never stop buying. “Since May 19th, retail has been accumulating more heavily than the whales have.” Each day that passes, Bitcoin’s “healthy distribution of the network” gets better and better.

The Dollar-Cost Averaging investment strategy is gaining traction among a sector of the population. And it seems to be spreading. Investopedia defines DCA as:

An investment strategy in which an investor divides up the total amount to be invested across periodic purchases of a target asset in an effort to reduce the impact of volatility on the overall purchase. The purchases occur regardless of the asset’s price and at regular intervals. In effect, this strategy removes much of the detailed work of attempting to time the market in order to make purchases of equities at the best prices. 

Related Reading | The One Line In Bitcoin Everyone In Crypto Is Watching

What Will Happen When Leverage Comes Back Into The Picture?

If greed is returning and leverage is available, people will use it. What will happen then? Go back to LeClair’s chart and check out October 2020, the last time that the leverage was in the red. Could we be entering a run the size of what followed that? The chart that this pseudonymous analyst presents suggest that.

#Bitcoin weekly candles are sized similar to the run from 11k to 19.5k.

19.5k is where we had serious resistance for few weeks (as now with 42k). Then it was off to the races and the price tripled.

Tripling from here is 120k. pic.twitter.com/1gBFbM00MX

— Kevin ₿ebee (@kevinbebee) August 6, 2021

We might be at the cusp of a historical moment. The indicators and characteristics seem healthy and ready for blast-off. The community’s morale is high despite the regulatory threats of late. If all of these analysts are right… we’ll see you on the moon, bulls!

Featured Image by Comfreak from Pixabay – Charts by TradingView