Polkadot (DOT) is correcting gains from the $7.5 resistance against the US Dollar. The price could start another increase if it stays above the $6.75 support.
- DOT gained pace and tested the $7.5 resistance level against the US Dollar.
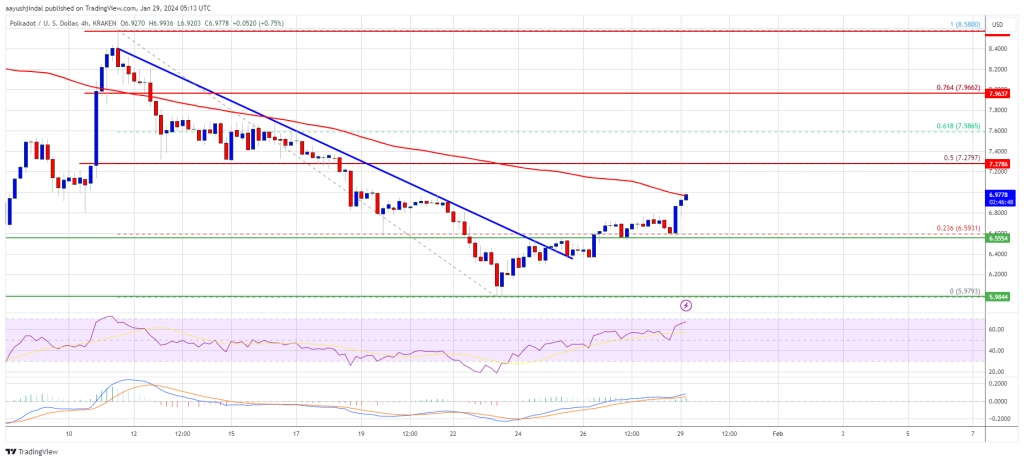
- The price is trading above the $7.00 zone and the 100 simple moving average (4 hours).
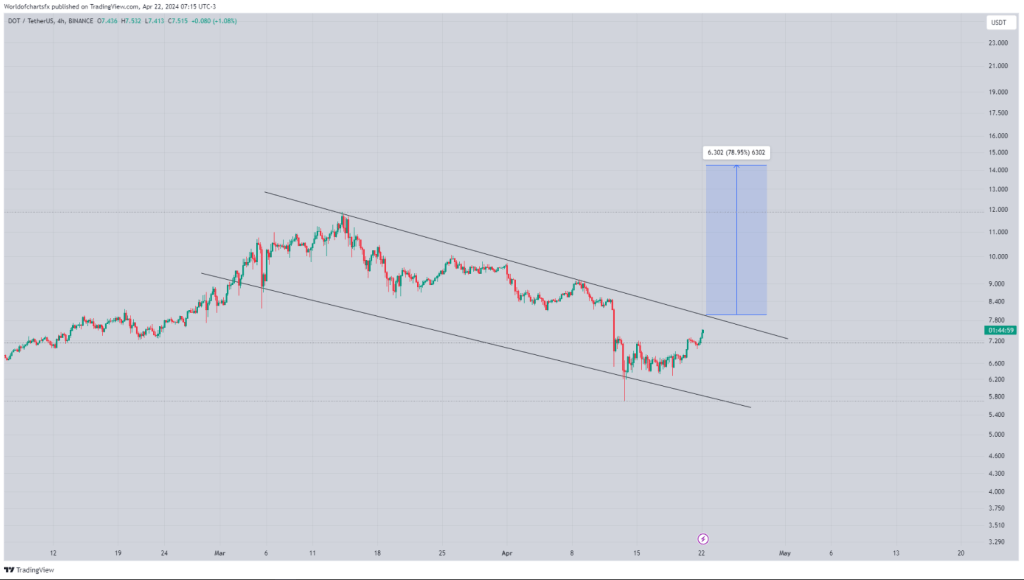
- There is a short-term expanding triangle forming with resistance at $7.50 on the 4-hour chart of the DOT/USD pair (data source from Kraken).
- The pair could continue to decline if it fails to stay above the $6.75 support.
Polkadot Price Holds Support
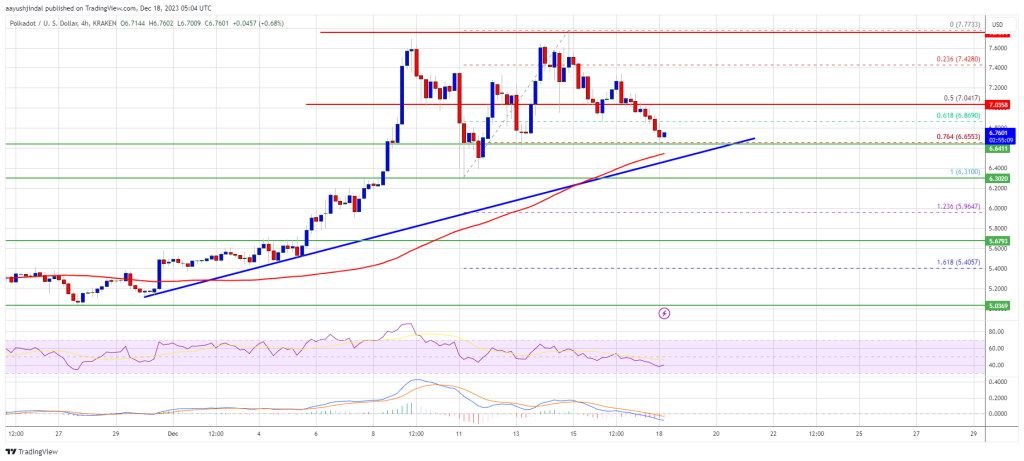
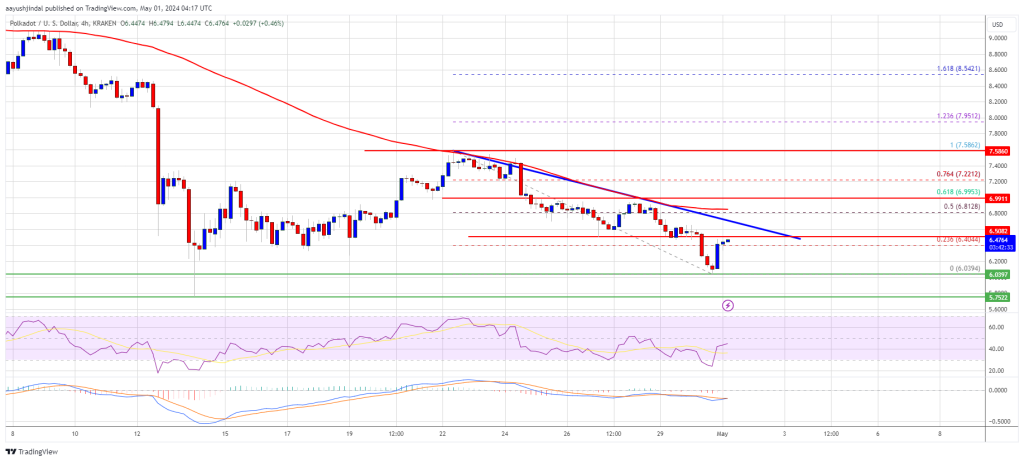
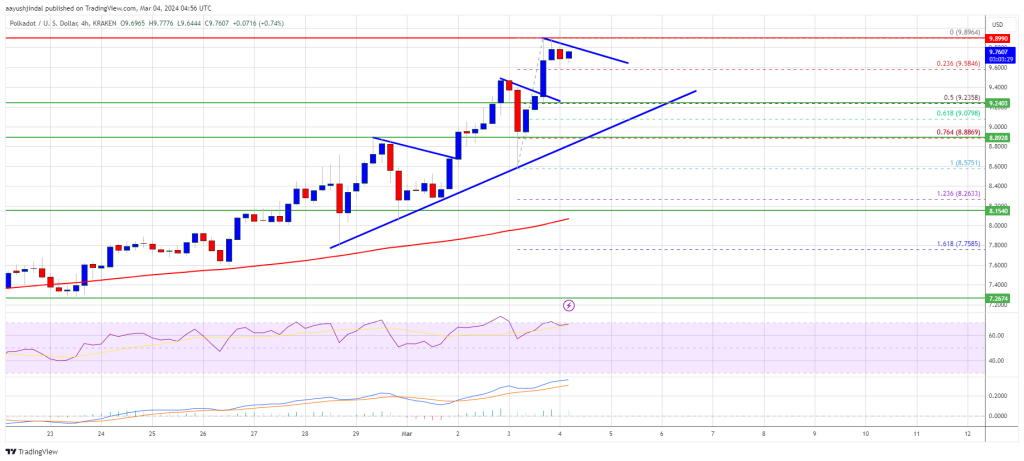
After forming a base above the $6.00 level, DOT price started a decent increase. It broke many hurdles near $6.75 and even spiked above $7.25. A high was formed at $7.46 and the price is now correcting gains, like Ethereum and Bitcoin.
There was a move below the $7.25 support zone. The price declined below the 23.6% Fib retracement level of the upward move from the $6.03 swing low to the $7.46 high.
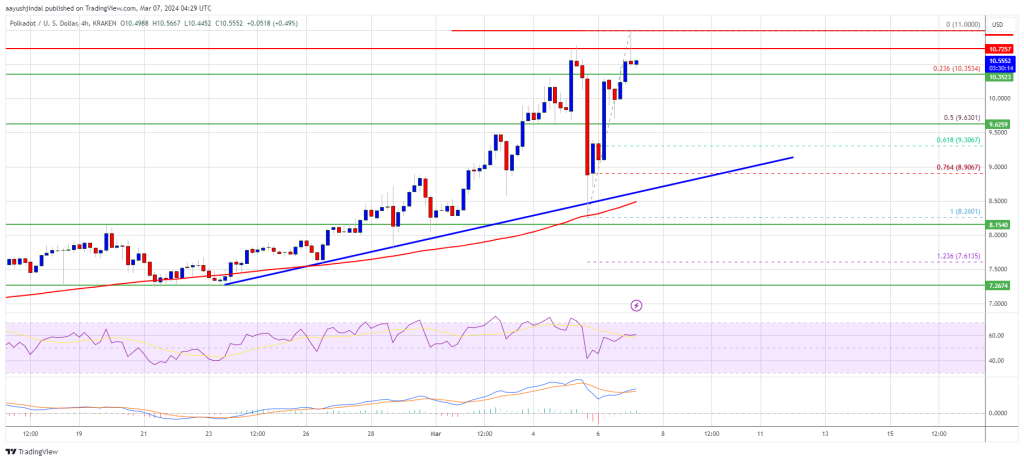
DOT is now trading above the $7.00 zone and the 100 simple moving average (4 hours). Immediate resistance is near the $7.25 level. The next major resistance is near $7.50. There is also a short-term expanding triangle forming with resistance at $7.50 on the 4-hour chart of the DOT/USD pair.
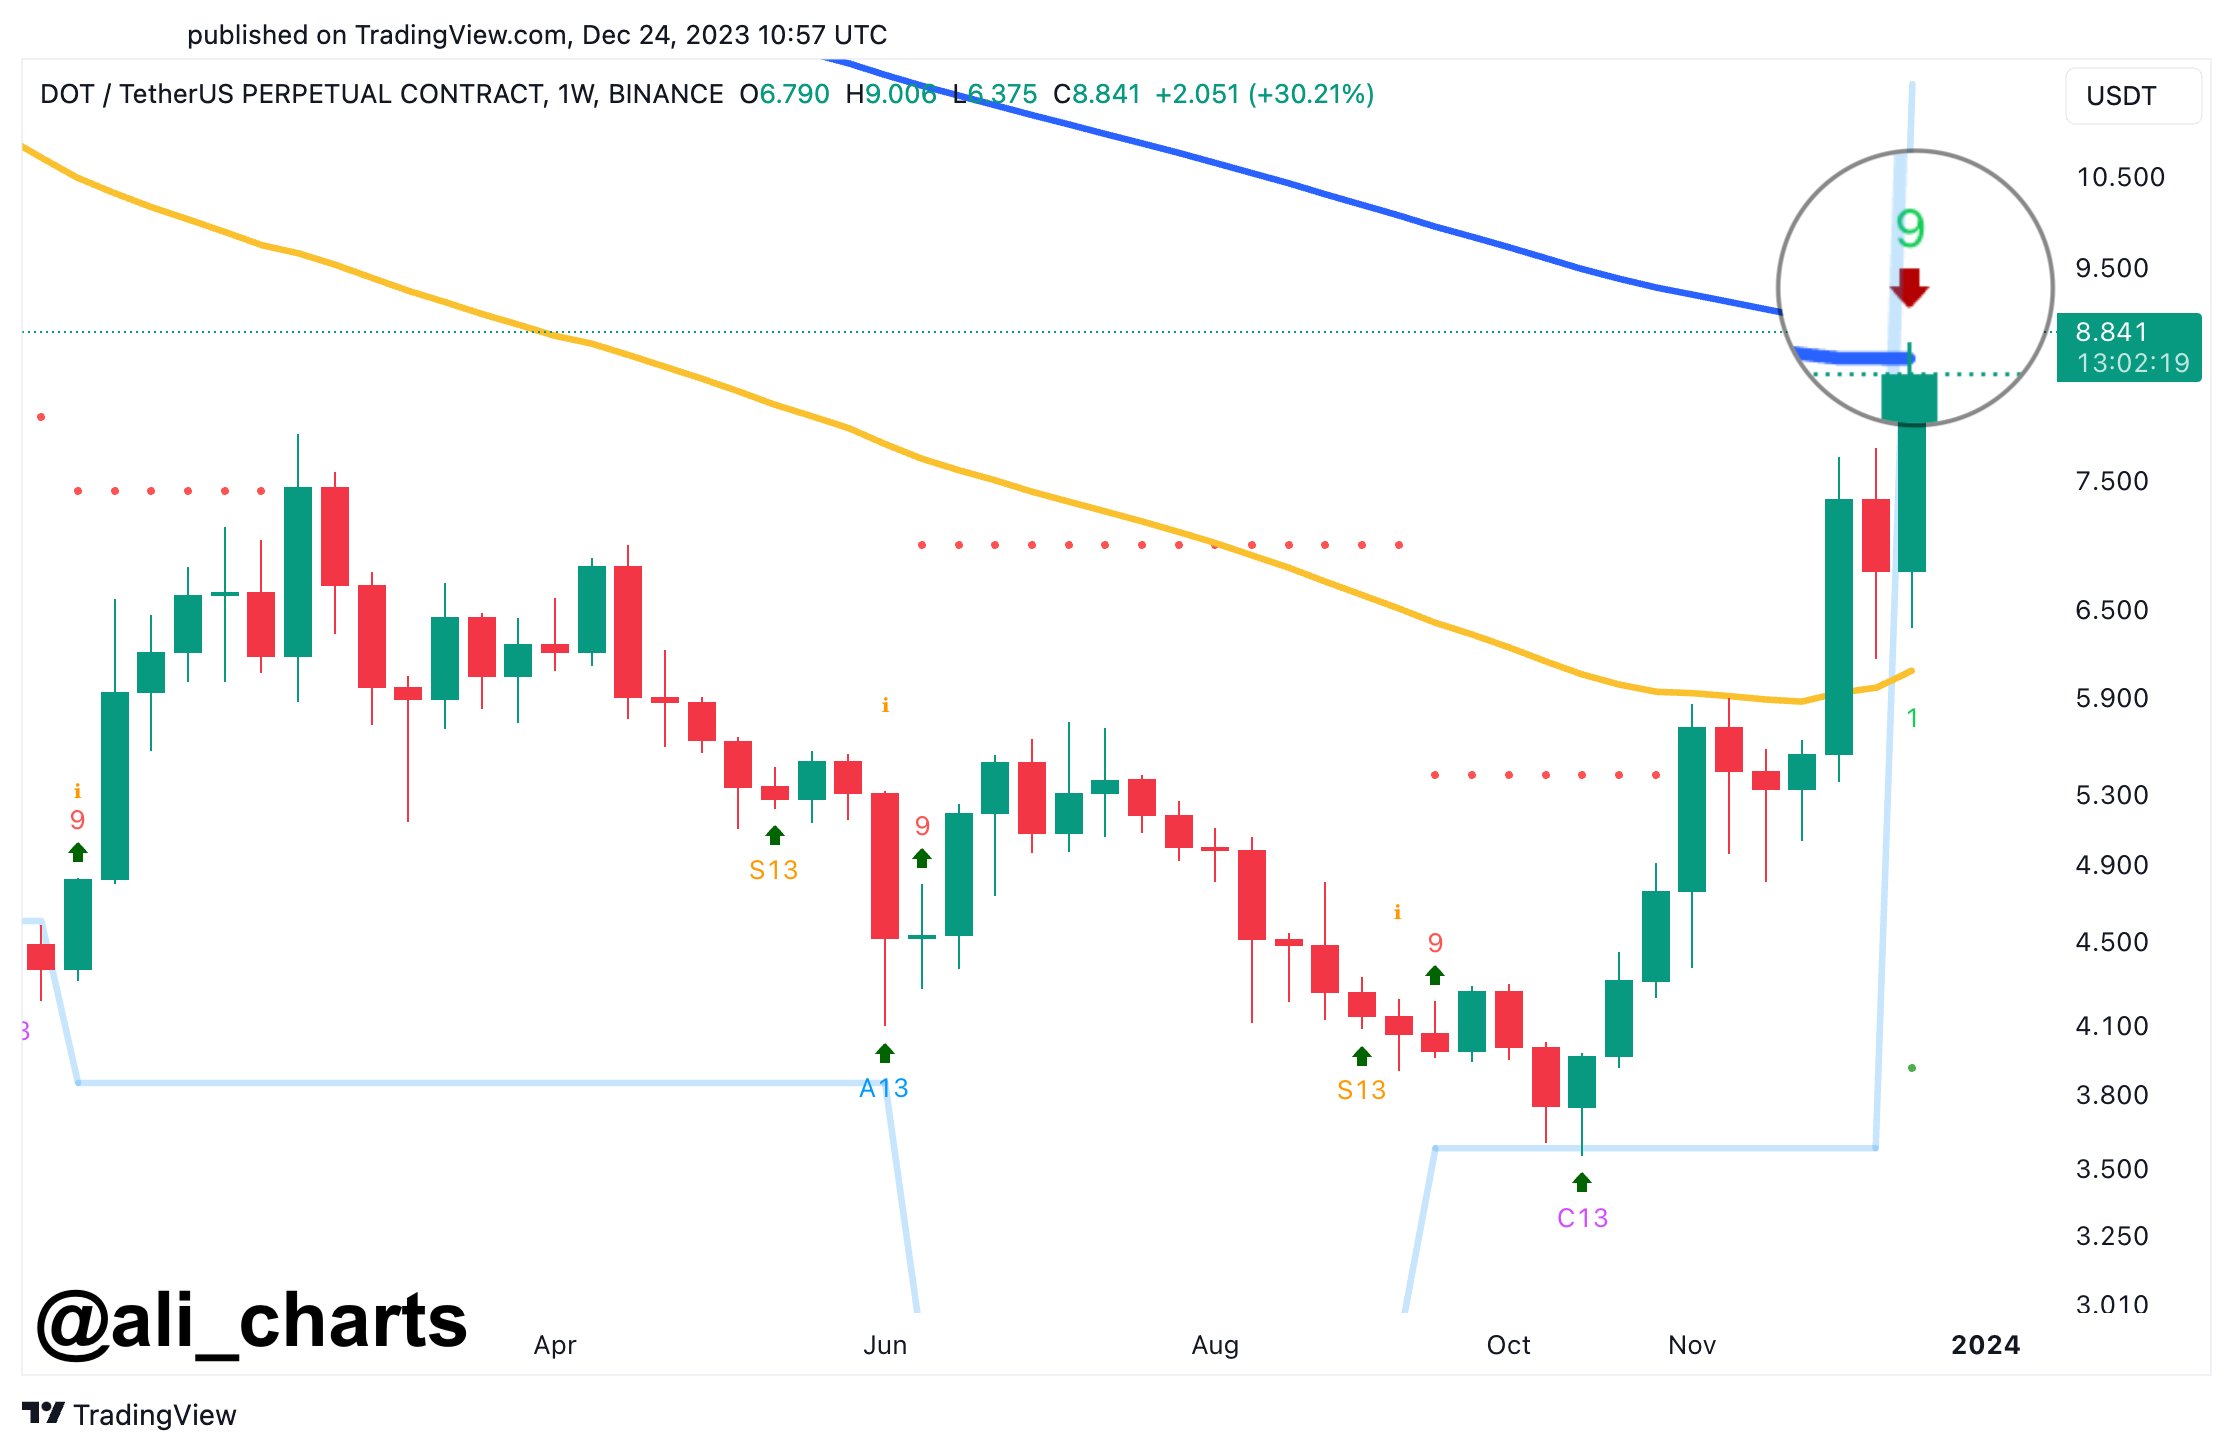
Source: DOTUSD on TradingView.com
A successful break above $7.50 could start another strong rally. In the stated case, the price could easily rally toward $8.00 in the near term. The next major resistance is seen near the $8.80 zone.
More Downsides in DOT?
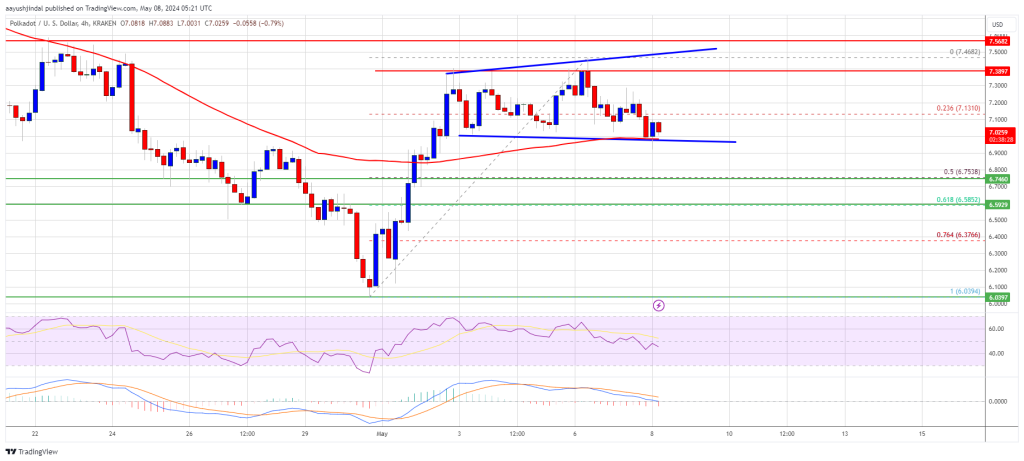
If DOT price fails to start a fresh increase above $7.25, it could continue to move down. The first key support is near the $7.00 level and the 100 simple moving average (4 hours).
The next major support is near the $6.75 level or the 50% Fib retracement level of the upward move from the $6.03 swing low to the $7.46 high, below which the price might decline to $6.50. Any more losses may perhaps open the doors for a move toward the $6.10 support zone or $6.00.
Technical Indicators
4-Hours MACD – The MACD for DOT/USD is now losing momentum in the bearish zone.
4-Hours RSI (Relative Strength Index) – The RSI for DOT/USD is now below the 50 level.
Major Support Levels – $7.00, $6.75 and $6.50.
Major Resistance Levels – $7.25, $7.50, and $8.00.
 Witness the economic prowess of the blockchain world
 Delve into the top blockchains by revenue rate in the past 7 days—unveiling the financial leaders shaping the decentralized landscape
 In the last 7 days,