Analyst Thinks DOT Will Reclaim Former Glory With Polkadot 2.0

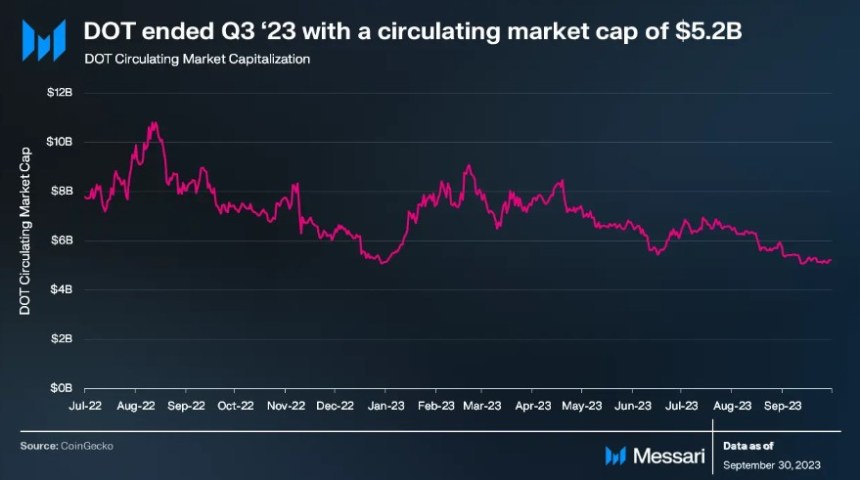
DOT, the native currency of Polkadot, a smart contract platform, remains under pressure, posting sharp losses after soaring to an all-time high of around $55 in 2021. The coin is trading at about $6, volatile but up roughly 45% from 2022 lows, buoyed by the broader recovery across the crypto scene.

Will DOT Break Above Immediate Resistance Levels?

Despite DOT’s woes, one crypto trader, @Ashcryptoreal, is bullish on the coin’s prospects, pointing to the eventual implementation of Polkadot 2.0, a critical update for the cross-chain network. Taking to X on November 27, the crypto trader believes that Polkadot 2.0 will fix present issues plaguing the smart contract platform. 

Specifically, Polkadot 2.0 represents an overhaul set to introduce several enhancements that could, if executed as stated, propel DOT above current resistance levels. With rising DOT demand, the coin, and by extension, the platform, could soar, rising to its former glory as one of the leading blockchains with dense user activity. 

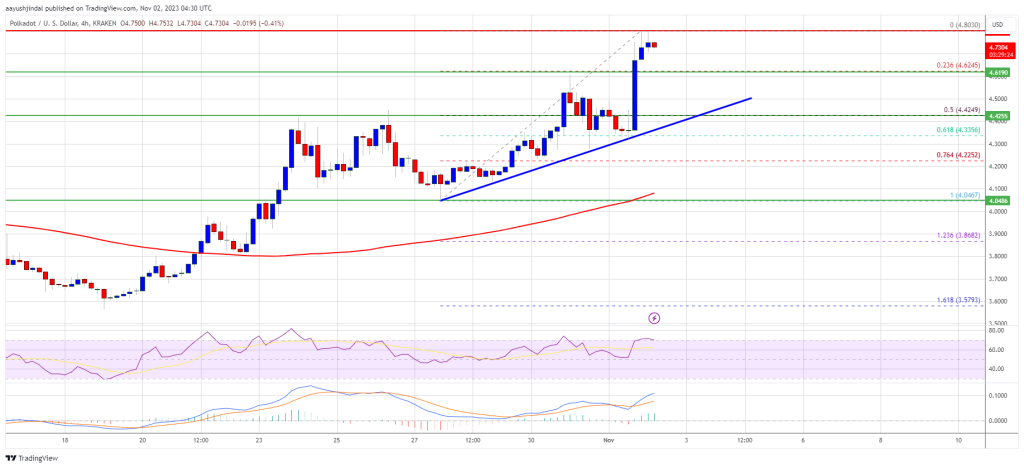
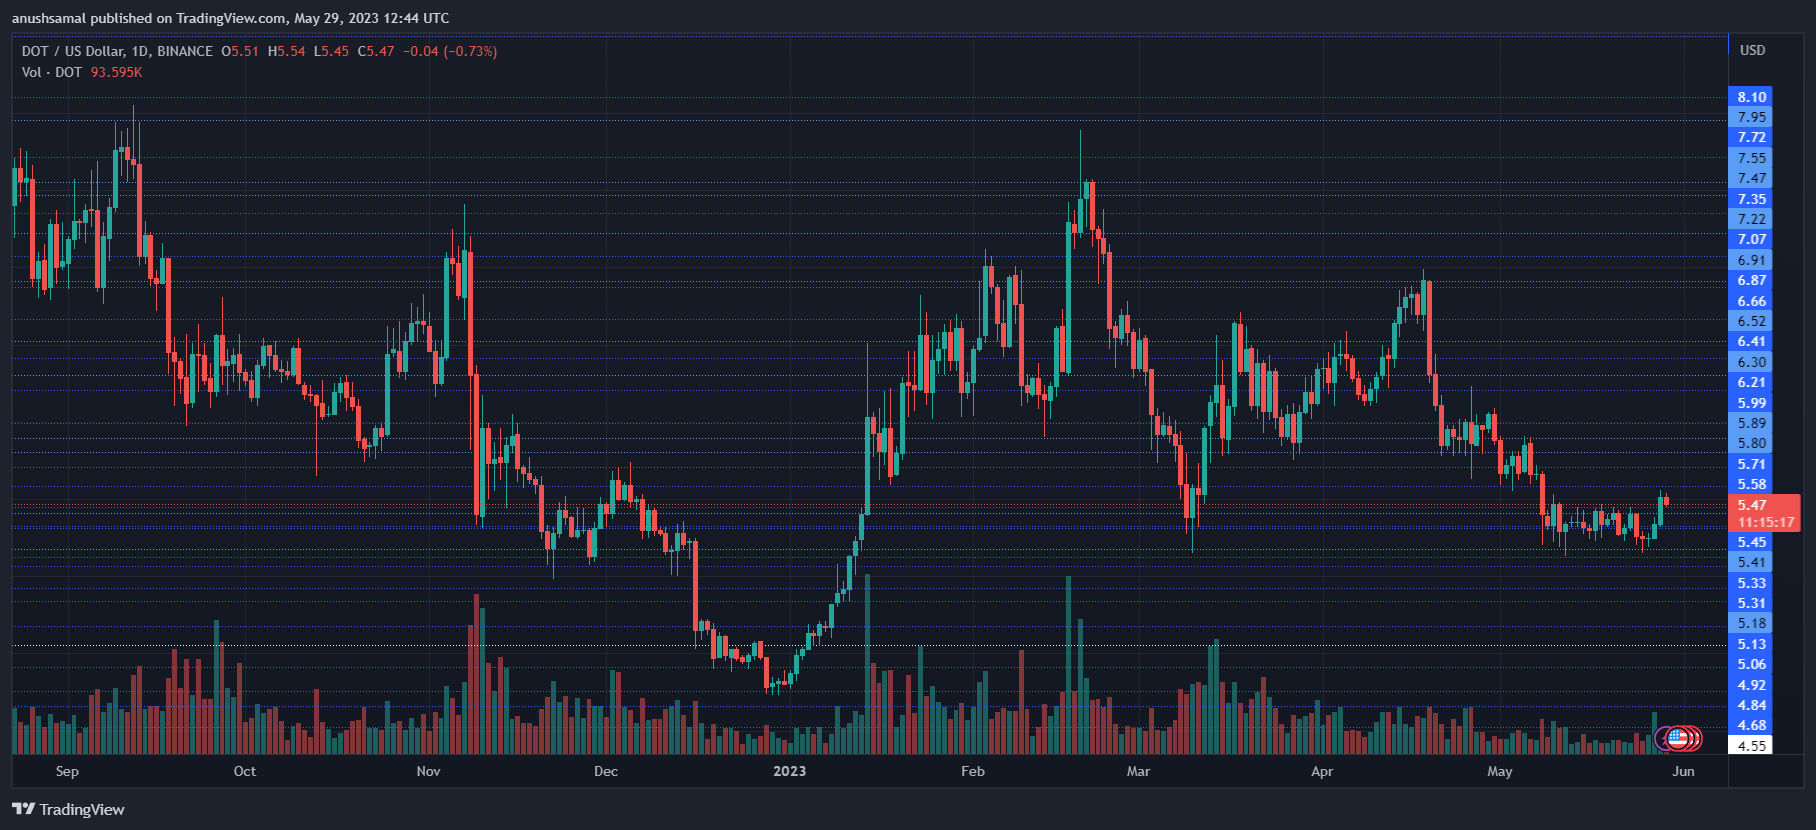
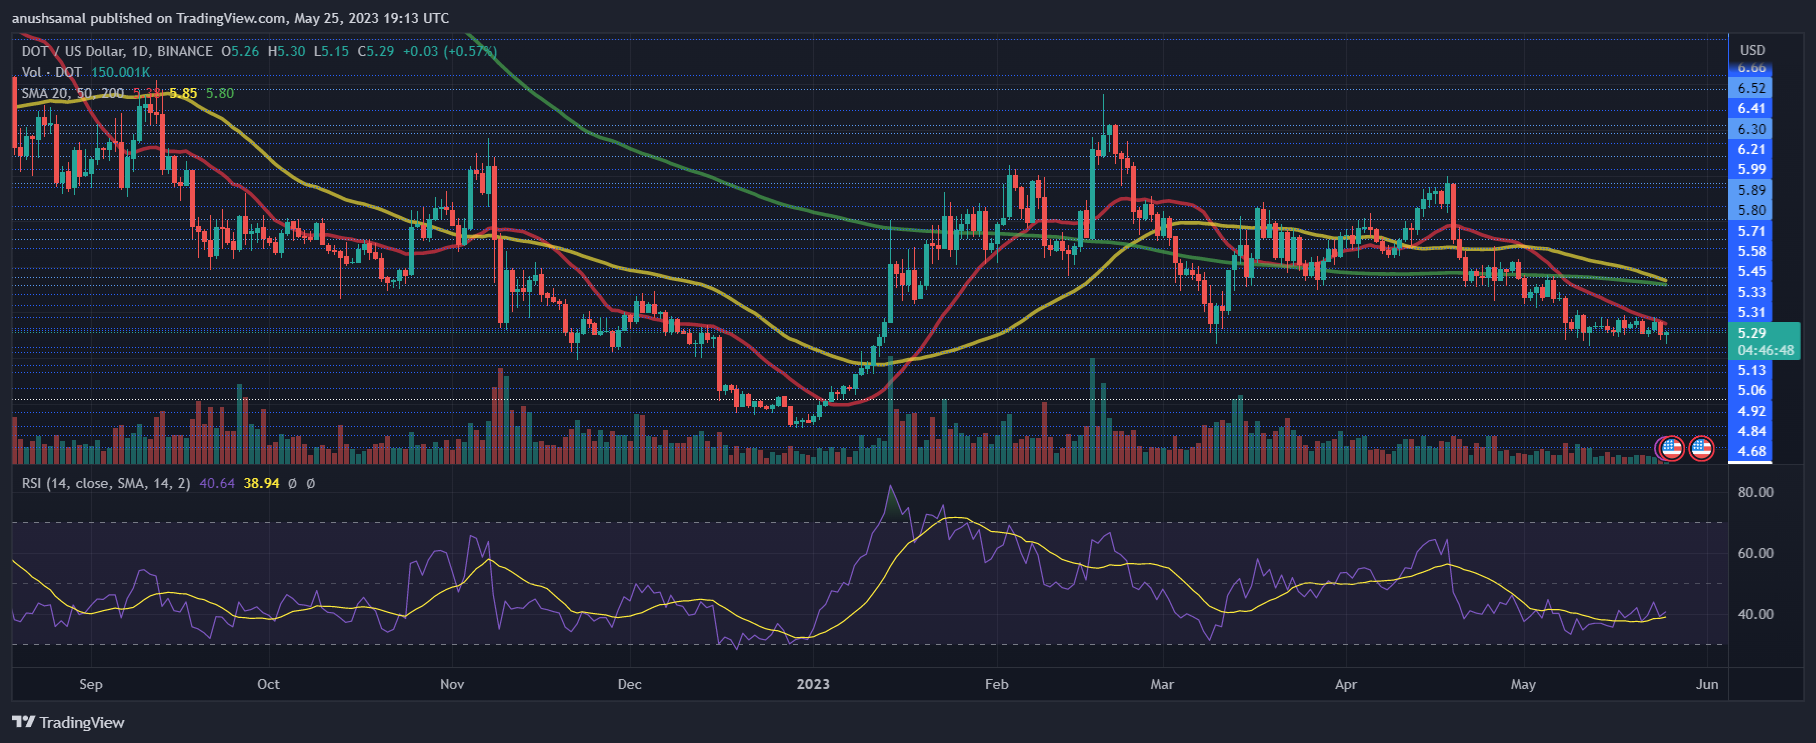
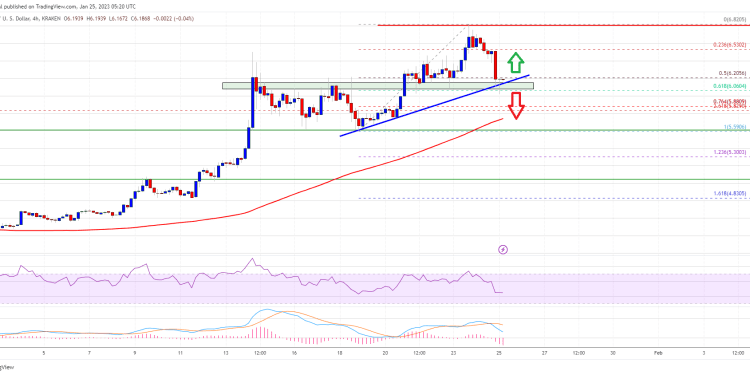
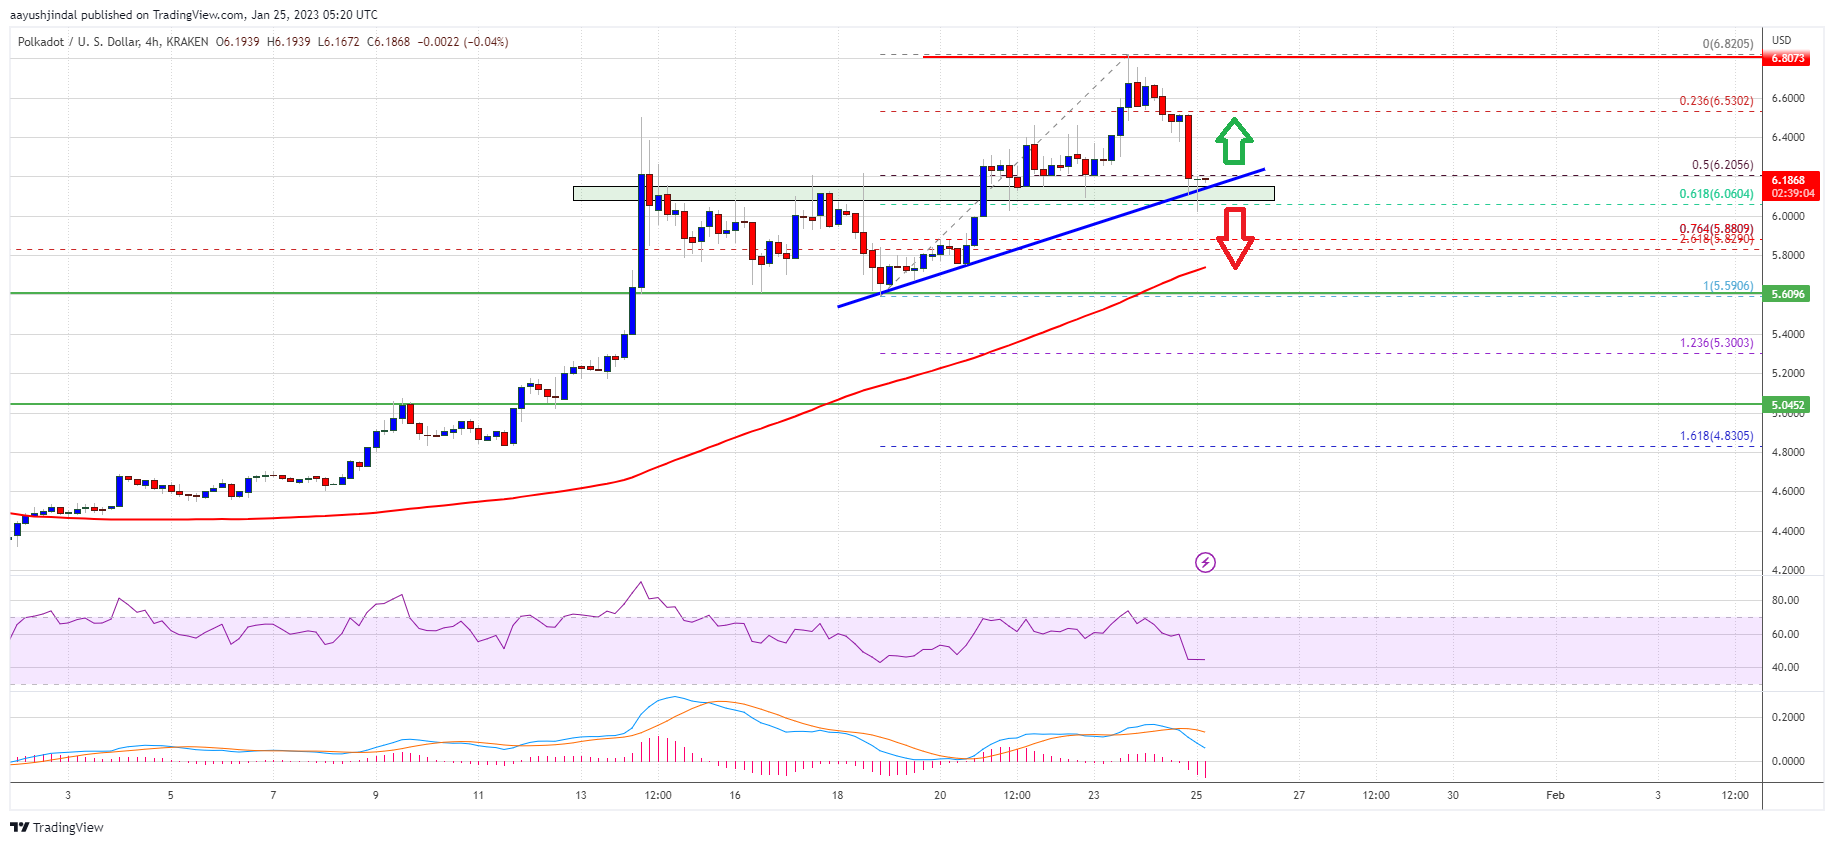
Looking at price action, DOT is moving within a broad horizontal range with caps at around $3.5 and $7.5. Despite the recent spike, which saw the coin roar by 45%, prices are moving inside the bull bar of early November. 

Polkadot price trending upward on the weekly chart | Source: DOTUSDT on Binance, TradingView

Based on this, there must be a sharp expansion from spot levels above $5.6 with rising trading volumes for buyers to be in charge. Even so, the current formation still favors buyers.

What’s The Big Deal About Polkadot 2.0

Polkadot 2.0 overhauls certain features as it is currently in the network. However, most importantly, analysts observe that proposed changes could enhance the network’s capabilities and attract more developers. 

After the update, Polkadot will migrate from the dynamic block space allocation system, allowing developers to purchase block space as needed, either in bulk or individually. This flexibility could make the network more appealing to various projects.

Additionally, Polkadot 2.0 will introduce elastic cores, enabling the network to adapt to varying computing demands depending on use. This adaptability may make the network more efficient. Moreover, it adapts to the diverse needs of developers.

The concept of coretime, which measures computing resource demands, will be a notable addition to Polkadot 2.0. Like in EOS, resources in “core time” will be purchased through auctions or pay-as-you-go basis, allowing developers more control.

Analysts expect these changes to increase the demand for DOT since the coin serves as a medium of exchange. All on-chain transactions are settled in DOT. 

Polkadot (DOT) Market Cap Dips: Q3 Sees 16% Decrease In Value

Polkadot (DOT), one of the prominent blockchain networks in the crypto space, experienced a 16% decline in market capitalization in the third quarter (Q3) of 2023, according to a recent report from Messari. 

This decline came after a moderate downturn in the overall cryptocurrency market during Q3, despite favorable court rulings for XRP and Grayscale. The total crypto market capitalization declined by 5.8%, with Bitcoin (BTC) and Ethereum (ETH) falling by 7.5% and 10.0%, respectively.

Polkadot Closes Q3 With $5.2 Billion Market Cap

As reported by Messari, Polkadot’s market capitalization closed at $5.2 billion, positioning it as the 13th largest crypto asset by market cap in Q3 2023 (currently 15th). 

Polkadot

Polkadot’s financial structure is based on a weight-based fee model, which differs from the gas-metering model in other networks, such as Ethereum.

Transaction fees in Polkadot are determined and charged before execution, with the calculation comprising a weight fee reflecting computational resources, a length fee based on transaction size, and an optional tip to incentivize block authors. 

In Q3 2023, Polkadot generated revenue amounting to $94,000, representing a 3% decrease compared to the previous quarter. Messari suggests that Polkadot’s revenue tends to be relatively lower compared to its competitors due to the network’s structural design.

On the other hand, the native token of Polkadot, DOT, serves three primary purposes: governance, staking, and parachain bonding. During Q3 2023, the staking percentage of DOT rose by 12% compared to the previous quarter, reaching 49%. 

This increase led to reduced staking rewards and a 12% decline in the annualized nominal yield to 15%. According to Messari, the close alignment of Polkadot’s staking rate with the ideal rate demonstrates the effectiveness of its mechanism.

Polkadot’s OpenGov Milestone

The Polkadot treasury supported various initiatives in Q3, including software development, bounties, client upgrades, and community events like meetups and hackerspaces. 

According to Messari, the implementation of OpenGov on June 15 marked a significant milestone, revolutionizing treasury management and enabling concurrent proposals with distinct requirements. At the end of the quarter, the Polkadot treasury held approximately 45 million DOT ($185 million).

Polkadot

Furthermore, Polkadot has recently completed the official release of Polkadot 1.0, marking the achievement of a significant milestone outlined in the Polkadot whitepaper. 

The network’s codebase has been fully transitioned to a repository managed by the community through Polkadot OpenGov and the Technical Fellowship. The roadmap for the next iteration, Polkadot 2.0, will be determined through community discussions and consensus. 

Founder Gavin Wood has proposed ideas for additional mechanisms to allocate Polkadot’s block space and for creating treaty-like agreements between multiple blockchains called “accords.”

Polkadot

As of this writing, the DOT token has exhibited a noteworthy upward trend since October 19, closely following Bitcoin’s lead. Presently, the token is trading at $4,839, reflecting a notable increase of over 16% within the past fourteen days.

Featured image from Shutterstock, chart from TradingView.com 

DOT Price (Polkadot) Surge to $5.5 – Are Bulls Ready For This?

Polkadot (DOT) is gaining pace above the $4.50 resistance against the US Dollar. The price could surge toward $5.5 if it clears the $4.80 resistance.

  • DOT is slowly moving higher above the $4.50 resistance zone against the US Dollar.
  • The price is trading above the $4.60 zone and the 100 simple moving average (4 hours).
  • There is a key bullish trend line forming with support near $4.50 on the 4-hour chart of the DOT/USD pair (data source from Kraken).
  • The pair could gain bullish momentum if there is a close above $4.80 and $4.85.

Polkadot Price Regains Strength

After forming a base above the $4.00 handle, DOT price started a decent increase. The price was able to clear the key barrier at $4.20 to enter a positive zone, like Bitcoin and Ethereum.

Polkadot cleared the $4.50 resistance zone and the 100 simple moving average (4 hours). It traded to a new multi-week high at $4.803 and is now consolidating gains. It is well above the 23.6% Fib retracement level of the upward move from the $4.046 swing low to the $4.803 high.

DOT price is now trading above the $4.60 zone and the 100 simple moving average (4 hours). There is also a key bullish trend line forming with support near $4.50 on the 4-hour chart of the DOT/USD pair. The trend line is close to the 50% Fib retracement level of the upward move from the $4.046 swing low to the $4.803 high.

DOT Price (Polkadot)

Source: DOTUSD on TradingView.com

Immediate resistance is near the $4.80 level. The next major resistance is near $4.85. A successful break above $4.85 could start another strong rally. In the stated case, the price could easily rally toward $5.20 in the coming days. The next major resistance is seen near the $5.50 zone.

Are Dips Supported in DOT?

If DOT price fails to continue higher above $4.80 or $4.85, it could start a downside correction. The first key support is near the $4.62 level.

The next major support is near the $4.50 level and the trend line, below which the price might decline to $4.35. Any more losses may perhaps open the doors for a move toward the $4.20 support zone.

Technical Indicators

4-Hours MACD – The MACD for DOT/USD is now gaining momentum in the bullish zone.

4-Hours RSI (Relative Strength Index) – The RSI for DOT/USD is now above the 50 level.

Major Support Levels – $4.62, $4.50 and $4.20.

Major Resistance Levels – $4.80, $4.85, and $5.50.

Polkadot Road To Recovery – Will $4 Mark The Turning Point?

Polkadot (DOT) has been grappling with a descending resistance trendline, experiencing a relentless decline since February. In the month of October, the digital asset suffered a 10% drop, plummeting from $4.3 to $3.6. 

Market analysts are warning of the potential for further losses should the prevailing bearish pressure persist. However, a slight glimmer of hope emerged as DOT attempted a reversal at $3.6, hinting at the possibility of overcoming the overhead resistance barrier.

At present, the DOT price according to CoinGecko stands at $3.74, depicting a marginal 0.3% decline over the last 24 hours and a 2.8% dip over the span of seven days. 

DOT’s Struggle For Recovery

The absence of horizontal support below the current price underscores the significance of Fib retracement levels in forecasting potential bottoming areas. Notably, a Fibonacci retracement tool was utilized, encompassing the lower high of $4.8 on August 29 and the recent dip of $3.6 on October 12. This analysis highlighted that the path to recovery for DOT faces significant obstacles at the 23.6% Fib ($3.9) and the 38.2% Fib ($4).

Complicating matters further, the $4 level, serving as the second resistance target, coincides with a daily bearish order block (OB). This confluence suggests that crossing the $3.9 threshold could prove challenging for bullish momentum.

Polkadot Developers Stand Strong

Despite the persistent price downturn, the developers within the Polkadot ecosystem remain resolute and undeterred. This unwavering commitment is evident from the substantial Polkadot active developers, which are currently hovering close to an all-time high. This figure notably exceeds the levels recorded in 2021 when the altcoin’s price reached its peak.

In a recent announcement, Parity Technologies, a significant player in blockchain infrastructure, revealed its strategic shift towards decentralization within the Polkadot (DOT) ecosystem. The forthcoming organizational changes are anticipated to mark a new chapter for the company in the months to come.

Polkadot’s Cutting-Edge Technology Advancement

Amidst circulating rumors, Parity Technologies promptly dispelled speculations about a massive layoff of approximately 300 employees during a recent off-site gathering in Mallorca. The company emphasized that any adjustments to the workforce will be gradual and in alignment with its progressive decentralized strategy.

Emphasizing their dedication, Parity underscored their commitment to driving the advancement of Polkadot’s cutting-edge technology. Their key focus remains on enhancing the developer experience and fostering a resilient developer community within the Polkadot ecosystem, ensuring its sustained growth and innovation.

(This site’s content should not be construed as investment advice. Investing involves risk. When you invest, your capital is subject to risk).

Featured image from Mudrex

Polkadot To Increase Parachains By 10X, Will This Support Free-Falling DOT?

Polkadot, a platform aiming to drive blockchain interoperability, wants to increase the number of parachains from 100 to 1,000 in a planned upgrade. The network, which remains one of the most valuable by market cap, has, like most layer 1 networks, suffered from dropping user activity over the past months. 

DOT Is Down Over 90%

The dip follows the crypto winter in 2022. However, the upcoming upgrade might catalyze demand, even supporting DOT, the native currency.

DOT is changing hands at $4 at spot rates, down by over 90% when prices soared to as high as $55 in the last bull market. Even though the contraction has significantly impacted prices, other altcoins, including Solana and Algorand, suffered the same fate. 

Polkadot price on September 22| Source: DOTUSDT on Binance, TradingView

Even so, with the Asynchronous backing update, whether DOT will find support is yet to be seen. The reveal on September 21 didn’t move DOT, and the coin is edging lower, towards 2023 lows.

Polkadot developers are now setting their eyes on Asynchronous backing. Sophia Gold, the Engineering Lead at Parity Technologies, said the update is “the most significant evolution of parachain consensus since we launched parachains almost two years ago.”

Their goal is to increase the number of parachains to 1,000 by the end of 2024, effectively boosting the network’s transaction processing speeds to over 1 million.

Asynchronous backing enables flexible scheduling for our future scaling work through elastic scaling and instantaneous core time. We have a credible roadmap to get Polkadot to support 1,000 parachains and 1m+ transactions per second. The design is there – we know how to scale Polkadot for the indefinite future.

The Asynchronous Backing: What It Means For Polkadot

With this update, Polkadot is introducing a feature called “pipelining.” This means multiple parachain blocks can be processed simultaneously instead of waiting for one block to be fully validated and included on the relay chain before moving on to the next one. 

Accordingly, Polkadot would process more transactions every second at any instance, effectively scaling the network without relying on layer-2 solutions common in Ethereum or Bitcoin, for example. Since “pipelining” will enhance throughput, Polkadot will have a higher capacity. For this reason, the developer plans to half blockchain validation time from 12 to 6 seconds. 

A key feature about Asynchronous backing is that any parachain block that fails to be added to the “relay chain” on the first attempt can be reused. Developers note that this will significantly improve network efficiency due to reduced wastage.

It is the combination of pipelining and reusing of parachain blocks that Polkadot developers say opens the door for the number of Parachains to be increased from the current 100 to 1,000. With enhanced on-chain scalability, running more parachains can be more feasible.

DOT Price (Polkadot) Hints At Potential Recovery, Here’s What Could Propel It To $4.8

Polkadot’s DOT is recovering higher from the $3.92 support against the US Dollar. The price could gain pace if it clears the $4.20 and $4.35 resistance levels.

  • DOT is slowly moving higher above the $4.05 resistance zone against the US Dollar.
  • The price is trading just above the $4.15 zone and the 100 simple moving average (4 hours).
  • There is a key bearish trend line forming with resistance near $4.175 on the 4-hour chart of the DOT/USD pair (data source from Kraken).
  • The pair could gain bullish momentum if there is a close above $4.20 and $4.35.

Polkadot’s DOT Price Faces Uphill Task

After a sharp decline, DOT price found support near the $3.90 zone. A low is formed near $3.91 and the price is now attempting a fresh increase, like Bitcoin and Ethereum.

There was a break above the $4.00 and $4.05 resistance levels. The price surpassed the 23.6% Fib retracement level of the downward move from the $4.80 swing high to the $3.91 low. DOT is now trading just above the $4.15 zone and the 100 simple moving average (4 hours).

Immediate resistance is near the $4.20 level. There is also a key bearish trend line forming with resistance near $4.175 on the 4-hour chart of the DOT/USD pair.

DOT Price (Polkadot)

Source: DOTUSD on TradingView.com

The next major resistance is near $4.35. It is near the 50% Fib retracement level of the downward move from the $4.80 swing high to the $3.91 low. A successful break above $4.35 could start a strong rally. In the stated case, the price could easily rally toward $4.80 in the coming days. The next major resistance is seen near the $5.0 zone.

Another Decline?

If DOT price fails to continue higher above $4.20 or $4.35, it could start another decline. The first key support is near the $4.05 level.

The next major support is near the $3.90 level and the last low, below which the price might decline to $3.75. Any more losses may perhaps open the doors for a move toward the $3.50 support zone.

Technical Indicators

4-Hours MACD – The MACD for DOT/USD is now gaining momentum in the bullish zone.

4-Hours RSI (Relative Strength Index) – The RSI for DOT/USD is now above the 50 level.

Major Support Levels – $4.05, $3.90 and $3.75.

Major Resistance Levels – $4.20, $4.35, and $4.80.

Polkadot Experiences Correction After Reaching $5.54: What’s Next In Store?

Yesterday, Polkadot (DOT) reached its weekly high at $5.54 but subsequently started a corrective phase. In the past 24 hours, DOT has managed to retain 1.8% of its overall gains during that period. On the weekly chart, DOT exhibited a 3% price increase.

However, the technical analysis suggests that bears currently have the upper hand, with buying strength and demand remaining low. Despite this, if Bitcoin continues its upward movement toward the $28,000 level, several altcoins, including DOT, may also experience positive price action.

On the flip side, if sellers dominate, DOT could break below its crucial support level, strengthening the bearish sentiment in the upcoming trading sessions. The decline in the DOT market capitalization further indicates the prevailing low buying strength at the present moment.

Polkadot Price Analysis: One-Day Chart

Polkadot

At the time of writing, DOT was trading at $5.47. Following a rejection at the $5.54 level, the altcoin has experienced a retracement on its chart.

The overhead resistance for DOT is currently positioned at $5.58. If the altcoin manages to surpass this resistance level, it could potentially reach $5.80. Despite the price correction, DOT has thus far maintained a position above the crucial support level of $5.40.

However, if sellers gain momentum, the price may drop below the vital support level of $5.40 and trade around $5.30. The trading volume of DOT in the previous session was bearish, indicating a decline in demand driven by the bears on the daily chart.

Technical Analysis

Polkadot

Throughout the month of May, DOT has experienced minimal demand on its chart. Although the Relative Strength Index (RSI) displayed signs of recovery initially, the depreciation of DOT led to a decrease in demand.

This suggests that buying strength did not enter the positive zone. Furthermore, the DOT price moved below the 20-Simple Moving Average (SMA) line, indicating that sellers have been driving the price momentum in the market.

If there is a slight increase in demand in the upcoming trading sessions, DOT may attempt to trade above the 20-SMA line, providing an opportunity for the bulls to regain control over the price.

Polkadot

Although demand for Polkadot has declined, the chart still displays buy signals, suggesting the potential for a price increase. These buy signals are accompanied by an increase in demand, indicating a positive outlook.

The Moving Average Convergence Divergence (MACD) indicator, which reflects price momentum and trend changes, shows green histograms tied to buy signals.

Additionally, the Bollinger Bands, which measure price volatility and fluctuation, are constricted, suggesting that Polkadot may experience significant volatility in the upcoming trading sessions.

Polkadot Extends Decline, Can Bulls Defend $5.15 Support?

The Polkadot price analysis continues to indicate a bearish outlook as the market undergoes a notable decline. Within the past 24 hours, the asset’s price experienced a slight decline, demonstrating sideways movement under the influence of bearish sentiment.

On a weekly timeframe, there has been limited movement in the price of DOT. In terms of technical indicators, DOT has exhibited bearish strength, with low buying pressure. Both demand and accumulation levels have decreased based on the daily chart.

Given the indecisiveness in Bitcoin’s chart, many altcoins, including DOT, have either remained constrained under immediate resistance levels or have entered consolidation phases. It is crucial for DOT to maintain a price level above its immediate support to avoid the possibility of another substantial decline in upcoming trading sessions.

If selling pressure intensifies, there is a risk of the altcoin breaking below its crucial support level. The declining market capitalization of Polkadot indicates that sellers are still exerting control over the asset.

Polkadot Price Analysis: One-Day Chart

Polkadot

As of the current writing, DOT is being traded at $5.29, with Polkadot hovering near its critical support level of $5.15. Should the price fall below this level, it may further decline to $5. On the upside, a significant resistance level is observed at $5.40.

If DOT bulls manage to surpass this resistance, it could potentially trigger a rally towards $5.71, indicating a 6% appreciation.

Further progress could then lead the price into the $6 range. Notably, the trading volume of DOT in the last session was relatively low. This suggested that buying strength was weaker compared to selling pressure.

Technical Analysis

Polkadot

During the months of April and May, the demand for DOT remained relatively weak. Analysis shows that the Relative Strength Index (RSI) remained below the 40-mark, indicating that selling pressure outweighed buying pressure in the market.

Additionally, DOT remained below the 20-Simple Moving Average (SMA), further affirming the dominance of sellers in driving the price momentum.

However, if DOT manages to surpass the $5.30 mark, it has the potential to climb above the 20-SMA line. This could potentially attract buyers back into the market and shift the overall sentiment in a more positive direction.

Polkadot

As demand for DOT declined, the altcoin exhibited decreasing buy signals on its one-day chart. The Moving Average Convergence Divergence (MACD), which represents price momentum and trend reversal, displayed declining green histograms, indicating a weak buy signal for DOT.

Furthermore, the Bollinger Bands, which illustrate price volatility and fluctuations, exhibited constriction, indicating a range-bound movement.

The upcoming trading sessions hold importance for DOT as they will determine whether the price breaks out above or below the crucial support line.

Polkadot (DOT) Bulls Retreat As Bears Drag The Price Down

Polkadot (DOT) is in the red today as the bears seek to regain control over its price. DOT traded at $4.37 on January 1, 2023, and increased to $5.13 on January 11.  

It remained within this range before moving to $6.23 on January 20. Also, DOT increased to the $7 price level on February 17 as the bulls seized control of its price.

However, a gradual bearish turn between March and April forced it back to $5, where it currently trades today. 

Polkadot Price Prediction Today Are The Bears In Control?

DOT is trading in a sideways trend forming a red candle on the daily chart. It is below its 50-day and 200-day Simple Moving Averages (SMA), with bearish sentiment in the short and long term.

Related Reading: Santiment Explains How Bitcoin Investor Mentality Influenced Recent Price Action

The SMA calculates an asset’s average price over a specified period and helps predict trend direction. If the bears persist, DOT’s 50-day SMA, which is about to drop below its 200-day SMA, will form a death cross. Also, the Relative Strength Index (RSI) is 40.73 and in the neutral zone. The RSI is a trend-based indicator.

DOT’s RSI is moving downwards, hinting at further price decline to the oversold region before a trend reversal.  The cryptocurrency’s Moving Average Convergence/Divergence (MACD) is slightly above its signal line and shows convergence. 

Also, the MACD – a trend momentum indicator that displays the relationship between two exponential moving averages (EMAs) and an asset’s price, displays a negative value conforming to the bearish trend today. The green histogram bars are fading, indicating a changing trend direction. 

DOT’s technical indicators all hint at the possibility of further price decline for the asset. It is close to the $5.29 support level as the bears at the $5.42 resistance continue to act on its price, forcing a decline.

Polkadot (DOT) Bulls Retreat As Bears Take The Price Down

DOT has remained in a sideways trend for the last few days and further price decline remains a possibility. However, if the bulls rally again, the $5.42 resistance level will be a realistic target before the $6 psychological resistance level.  

The altcoin will likely enter a downtrend if the bears maintain the pressure today. But one thing that offers the possibility of a bullish reversal is the upcoming ‘Polkadot Decoded 2023’ event in June. 

Polkadot Decoded 2023 Might Boost DOT’s Performance

Polkadot is hosting a community event, ‘Polkadot Decoded 2023’, between June 28-29 in Copenhagen, Denmark. This event will assemble the Polkadot community in progressive talks anchored by over 100 quality speakers in the crypto community. Also, developers will benefit from interactive and practical sessions based on Polkadot’s technology.

Free virtual tickets are currently available for the wider crypto community around the globe to stream the event online.

Featured image from pIxabay and chart from Tradingview.com

Polkadot (DOT) Price: The Bear Vs. Bull Battle Continues – Who’ll Take The Beating?

Since the beginning of this year, Polkadot has been on a roller coaster ride as the general cryptocurrency market has fluctuated over the past months.

Recently, the price of Polkadot (DOT) has experienced negative sentiment, causing a slight decline in the coin’s value.

The coin’s price slightly decreased from $5.51 to $5.12 on May 9, 2023. However, it started to gain further positive momentum the same day and recovered to $5.3 today.

Strong Bearish Momentum

The price of DOT has been trading sideways within the last 24 hours, indicating a bearish trend. As a confirmation of the bearish momentum in the Polkadot market, the 24-hour trading volume is down by 18%.

The decline indicates a decrease in demand for DOT in the market and might lead to greater volatility as traders adjust their position based on the market sentiment.

Polkadot’s current market cap is estimated at $6.1 billion, with a market dominance of 0.56%. But the increase in selling pressure has impacted the price of Polkadot significantly.

Polkadot is in the phase where investors and traders are afraid to buy or hold the coin. As investors take advantage of the current dip in price to acquire more DOT, anticipate a modest recovery in the coming week.

Polkadot (DOT) Technical Analysis

DOT trades below its 200-day and 50-day Simple Moving Averages (SMA). This indicates that DOT has a bearish momentum in both long-term and short-term trends. 

The Relative Strength Index (RSI) indicator shows that DOT currently reads 32.92. This indicates that the coin is slightly in the oversold region. It also suggests that DOT is experiencing some downward pressure. However, the asset may rebound from its oversold condition and return to a normal trading range.

The MACD indicator also confirms the bearish trend as its trading below the signal line. This indicates that the bears have more pressure than the bulls.

Recent Development In Polkadot Ecosystem

Meanwhile, the number one gaming blockchain platform, Mythical Games, is departing from the Ethereum network to launch its new Mythos ecosystem on Polkadot. 

The recent development will allow Mythos gaming partners to build the biggest and most connected gaming ecosystem in the Web3 industry.

The development will result in a new scalable platform, accessible to all Mythos partners and compliant with Web2 gaming platforms, including the Epic Games Store.

Polkadot (DOT) Price: The Bear Vs. Bull Battle Cantinues, Who'll Take The Beating?

This accessibility is a core principle for Mythical as it continues to bridge the gap between blockchain and traditional gaming.

The Mythical Games founder proclaimed that the decision to leave the Ethereum ecosystem was due to the slow transaction speeds and other issues around the network.

This partnership will also benefit the Polkadot ecosystem as Mythical has an advanced feature, streaming technologies, and Web3 gaming expertise. It will also drive the massive adoption of both Polkadot and Mythical.

-Featured image from Pixabay and chart from Tradingview.com

Polkadot (DOT) Under Sell Pressure As Bears Retaliate

Over the last week, Polkadot (DOT) has had trouble gaining traction, falling by 8.41% from April 30 to May 4. However, the price is trading sideways and there might be a modest recovery next week as investors take advantage of this dip to acquire more DOT.

According to CoinMarketCap, Polkadot ranks #11 among all cryptocurrencies with a current market price of $5.75. Polkadot’s 24-hour trading volume is up by 29.40% in 24 hours, while its market cap has also gained 1.57% within the same time frame.

Polkadot’s (DOT) Fear & Greed Index today is 46. This level indicates that bulls are pushing the price up gradually, but the bears are still in their positions. 

Over the last few days, Polkadot (DOT) has been showing some bullish signs; so expect a possible recovery within the next few weeks as investors take advantage of the current momentum.

DOT Price Analysis

Polkadot trades between the 200-day simple moving average and the 50-day simple moving average (SMA). This indicates that the market is in a neutral or consolidation phase.

The price does not trend significantly in either direction. During this phase, traders and investors may use the 50-day and 200-day SMAs as support and resistance levels while trading.

Related Reading: Check Out This Shocking Pepe Coin Versus Bitcoin Comparison

However, if the price exceeds the 50-day SMA, it could indicate a short-term uptrend, giving investors a buying opportunity.

The Relative Strength Index (RSI) level of DOT is 41, indicating that its market is heading towards the neutral zone and there’s indecision among investors.

But the 24-hour volume indicator shows that the trading activity is gradually growing, which could mean investors are building interest in the coin. This may increase liquidity and potential price movement in favor of DOT.

DOT

The chart above shows the key support and resistance levels of Polkadot (DOT). Polkadot now trades between $5.587 and $6.07 primary support and resistance levels. DOT’s first important resistance level is $6.07. If the price rises above this level, the next resistance levels are $7.970.

Polkadot (DOT) Feels The Heat As Bears Retaliate But Bull Maintain An Intense Momentum

Future Developments For Polkadot

Many upcoming developments on the Polkadot network might push its adoption, usage, and price in the nearest future.

For instance, the community voted to onboard a Bridge Hub system parachain to Polkadot. Also, Mythical Games plans to migrate its Mythical Chain to the Polkadot blockchain. 

Furthermore, the developers are discussing establishing Polkadot Hubs in South-East Asia, with Bali and Indonesia as the first focus.  

These development proposals and discussions depict the team’s effort to enhance the network’s efficiency, connectivity, and interoperability. In time, more adoption and activities may affect DOT prices positively.

Featured image from Pixabay and chart from Tradingview.com

Polkadot (DOT) Price Slumps Below $6 – Any Chances For Reversal?

The price of Polkadot (DOT) has been gradually moving south over the past few days. The price decline cuts across the entire crypto market, with strong signs of bears. The cumulative market cap has dropped by 2.58% to sit at $1.25 trillion in 24 hours.

DOT has finally lost its grip on the $6 region as the bears became aggressive on the token over the past 24 hours. The market is wondering if Polkadot still has a chance to reverse the downtrend.

Polkadot Price Drops Drastically With Prevailing Bearish Trend  

The past few days seem to be turning out more negatively for DOT. The asset hovered between $6.1 and $6.9 last week except on April 21, when it dipped. 

Currently, the 60-day and 90-day price action for Polkadot shows negative values of 4.45% and 5.36%, respectively. Also, DOT dipped by 12.46% over the past 7 days.

After losing its hold on the price level of $7 in February, DOT has maintained a trading price within the $6 region. As of April 21, the price of DOT dropped to its resistance point of $5.8 before correcting. 

However, the price analysis of DOT for the past 24 hours shows the token is gradually going down again within the past few hours. 

At the time of writing, DOT is trading at $5.921, indicating a slight reversal after plunging. The bearish push on DOT from the past few days has spilled over to the weekend.

Polkadot (DOT) Price Slumps Below $6 Mark, Any Chances For Reversal?

The crypto market is undergoing a bearish trend, with most crypto assets battling for price stability. Polkadot is included in the market performance. Hence, the selling pressure for the token has exceeded its buying pressure, forcing the price of DOT below the $6 region.

Bears Push DOT Below $6

After three consecutive red days, DOT has formed a green candle on the price chart. However, the bears are still in control as they struggle to reclaim past price levels. 

DOT has dropped below its 50-day and 200-day Simple Moving Averages (SMA), indicating a bearish sentiment in the short and long term.

DOT’s support levels are $5.15 and $5.75. A decline below its support will bring further price fall. Also, the resistance levels are $6.71 and $7.89. However, the $6 price level has transformed into a psychological resistance level.

The Relative Strength Index (RSI) indicator is 39.74, close to the oversold region of 30. However, the indicator points upwards, suggesting a bullish reversal in the short term.

DOT’s indicators are mostly bearish. Its next price action depends on traders’ decisions in the coming weeks. Further drop into the oversold region will likely lead to a trend reversal at the $5.75 support level.

Featured image from Pixabay and chart from Tradingview

Polkadot Hints At Price Recovery – Can DOT Go Past 15% Weekly Ceiling?

Polkadot (DOT) is in the green (see image below) and going steady. Could this hint at price recovery? Even though Polkadot’s funding rate plunged for a while, it is showing some improvement at the time of writing.

Here’s a quick look at DOT price movement:

  •  Polkadot price is up by 14.9% in the weekly
  •  DOT low in market cap dominance
  •  DOT shows a spike in development activity

According to Coingecko, DOT price has skyrocketed by 4% in the last 24 hours, and trading at $6.50 as of press time.

Polkadot Eco-Friendliness To Drive Positive Momentum

January was phenomenal for most cryptocurrencies that are enjoying a price rally, but DOT was seen struggling and was unable to reach its pre-FTX levels

On a positive note, DOT was the only asset that consumed the least electricity when pitted against other cryptocurrencies. This eco-friendly quality of DOT can drive positive momentum for the coin.

Even though the weighted sentiment on Polkadot remained to be negative last December, its low electricity consumption can drive a change in public sentiment, switching it to positive which is great news for Polkadot.

The low trading volumes suggest that the bears may have the upper hand. This action has the potential to push DOT prices below the $6.154 support level, putting the brakes on the recent uptrend in DOT.

DOT is predicted to spike in terms of development activity which could tick developer interest this year. In addition, DOT is said to potentially tip its pre-FTX levels in the next couple of days or weeks.  


In the event that this positive pattern persists, DOT’s pace of rebound is estimated to climb, which would enable bulls to charge beyond the resistance located at $6.845 and $7.235, which is the range that existed before the crypto turmoil broke out around late November.

Social Metrics Up For DOT

The number of people staking DOT has also increased by over 6.2% as seen in the past month which also hints at a positive streak for the asset. More so, social metrics have also increased for DOT.

Social mentions spiked by 7.6% with engagements shooting over 26K. Interestingly, DOT has been increasingly popular as more people are interested in and talking about it.

Additionally, there are upcoming referendums in line with runtime and governance upgrades that could increase the attractiveness of the coin to investors.

Meanwhile, the market sentiment enveloping DOT still has that air of uncertainty considering its shrinking market cap and high volatility.

Featured image from Freepik

DOT Price (Polkadot) Indicators Suggest Strong Case For Fresh Rally

Polkadot’s DOT started a fresh increase from the $5.60 support against the US Dollar. It correcting gains, but indicators suggest high chances of a fresh increase.

  • DOT is holding the ground above the $6.00 and $5.80 levels against the US dollar.
  • The price is trading nicely above the $6.00 support and the 100 simple moving average (4-hours).
  • There is a major bullish trend line forming with support near $6.05 on the 4-hours chart of the DOT/USD pair (data source from Kraken).
  • The pair could start a strong rally once it clears the $6.40 and $6.50 resistance levels.

Polkadot’s DOT Eyes Fresh Rally

After forming a base above the $5.60 zone, DOT price started a fresh increase. It climbed above the $5.80 and $6.00 levels to move back into a positive zone.

The bulls were able to push the price above the $6.50 level and 100 simple moving average (4-hours). The price traded as high as $6.82 and recently started a downside correction, similar to bitcoin and ethereum. There was a move below the $6.50 level.

Dot price dipped below the 50% Fib retracement level of the upward move from the $5.59 swing low to $6.82 high. However, the bulls are protecting the $6.15 support zone.

There is also a major bullish trend line forming with support near $6.05 on the 4-hours chart of the DOT/USD pair. The bulls are also protecting the 61.8% Fib retracement level of the upward move from the $5.59 swing low to $6.82 high.

It is also above the $6.00 support and the 100 simple moving average (4-hours). An immediate resistance is near the $6.40 level. The main resistance is still near the $6.65 and $6.80 levels.

DOT Price (Polkadot)

Source: DOTUSD on TradingView.com

A successful break above $6.65 and a close above $6.80 could start a strong rally. In the stated case, the price could easily rise 10%-15% in the near term.

Dips Limited?

If DOT price fails to continue higher above $6.65 or $6.80, there could be more losses. The first key support is near the $6.05 and $6.00 levels.

The next major support is near the $5.80 level and the 100 simple moving average (4-hours). Any more losses may perhaps open the doors for a move towards the $5.50 support zone.

Technical Indicators

4-Hours MACD – The MACD for DOT/USD is now losing momentum in the bullish zone.

4-Hours RSI (Relative Strength Index) – The RSI for DOT/USD is now just below the 50 level.

Major Support Levels – $6.05, $6.00 and $5.80.

Major Resistance Levels – $6.40, $6.65 and $6.80.