Storj (STORJ) Wyckoff Analysis (11 to 20 Dec 2023)

Wyckoff Analysis (WA) aims to understand why prices of stocks and other market items move due to supply and demand dynamics. It typically is applied to any freely traded market where larger or institutional traders operate (commodities, bonds, currencies, etc.). In this article we will apply WA to the cryptocurrency Storj ($STORJ) to make a forecast for approximate future events.

TradingView Chart

Link to the raw image: https://www.tradingview.com/x/BGsOkzGM

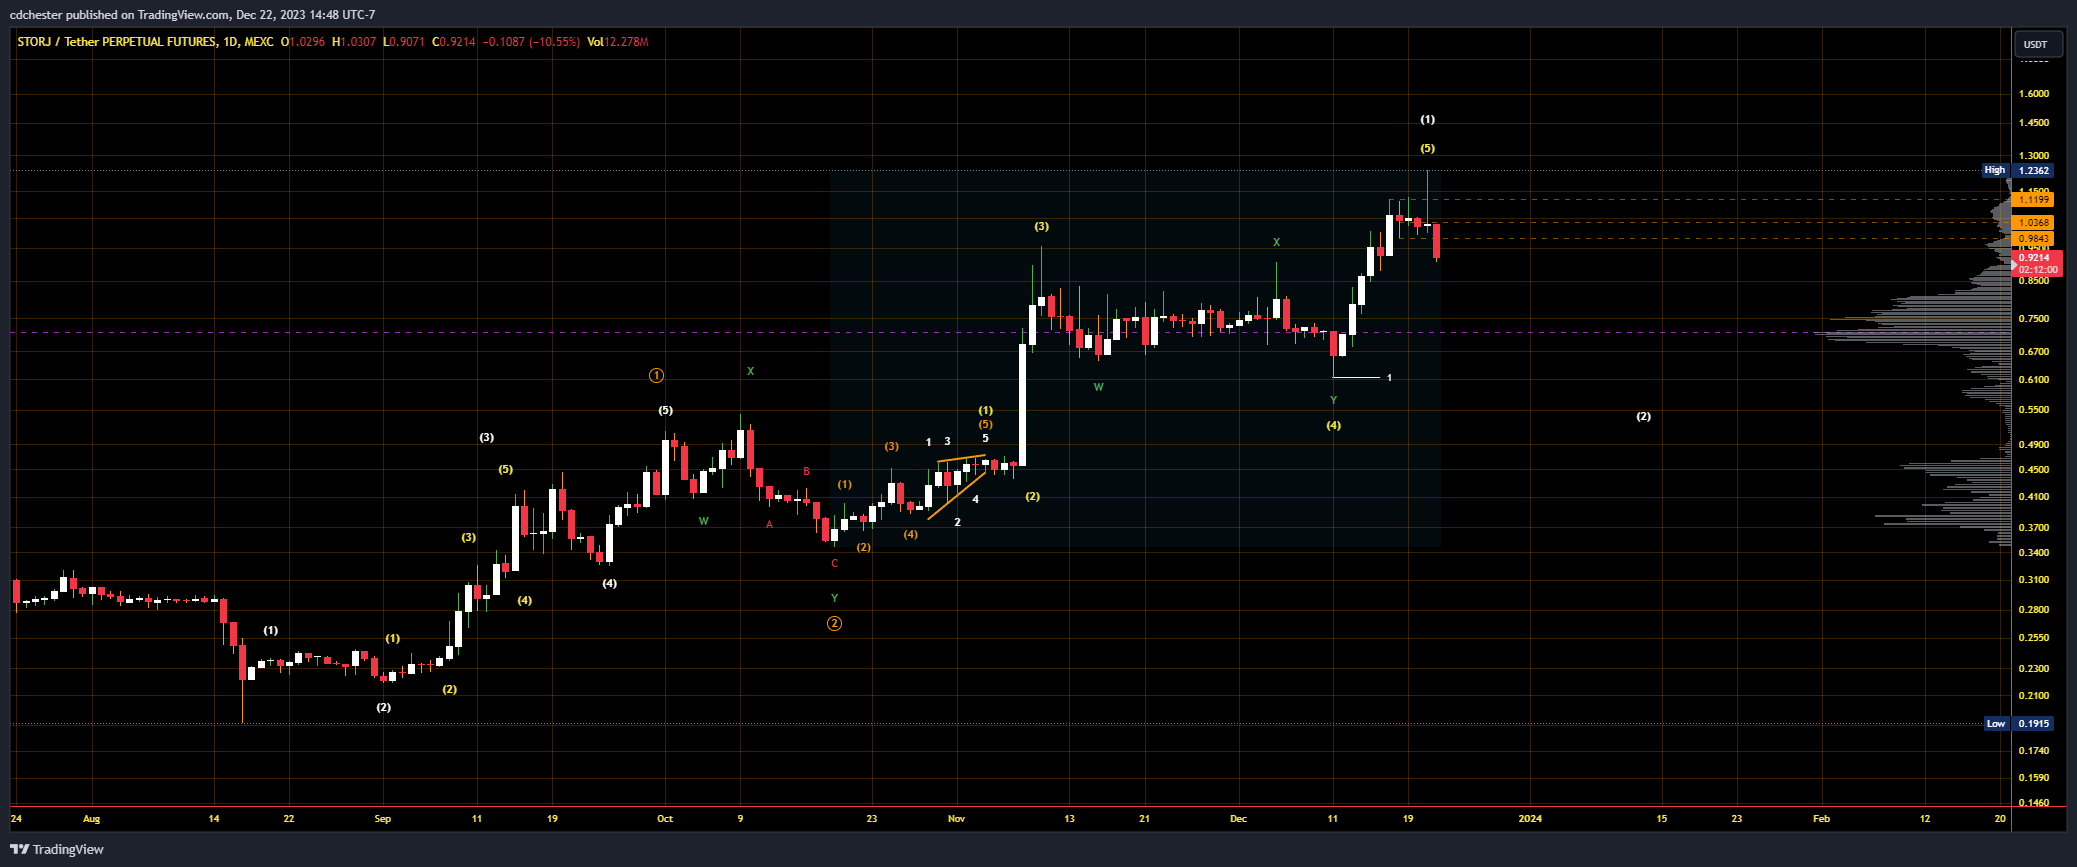
Storj is currently in Phase E of a Wyckoff Distribution Schematic #1. StockCharts says this about Phase E in their article on the Wyckoff Method:

Phase E depicts the unfolding of the downtrend; the stock leaves the TR and supply is in control. Once TR support is broken on a major SOW, this breakdown is often tested with a rally that fails at or near support. This also represents a high-probability opportunity to sell short. Subsequent rallies during the markdown are usually feeble. Traders who have taken short positions can trail their stops as price declines. After a significant down-move, climactic action may signal the beginning of a re-distribution TR or of accumulation.

The trading range for Storj was $1 – $1.12 and it has concretely fallen below that. From the picture below a major SOW has occurred, more so pointing to a Distribution occurring. This also coincides with our analyst’s Elliott Wave (EWT) view on Storj. They predict a small rally as Storj continues to fall in its Wave 2. The majority of the liquidity (per its relevant Volume Profile) is between the 38.2% and 61.8%  LFR at $0.56 and $0.76 respectively. A liquidity cluster is typically expected between these LFRs in EWT leading us to the think a Wave 2 correction is happening. Additionally, the cluster is in the price range of the subwave 4, an EWT guideline.

Image

Link to the raw image: https://www.tradingview.com/x/dD8hv9Aj

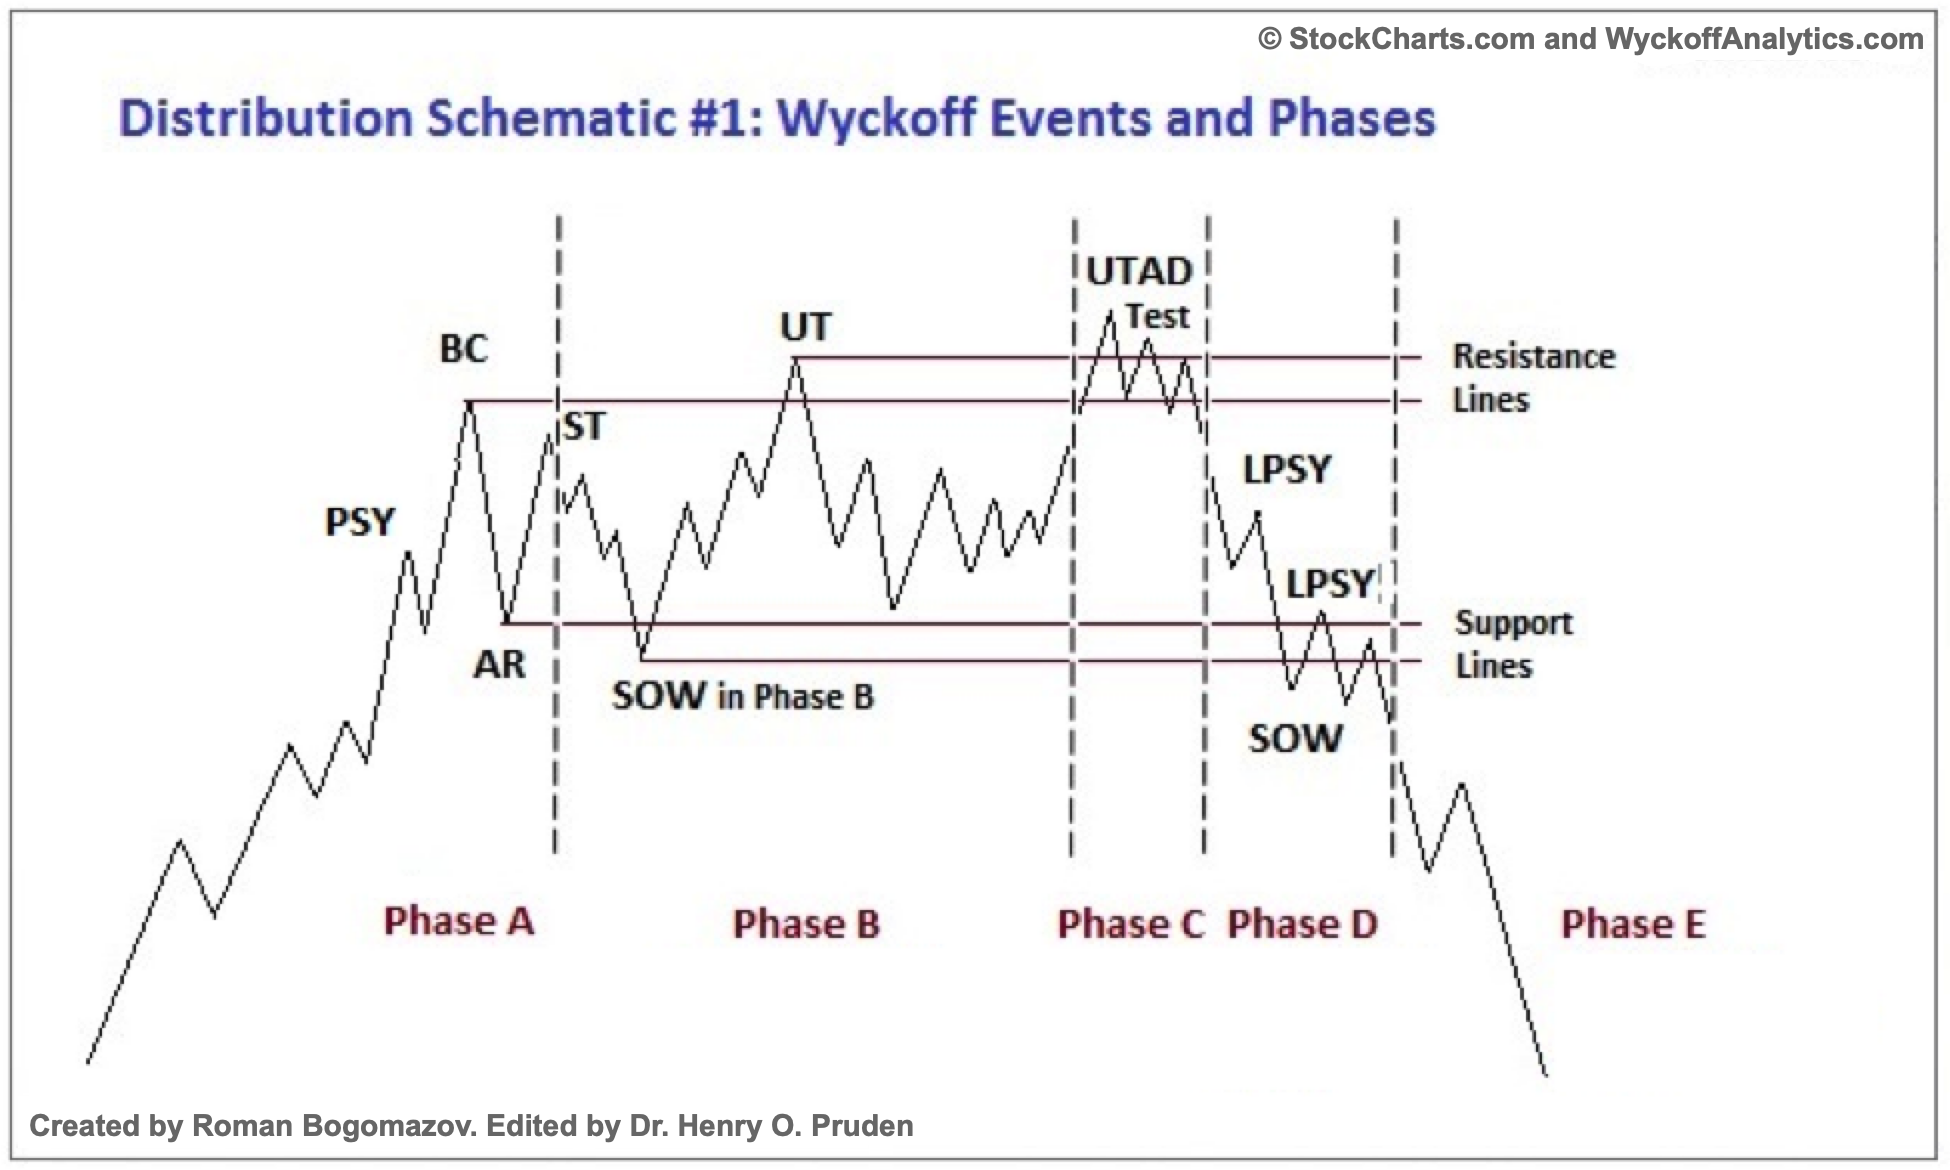
Below is the typical schematic for a Wyckoff Distribution Schematic #1.

Glossary

All quotes are from the first link in Supplemental Reading.

Preliminary Supply (PSY) – “where large interests begin to unload shares in quantity after a pronounced up-move”

Buying Climax (BC) – large operators selling their shares while the public buys them at a premium during a period of huge demand

Automatic Reaction (AR) – “With intense buying substantially diminished after the BC and heavy supply continuing, an AR takes place”

Secondary Test (ST) – when “price revisits the area of the SC to test the supply/demand balance at these levels”

Upthrust After Distribution (UTAD) – “a definitive test of new demand after a breakout above TR resistance”

Test – where larger traders “test the market for supply throughout a TR”

Sign of Weakness (SoW) – “a down-move to (or slightly past) the lower boundary of the TR, usually occurring on increased spread and volume”

Last Point of Supply (LPSY) – “exhaustion of demand and the last waves of large operators’ distribution before markdown begins in earnest”

Elliott Wave Theory (EWT)

“A theory in technical analysis that attributes wave-like price patterns, identified at various scales, to trader psychology and investor sentiment.”

Source: “Elliott Wave Theory: What It Is and How to Use It” by James Chen (2023)

Logarithmic Fibonacci Retracement (LFR) – A measured correction at certain Fibonacci ratios on a semi-log scale.

Logarithmic Fibonacci Extensions (LFE) – A measured rally at certain Fibonacci ratios on a semi-log scale.

Supplemental Reading

The Wyckoff Method: A Tutorial” by Bogomazov & Lipsett

Reaccumulation Review” by Bruce Fraser (2018)

Jumping the Creek: A Review” by Bruce Fraser (2018)

Distribution Review” by Bruce Fraser (2018)

Introduction to Point & Figure Charts” from StockCharts

P&F Price Objectives: Horizontal Counts” from StockCharts

The Wyckoff Methodology in Depth” by Rubén Villahermosa (2019)

Wyckoff 2.0: Structures, Volume Profile and Order Flow” by Rubén Villahermosa (2021)

Elliott Wave Principle – Key To Market Behavior” by Frost & Prechter (2022)

Bitcoin Wyckoff And Elliott Wave Predict This Next Price Move

The Bitcoin (BTC) price has been trading in a range between $27,000 and $28,000 since Friday last week, with $27,800 currently being the most important resistance level to kick off a move to the upside. As recently as last Tuesday, BTC was trading above $30,000 before plunging more than 10%.

However, Wyckoff and Elliott Wave analysts agree that the move is not a cause for concern. According to trader and market psychology coach Christopher Inks, a minimum target of $42,350 is expected for Bitcoin as part of its next bounce.

Here’s What Wyckoff Analysis Says About The State Of Bitcoin

The Wyckoff method was invented by Richard Wyckoff in the early 1930s and proposes to read the market using causal fundamentals that actually predict market movements. The accumulation and distribution schemes are probably the most popular part of Wyckoff’s work in the crypto and Bitcoin community.

The models break down the accumulation and distribution phases into five phases (A through E), along with several Wyckoff events. Inks writes in his analysis that Bitcoin is most likely in an accumulation according to the Wyckoff method.

“The Elliott Wave count may or may not be correct locally. We want to see an impulsive breakout above that ascending red dashed resistance to signal that the wave ((ii)) flat structure may be complete, but a breakout above wave (b) is required to add confidence to that count,” writes Inks, who shared the chart below.

Bitcoin Wyckoff and Elliott Wave

If Inks’ count is correct, then another breakout has the daily pivot as its target. This means that the wave ((iii)) of 3 from here has a minimum target of $42,350 per Bitcoin. According to the analyst, this theory is also supported by the fact that the RSI on the daily chart is currently showing a hidden bullish divergence, with confirmation that it is complete still pending.

In addition, the Stoch RSI on the daily chart has moved back into the oversold area, so a breakout from the oversold area would further support the assumption that the wave ((ii)) is complete, the analyst says and concludes:

We can also note the red parabola. While price remains above that curved line we should continue to expect higher, overall, rather than a larger pullback. Let’s see if we can get that rally from somewhere around this area.

Todd Butterfield of the Wyckoff Stock Market Institute agrees with Inks. In his latest analysis, Butterfield writes that Bitcoin experienced a sharp sell-off on low volume last week – as expected.

This is “another low-risk buying opportunity,” according to the renowned analyst. The technometer is at 38.5 for BTC/USD and 40.4 for BTC/USDT. Via Twitter, he commented:

Bitcoin has not reached oversold and the price action had me staying on the sidelines for a moment. An oversold Technometer is not a close your eyes and buy, but an indication that we could be forming a bottom, or due for some sideways/higher.

At press time, the BTC price stood at $27,236, moving once again closer to the lower end of the range, probably for one more sweep of the low.

Bitcoin price

Currency Expert Explains Why Altcoins Experience More Carnage Than Bitcoin And Ethereum

As the current bear market in crypto continues to deepen, Bitcoin has fallen by 78%, and Ethereum by 82%. Yet elsewhere in the crypto market, many altcoins are down by as much as 96% or more

In a recent video, Elliott Wave International Currency & Crypto Analyst Jason Soni sheds some light on why this occurs and what this could mean for various cryptocurrencies. 

Breaking Down Why Some Crypto Assets Crash More Than Others

Bitcoin price has retraced by more than 78% from all-time highs set back in 2021. Ethereum, the second-largest cryptocurrency by market cap, saw an approximately 82% retracement from peak to trough thus far. 

As you move down the ranks of cryptocurrencies, the total drawdown figures deepen. Cardano, for example, suffered a 92% collapse compared to the top two cryptocurrencies. Solana, once pegged to disrupt Ethereum, dropped by a staggering 96%

In a new video entitled “Looking at Opportunities for the Next Crypto Bull Market,” Elliott Wave International Currency & Crypto Analyst Jason Soni touches on why – theoretically – this discrepancy exists. 

According to Soni, newer altcoins in their first cycle will see the deepest retracement. As cryptocurrencies mature, and go through more boom and bust cycles, retracements are less steep, like we’ve seen with Bitcoin and Ethereum. 

Ethereum versus ADA

Bitcoin Sets The Standard For Bear Market Corrections

In the video, Jason Soni used a comparison between many newer altcoins today following a similar trajectory and total drawdown as 2018 Ethereum. With each new cycle, new participants join and liquidity in each asset increases, reducing volatility over time and resulting in less and less in terms of max drawdown.

This is perhaps the most visible with Bitcoin. Following Bitcoin’s first major bull market, the first ever crypto asset retraced by 96%. In the second bear market ever in crypto, BTC retraced by 86%. During the 2018 bear market, Bitcoin sank by a grand total of 84%. A softer landing yet might still be possible during this bear market.

Considering the severity of the drawdowns in most cryptocurrencies and the extreme negative sentiment, it could mean that the end of the bear market is near. At this point, Soni recommends avoiding “social media sentiment” at all costs and says to instead “focus on the patterns.” 

The video, “Looking at Opportunities for the Next Crypto Bull Market,” is offered  exclusively through Elliott Wave International’s Crypto Trader’s Classroom, which delivers three new in-depth lessons each week from top Elliott Wave analysts. Many instructional videos include specific crypto charts and trading setups, using Elliott Wave Theory. You can learn more about Elliott Wave International’s Crypto Trader’s Classroom by clicking here

Did A Bitcoin “Zig-Zag” Shake Out The Crypto Market?

Bitcoin price is shockingly close to its former 2017 peak, causing widespread panic, fear, and despair across the crypto market. But could the violent move down be a text book zig-zag correction? And if so, what does this mean for the crypto market next?

Bitcoin Price Action Follows Deadly Zig-Zag Pattern

Despite the narrative from 2020 forward that Bitcoin and cryptocurrencies had matured has an asset class, the recent collapse reminded the world that digital assets remain speculative. Speculative assets are driven by pure emotion, since there aren’t ideal ways to fundamentally price Bitcoin yet. Most on-chain signals remained bullish despite a more than 70% fall from the peak set in November of last year, for example.

Price action might better be predicted based on Elliott Wave Theory, first discovered in the 1930s by Ralph Nelson Elliott. According to Wikipedia, “Elliott Wave Principle posits that collective trader psychology, a form of crowd psychology, moves between optimism and pessimism in repeating sequences of intensity and duration. These mood swings create patterns in the price movements of markets at every degree of trend or time scale.”

Related Reading | Bitcoin Drops To 18-Months Lows, Has The Market Seen The Worst Of It?

More simply put, bull and bear phases alternate in a predictable manner through what Elliott referred to as “waves.” The theory outlines that markets move up between a motive phase and corrective phase. Motive waves are primary cycles consisting of 5 total sub-waves. Waves 1, 3, and 5 are impulse waves in the primary market trend direction, while waves 2 and 4 are corrective phases. When wave 5 completes, the motive wave (a bull market cycle) moves into a corrective wave (and bear market).

Motive waves can come in varying shapes, and corrections can be downright confusing. However, the latest correction in Bitcoin could be a textbook zig-zag correction, according to how the pattern unfolded from a sentiment standpoint.

BTCUSD could have completed a zig-zag correction | Source: BTCUSD on TradingView.com
Will BTCUSD Finally Get A Relief Rally?

The zig-zag pattern is a 3-wave corrective structure labeled as ABC and subdivides into a 535 pattern. The first move down, labeled A, is a 5-wave impulse move based on raw emotions. Wave B is characterized as moving up in this case, sucking in new bullish positions that are ultimately taken out in the C-wave move down. C-waves of a zig-zag are also impulse moves driven by panic and fear.

When they complete, the market can move up again. It is difficult to imagine at this point in the pattern that a reversal is possible given the extreme switch in investor sentiment, but that’s often when recoveries emerge from disbelief.

Related Reading | Bitcoin Weekly RSI Sets Record For Most Oversold In History, What Comes Next?

Since Elliott Wave Theory focuses on patterns of investor sentiment switching back and forth from bear to bull and vice-versa, the patterns can be used to profit but are typically only identifiable once completed and long in hindsight. Is the recent downward spiral nothing more than a downward zig-zag pattern that might have just come to completion?

Follow @TonySpilotroBTC on Twitter or join the TonyTradesBTC Telegram for exclusive daily market insights and technical analysis education. Please note: Content is educational and should not be considered investment advice.

Featured image from iStockPhoto, Charts from TradingView.com

This Expanding Triangle Pattern Could Be The Last Hope For Bitcoin Bulls

Bitcoin broke through support and plunged to the lowest prices seen since 2020. However, despite all the fear the drop has caused, it could be the last low before the top cryptocurrency continues its bull run.

Here is why an extremely rare Elliott Wave expanding triangle pattern could be the last hope Bitcoin bulls have for new highs before a bear market.

Ralph Nelson Elliott And His Theory On How Markets Move

Ask most crypto investors and they would probably agree: we are in a bear market. However, based on the guidelines of Elliott Wave Theory, the last year and a half of mostly sideways could be part of one powerful, confusing, and rare corrective pattern.

Related Reading | One Coin, Two Trades: Why Bitcoin Futures And Spot Signals Don’t Match Up

Elliott Wave Principle was first discovered by Ralph Nelson Elliott in the 1930s. The theory believes all markets move in the direction of the primary trend in the same five-wave pattern. Odd-numbered waves move up with the primary trend as well, while even-numbered waves are corrective in nature that move against the trend.

Is Bitcoin trading in an expanding triangle? | Source: BTCUSD on TradingView.com

In the chart above, BTCUSD could potentially be trading in an expanding triangle. In Elliott Wave Theory, triangles of any kind only appear immediately preceding the final move of a sequence. During the bear market, a triangle appeared in place of the B wave before breaking down to the bear market bottom.

Identifying A Bullish Expanding Triangle Pattern

Triangles can contract, expand, descend, ascend, and even take on some “irregular” shapes. The expanding triangle pictured above and below should in theory only occur before the final wave five impulse up. If that’s the case, the bull run could continue once the bottom of the E wave is put in.

Each subwave is a Zig-zag similar to wave two  | Source: BTCUSD on TradingView.com

An expanding triangle is characterized as having five waves that sub-divide into ABCDE corrections. Waves A, C, and E are against the primary trend, while B and D waves are with the primary trend. Each sub-wave further sub-divides into three-wave patterns called a Zig-zag. Zig-zag patterns are sharper, and more commonly appear in wave two corrections.

The fact that an expanding triangle has five of these brutal corrections in two different directions makes it especially confusing and frustrating. Expanding triangles only form under the most unusual market conditions.

Related Reading | Bitcoin Bear Market Comparison Says It Is Almost Time For Bull Season

Extreme uncertainty drives expansive volatility in both directions. Both sides of the trade are repeatedly stopped out of trades, adding to frustration. By the end of the pattern, order books are thin and easily overpowered. Decidedly bearish sentiment squeezes prices up quickly causing an upward breakout of the pattern and continuation of the bull run. The chase and FOMO creates the conditions necessary for wave five.

Why Bitcoin Could Still Have Wave Five Ahead

The only problem is that there is no telling if this is the correct pattern, or if Bitcoin is in (or possibly just completed) a wave four according to Elliott Wave Theory. Knowing that triangles only appear before the final move of a sequence helps improve the changes of this expanding triangle being valid. However, it is more important to understand the characteristics of each wave.

Corrective waves result in ABC or ABCDE corrections (along with some more complex corrections) that move against the primary trend. Between corrections is an impulse wave up, in a five-wave stair-stepping pattern. After the bear market bottom, a new trend emerges starting with wave one. Wave two is often a sharp, Zig-zag style correction that retraces most of wave one.

A bear market will move below the zero line on the MACD  | Source: BTCUSD on TradingView.com

The lack of a new low creates the confidence for more market participants to join, making wave three the most powerful and extended of all. Wave four typically moves sideways and lacks the same severity of the wave two correction. Elliott said that wave four represents hesitancy in the market before finishing the trend. Both wave two and wave four tend to bring the MACD back down to the zero line before reversing higher – a setup clearly depicted above.

Related Reading | Bitcoin Indicator Hits Historical Low Not Seen Since 2015

When the hesitancy ends, wave five typically matches the length and magnitude of wave one. But after such a long and nasty wave four correction, any wave five has the potential to extend similar to wave three. If this were the case, the expanding triangle pattern created the perfect shakeout of both sides of the market.

Here is a 🧵 
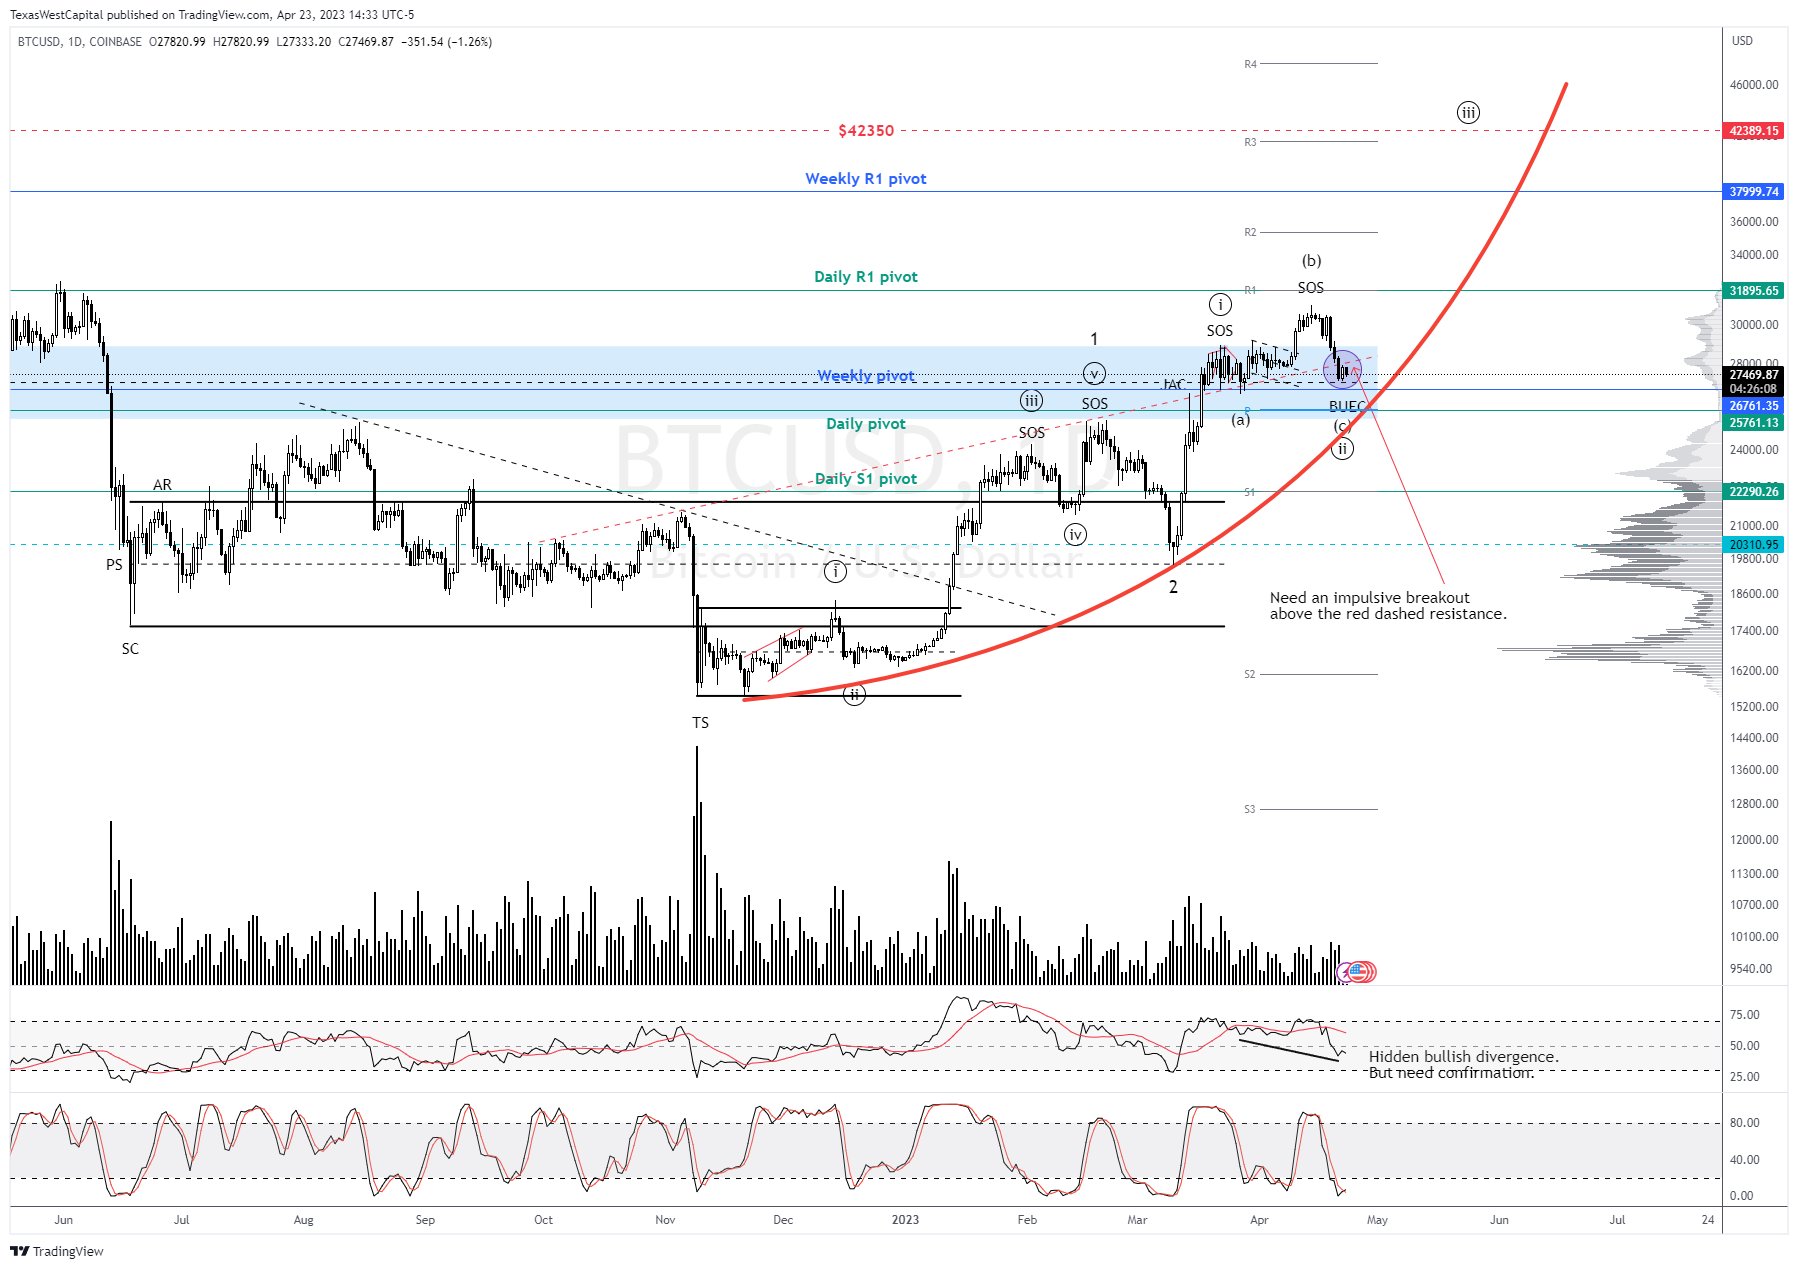
on my full Elliott Wave analysis on #Bitcoin and why I don’t believe there is a bear market – and why I expect the last leg up any day now.

— Tony "The Bull" Spilotro (@tonyspilotroBTC) May 15, 2022

Follow @TonySpilotroBTC on Twitter or join the TonyTradesBTC Telegram for exclusive daily market insights and technical analysis education. Please note: Content is educational and should not be considered investment advice.

Featured image from iStockPhoto, Charts from TradingView.com

Bitcoin Perfectly Follows Market Cycle Comparison, What Comes Next For Crypto?

Bitcoin price continues to stagnate and move sideways, but according to the cryptocurrency following an Elliott Wave market cycle, a break in the boredom is due soon.

Price action follows the predicted path so perfectly, that when layering Bitcoin directly over the comparison, there is little room for doubt about what comes next for crypto.  Take a look for yourself and decide.

All About Elliott Wave Theory And The Guideline of Alternation

Bitcoin is maturing with each passing bull cycle, but it remains a speculative asset. As such, narratives tend to drive the price action. When the cryptocurrency is bullish, it moves in a powerful parabolic impulse up. When things are bearish, the rollercoaster ride turns scary and many get ejected along the way.

Markets might seem like an unpredictable rollercoaster at times, but on several time scales, they can be quite predictable. In the 1930s, Ralph Nelson Elliott developed what he referred to as Wave Principle. According to Wikipedia, “Elliott stated that, while stock market prices may appear random and unpredictable, they actually follow predictable, natural laws, and can be measured and forecast using Fibonacci numbers.”

Related Reading | Now Or Never: Bitcoin Builds Base At Decade-Long Parabolic Curve

Today, the study is more commonly referred to at Elliott Wave Theory. Each “wave” has a specific type of characteristic and guidelines. Waves alternate between bullish and bearish phases. Odd numbered phases are impulse waves that move in the primary trend direction, while even numbered waves are corrective phases that move against the primary trend.

In addition to waves alternating between positive and negative growth, they also alternate in their degree of severity. And according to the Guideline of Alternation, one correction is typically sharp, while the other is flat or sideways. When this exact example is projected over Bitcoin price action the path ahead looks a lot more clear.

If Bitcoin continues to follow the path, what comes next? | Source: BTCUSD on TradingView.com
What Is Next For Bitcoin When The Flat-Style Correction Ends?

The length of each correction is also different, according to Elliott Wave Theory. Sharp corrections tend to be over with a lot faster than a flat-style correction, which painfully grinds sideways. The market itself still has a sort of post-traumatic bear market syndrome from the severity of the sharp style correction, that it is expects the market to behave in the same manner yet again.

Related Reading | Time Vs Price: Why This Bitcoin Correction Was The Most Painful Yet

However, according to the Guideline of Alternation, the probability of two of the same type of corrections is extremely low. In rare situations, two sideways corrections occur, but never two sharp corrections. This suggests that whenever Bitcoin price finally does turn around, the corrective wave four should be complete and the grand finale wave five will begin.

What happens after wave five is complete? Another bear market, and likely the worst and longest in the history of Bitcoin.

Follow @TonySpilotroBTC on Twitter or join the TonyTradesBTC Telegram for exclusive daily market insights and technical analysis education. Please note: Content is educational and should not be considered investment advice.

Featured image from iStockPhoto, Charts from TradingView.com

2022: The Year The Secular Bitcoin Bull Run Could End

When the December 31, 2021 candle came to a close in Bitcoin, it didn’t just begin a new calendar year – it triggered a sell setup of epic proportions. Here is why the secular bull run in cryptocurrency could come to an end this year, and the first true bear market emerge.

Bitcoin Yearly Chart Triggers First Ever Sell Setup

You wouldn’t know it based on the recently bearish price action, but Bitcoin has been in an ongoing bull market since the second the genesis block was generated exactly thirteen years ago today.

In the span of a normal childhood growing into a teenager, the price per coin has ballooned and bubbled its way from zero to $68,000 per BTC.

Related Reading | Point & Figure: The Chart That Makes Bitcoin Support Cut And Dry

The trajectory hasn’t always been up, as the price chart has shown, but the asset has been outrageously bullish nonetheless. Many indicators back up this theory, having never crossed into bear territory ever once since price was recorded.

For example, the monthly MACD hasn’t made it below the zero line since 2015 despite the 2018-2019 “bear market.” The monthly Directional Movement Index had only a month-long temporary bear cross around mid-2015, but aside from that has never been bearish for an extended phase.

However, the sequence of ups and downs experienced over the years, like any thirteen-year-old would experience, has resulted in a specific sell setup according to the TD Sequential. The tool is a market timing indicator developed by Thomas DeMark – which on other timeframes has been useful in calling reversals.

The signal that makes you want to scream “nine!” | Source: BTCUSD on TradingView.com

At thirteen years since the asset’s debut, the first ever TD9 sell setup has appeared on the BTCUSD yearly price chart. On the TradingView BTCUSD Index, price action began in 2010. Bear market years of 2014-2015 and 2018-2019 excluded, there have been exactly 9 candles with a higher open than the previous candles – triggering the sell setup.

Theorizing The End Of The Secular Bull Run

Despite the ominous signal, all is not lost for the current bull cycle – although it does give more credence to another bull market-ending pattern that could be developing.

According to Elliott Wave Theory, markets grow in five waves. These five impulse waves are broken down into similarly-behaving sub-waves that alternate between uptrend and corrective phases. In the larger cycle, these corrective phases are what we call bear markets. In smaller timeframes, corrections often feel just as severe as the current sentiment would confirm.

The good news and the bad news in one chart | Source: BTCUSD on TradingView.com

Bitcoin appears to be well into its fifth impulse wave in the major motive wave cycle. The current count would suggest that the cryptocurrency is also within wave four of five sub-waves, hinting that the grand finale should unfold the in the year ahead.

Related Reading | Bitcoin Falls Flat: Examining A Rare Bull Market Corrective Pattern

If Bitcoin price does make it to $100,000 or higher, given the TD9 sell setup on the yearly, and the potential wave structure, this might be a sell signal worth taking. But when?

Follow @TonySpilotroBTC on Twitter or join the TonyTradesBTC Telegram for exclusive daily market insights and technical analysis education. Please note: Content is educational and should not be considered investment advice.

Featured image from iStockPhoto, Charts from TradingView.com