The ether-bitcoin ratio rose more than 2% past week in a gain that’s inconsistent with its record of taking losses during bouts of risk aversion.
Ethereum Co-Founder Vitalik Buterin Sends $1M ETH to Coinbase
Vitalik Buterin transferred over $1 million worth of ether to crypto exchange Coinbase on Monday.
Ethereum Co-Founder Vitalik Buterin Sends $1M ETH to Coinbase
Vitalik Buterin transferred over $1 million worth of ether to crypto exchange Coinbase on Monday.
Friend.tech Becomes Massive Ether Money Machine as NBA Players, FaZe Clan Join In
The application has zoomed to becoming the second-largest revenue maker among crypto protocols in just over two weeks.
Bitcoin Plunged 11% in Worst Week Since FTX’s Collapse. What’s Next for BTC’s Price?
BTC slipped below $26,000 amid the crypto market mayhem.
Single Trader Lost $55M on Ether Long Yesterday
That was nearly 30% of all liquidated futures on Binance, the data shows.
Crypto Traders Suffer $1B in Liquidations in Sharp Sell-Off for Bitcoin, Ether
Crypto markets cratered late Thursday with bitcoin (BTC) dropping as low as $25,000 on the crypto exchange Binance.
Ether Futures ETFs Are Poised for U.S. Approval, Bloomberg Reports
They would join bitcoin futures ETFs that are already approved.
Riding The Storm: THORChain 50% Rally Shines As Top 100 Coins Falter
Within the dynamic cryptocurrency environment, THORChain (RUNE) has emerged as a notable altcoin, capturing the interest of investors who are actively pursuing methods to augment the diversification of their investment portfolios.
In conjunction with the established entities such as Bitcoin and Ethereum, the cryptocurrency market has experienced significant growth with a diverse range of alternative coins, each presenting unique attributes and prospective prospects.
Altcoins, which comprise a diverse array of technological advancements, application cases, and governance frameworks, provide investors a wide range of options to consider.
THORChain Emits Force In The Weekly Chart
THORChain (RUNE), renowned for its cross-chain liquidity mechanism, has garnered significant attention this week due to a different factor.

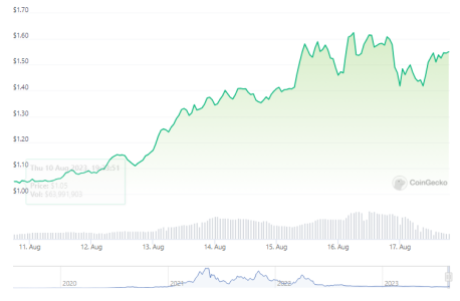
According to statistics from Coingecko, THORChain is currently priced at $1.54, reflecting an increase of 50% over the past seven days. However, it has had a decline of 3.7% within the last 24 hours.
The boost in price can be attributed to a concurrent rise in the social volume of the THORChain cryptocurrency. According to data from Coincodex, there was a significant increase in social volume, exceeding 4,300%, during the period from August 7 to 13.
The price of RUNE has exhibited a bullish trend since the middle of June. However, this upward movement was interrupted when the price above the $1 threshold and subsequently began to undergo a retracement.
The price of the cryptocurrency established a support level at $0.92 following a significant decline, then initiating a bullish recovery to surpass the prominent psychological threshold of $1.
In the preceding month, the cryptocurrency had a notable increase of 30%, while also exhibiting a 5% rise since the commencement of the year 2023. Nevertheless, the performance of the subject over an extended period of time presents a more pessimistic portrayal.
Over the course of the previous four quarters, there was a significant decline of around 50% in the value of the coin, suggesting the presence of inherent instability.
Moreover, the cryptocurrency has experienced a significant decline of 94% from its peak value of $20.87 in May 2021, highlighting the fundamental instability of the cryptocurrency market.
RUNE Faces Resistance At $1.55
Although there have been recent positive developments that may be encouraging for investors with short-term goals, the overall trend indicates that there have been challenges over longer time periods.
The significant declines observed in the past year, as well as from the highest point, underscore the precarious nature of cryptocurrency investments. This necessitates a careful evaluation of their long-term viability within a dynamic market environment.
At present, the RUNE token is undergoing a phase of surpassing the significant resistance level of $1.55, which has persisted for an extended period of time. This particular domain holds significant importance as it has alternately functioned as both a point of opposition and reinforcement from the onset of the year 2021.
Hence, the act of closing above it will serve as a significant indication of a positive trend, thereby reinforcing the bullish readings observed on the daily timescale.
As the liquidity mechanism for THORChain may develop over the next few months, cryptocurrency experts anticipate even further price hikes for the platform. Additionally, 14 new nodes are prepared to join the THORChain network, according to CoinCodex.
(This site’s content should not be construed as investment advice. Investing involves risk. When you invest, your capital is subject to risk).
Featured image from Asia Crypto Today
CME Group to launch BTC, ETH reference rates aimed at Asia’s investors

CME reported nearly half of its crypto volume year to date came from non-U.S. trading hours and around 11% from the Asia Pacific region.
Crypto Long Trades Account for 90% of Total Liquidations as Bitcoin, Ether Slump
One trading firm has a price target of as low as $24,000 in the coming months in the absence of immediate market catalysts.
Bitcoin Slips to $29K, but Fundstrat’s Tom Lee Sees $150K on ETF Approval
Altcoins are leading declines, with majors like DOGE, SOL and MATIC shedding 6-7% in the past 24 hours.
First Mover Asia: Bitcoin Steady Below $30K as SBF Goes Back to Jail
PLUS: The tragicomedy of Sam Bankman-Fried continued on Friday with the revocation of his bail. Even before the decision, CoinDesk columnist David Morris explained why the decision was predictable.
First Mover Asia: SEC Appealing XRP Ruling Isn’t Moving Markets
Ethereum: Historical Playbook Points To $3,800 In Coming Months
Renowned analyst Josh Olszewicz has shared some compelling insights on Ethereum’s price trajectory. Drawing parallels from historical patterns, Olszewicz’s analysis suggests that Ethereum might be gearing up for a significant rally in the coming months.
Historical Pattern: Ethereum Forms Ascending Triangle
Olszewicz starts by highlighting Ethereum’s current price pattern, jokingly stating, “Ethereum: ascending triangle 450 million years in the making w/fib extensions to $3k.” This ascending triangle, characterized by a flat top and rising bottom, has been forming since May 2022, and if history is any guide, it could be a bullish sign for Ethereum.
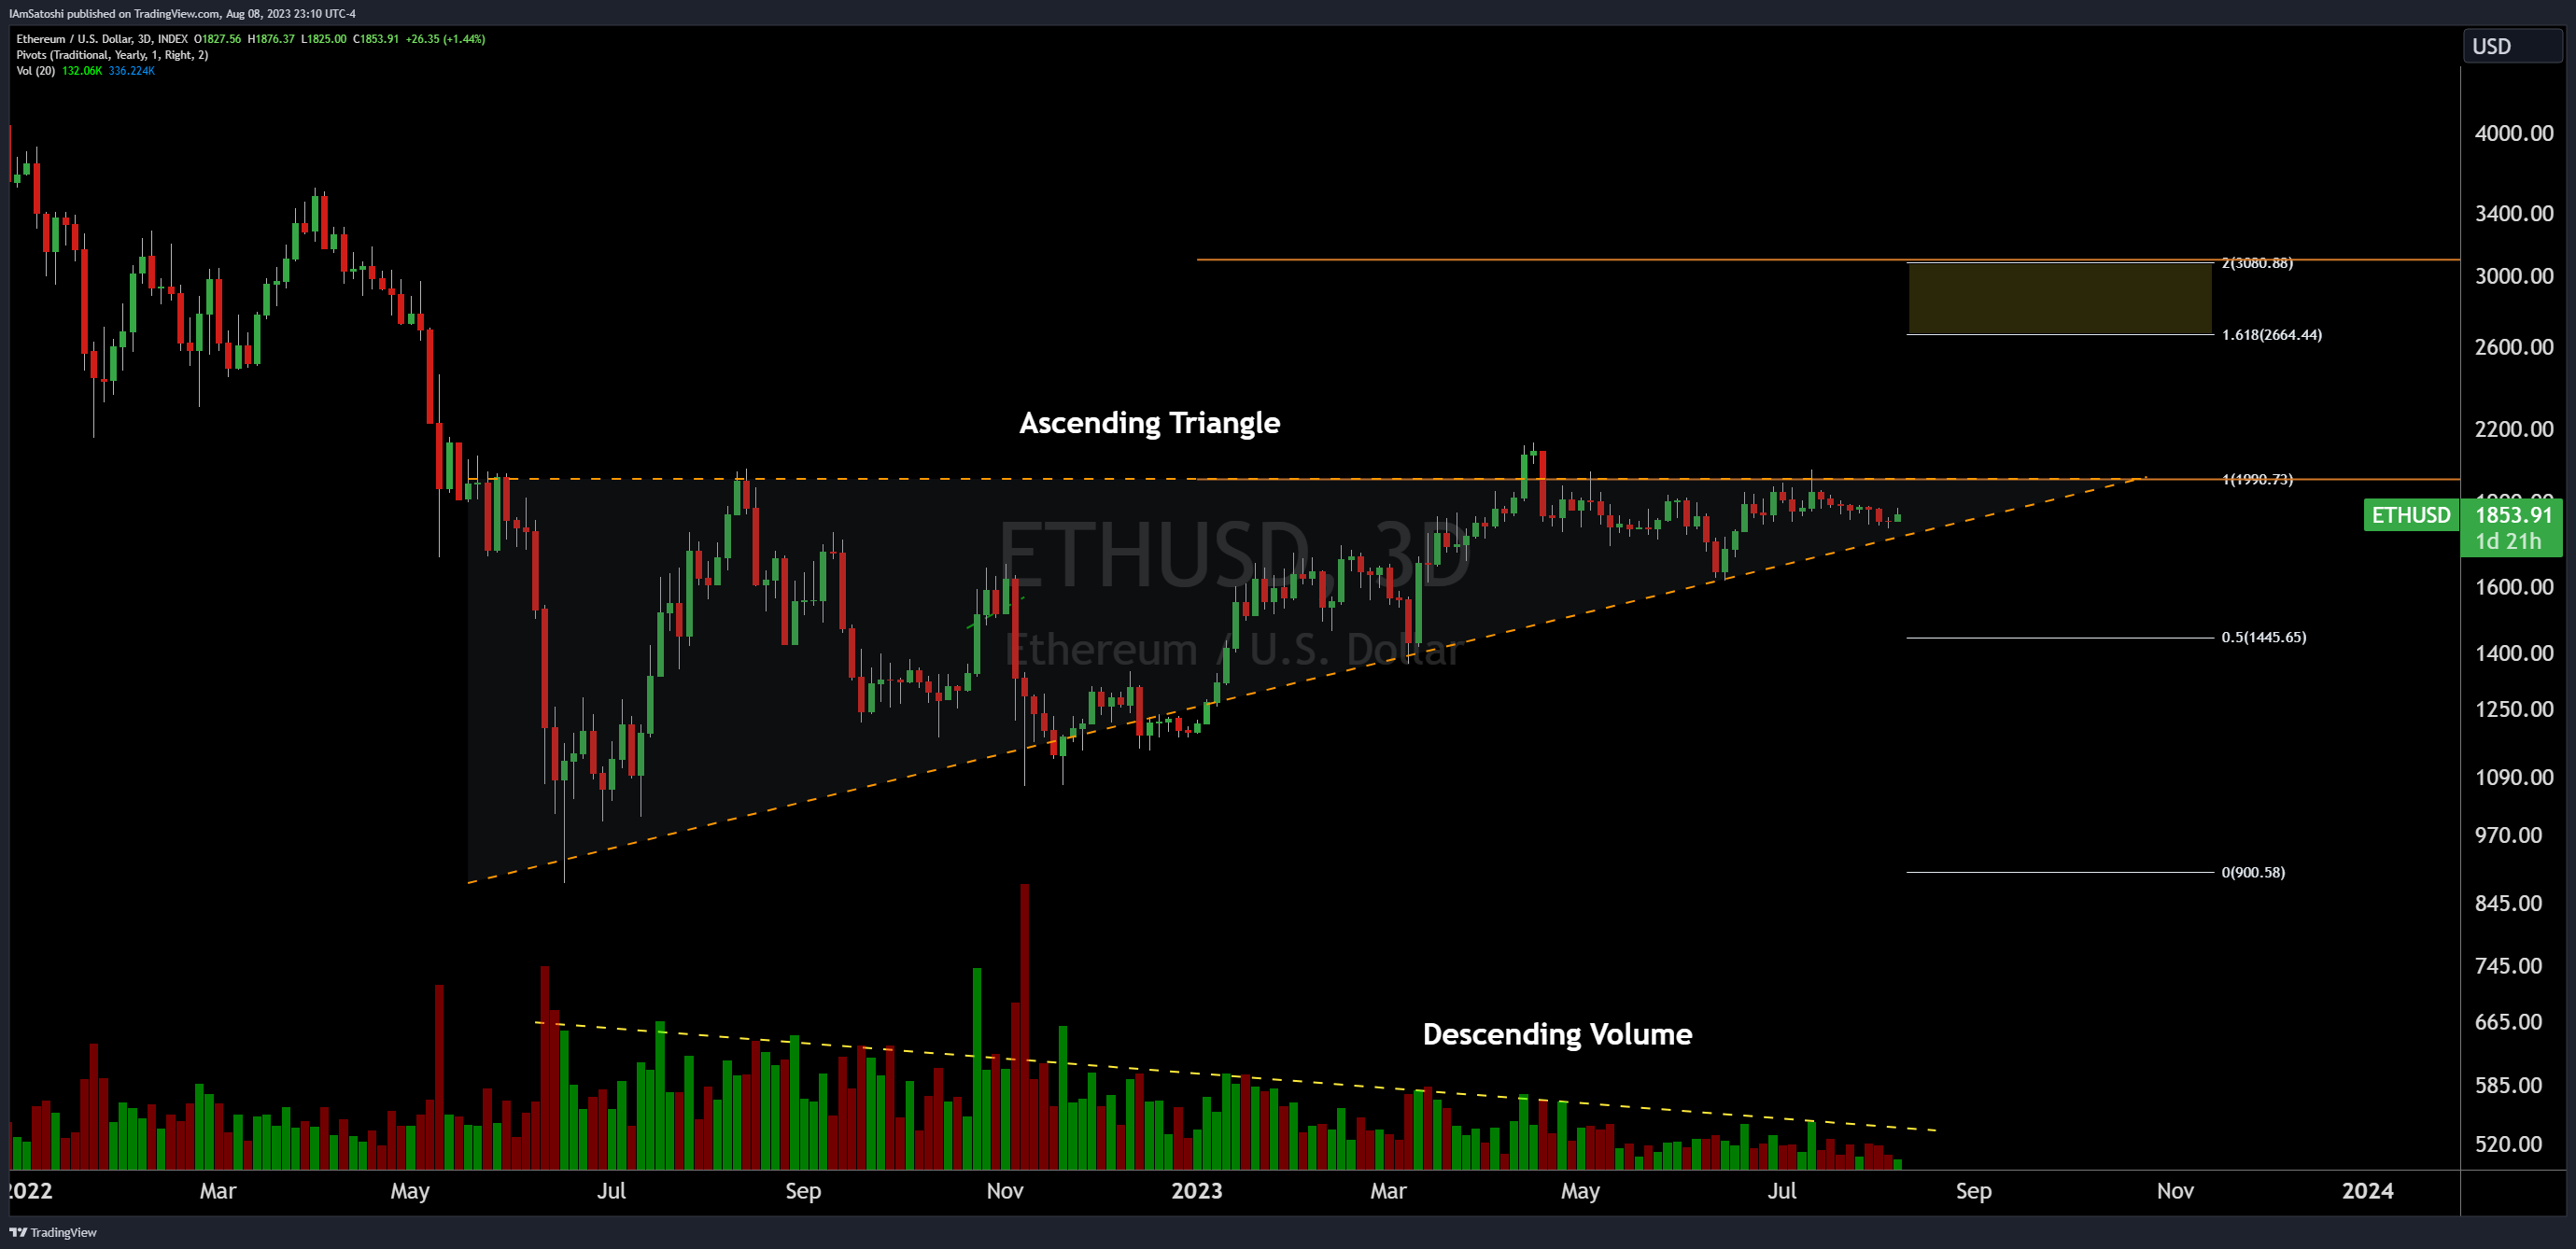
Descending volume, another feature of this pattern, further strengthens the bullish bias. However, Olszewicz cautions that the “bias remains bullish until price breaks below diagonal support.” He also points out the psychological resistance at $2,000, noting it as an “extremely obvious signal that it’s go time, which should help the breakout.”
To bolster his analysis, Olszewicz draws parallels from Bitcoin’s past. He recalls, “take BTC in 2015/2016 [the price formed an ascending triangle for 210 days with descending volume] and BTC in 2018/2019 [ascending triangle for 130 days with descending volume] as examples.” In both instances, Bitcoin surged towards the Fibonacci extension levels post the breakout.
Ethereum itself isn’t a stranger to such patterns. Olszewicz cites, “ETH has also had previous examples in 2017 (bullish continuation) and 2019 (bullish reversal).” Each ascending triangle pattern lasted 180 days. Both times ETH surged towards the 2.618 Fibonacci extension level.
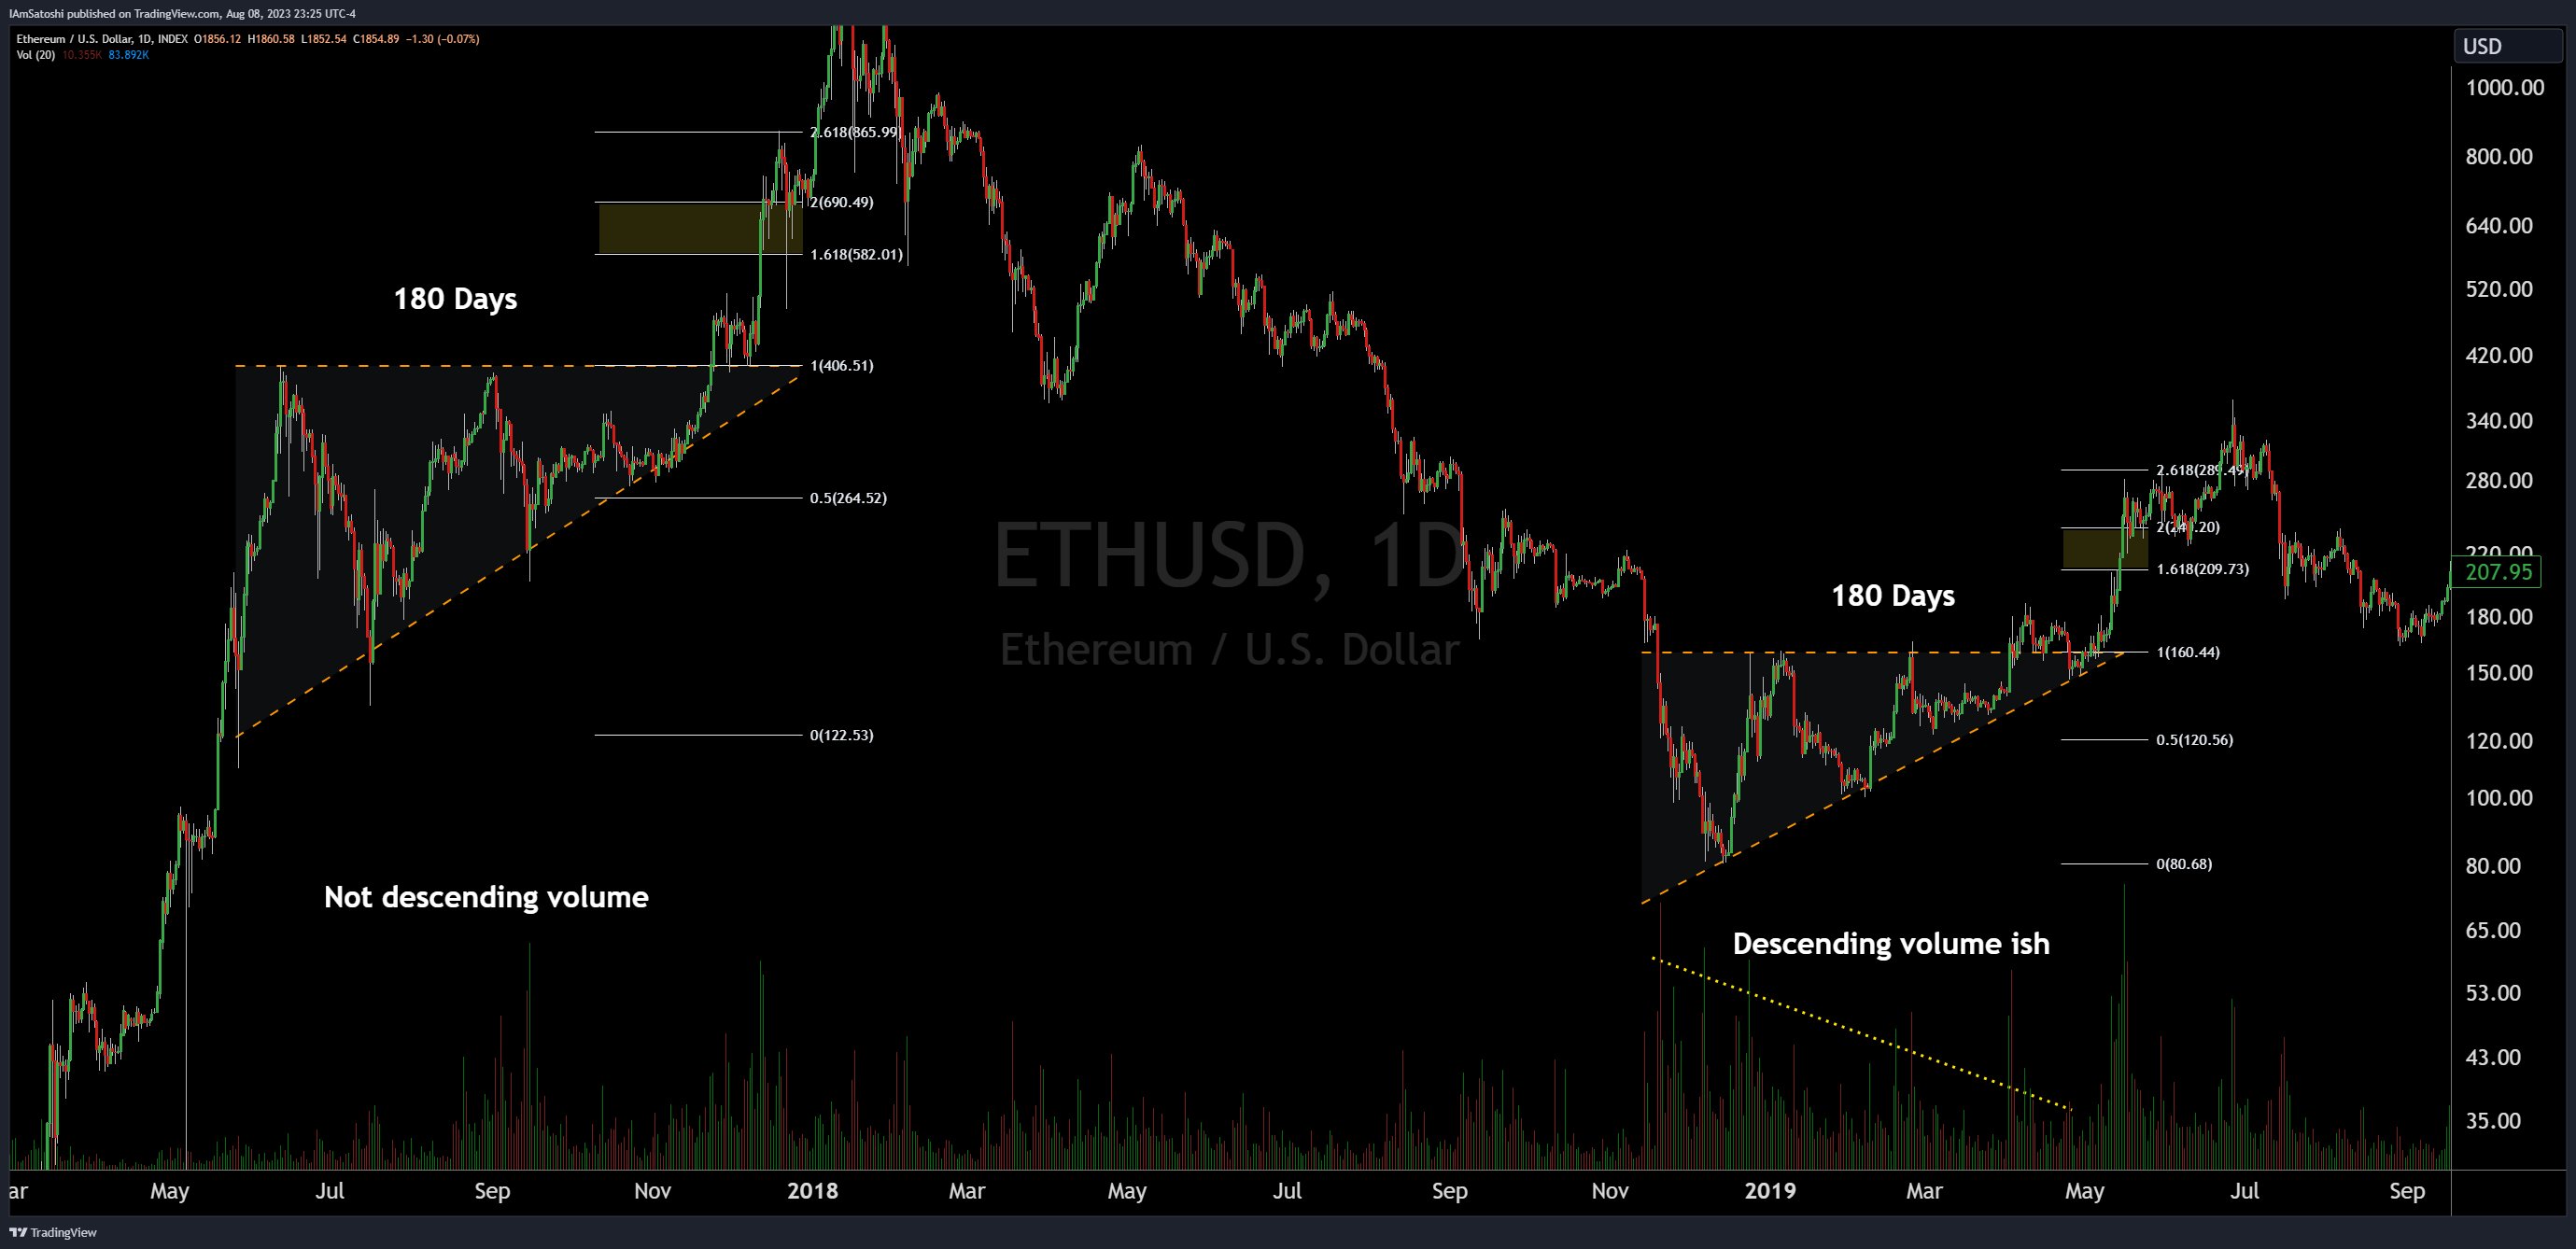
Drawing from these historical patterns, Olszewicz suggests that Ethereum is currently holding the potential to overshoot the 1.618 Fibonacci level and possibly reach the 2.618 level, which translates to a price of $3,800. However, he wisely advises, “but don’t get out the imaginary profit calculator just yet, let’s break $2k first.”
ETH vs. BTC: Which One Is The Better Trade?
While Ethereum’s potential rally is intriguing, Olszewicz also delves into its performance relative to Bitcoin. He observes that Ethereum has underperformed Bitcoin year-to-date, attributing this to the ETF narrative and Bitcoin’s dominance as hard money. He speculates, “the better trade may continue to be BTC/USD, especially with initial spot ETF inflows favoring BTC.”
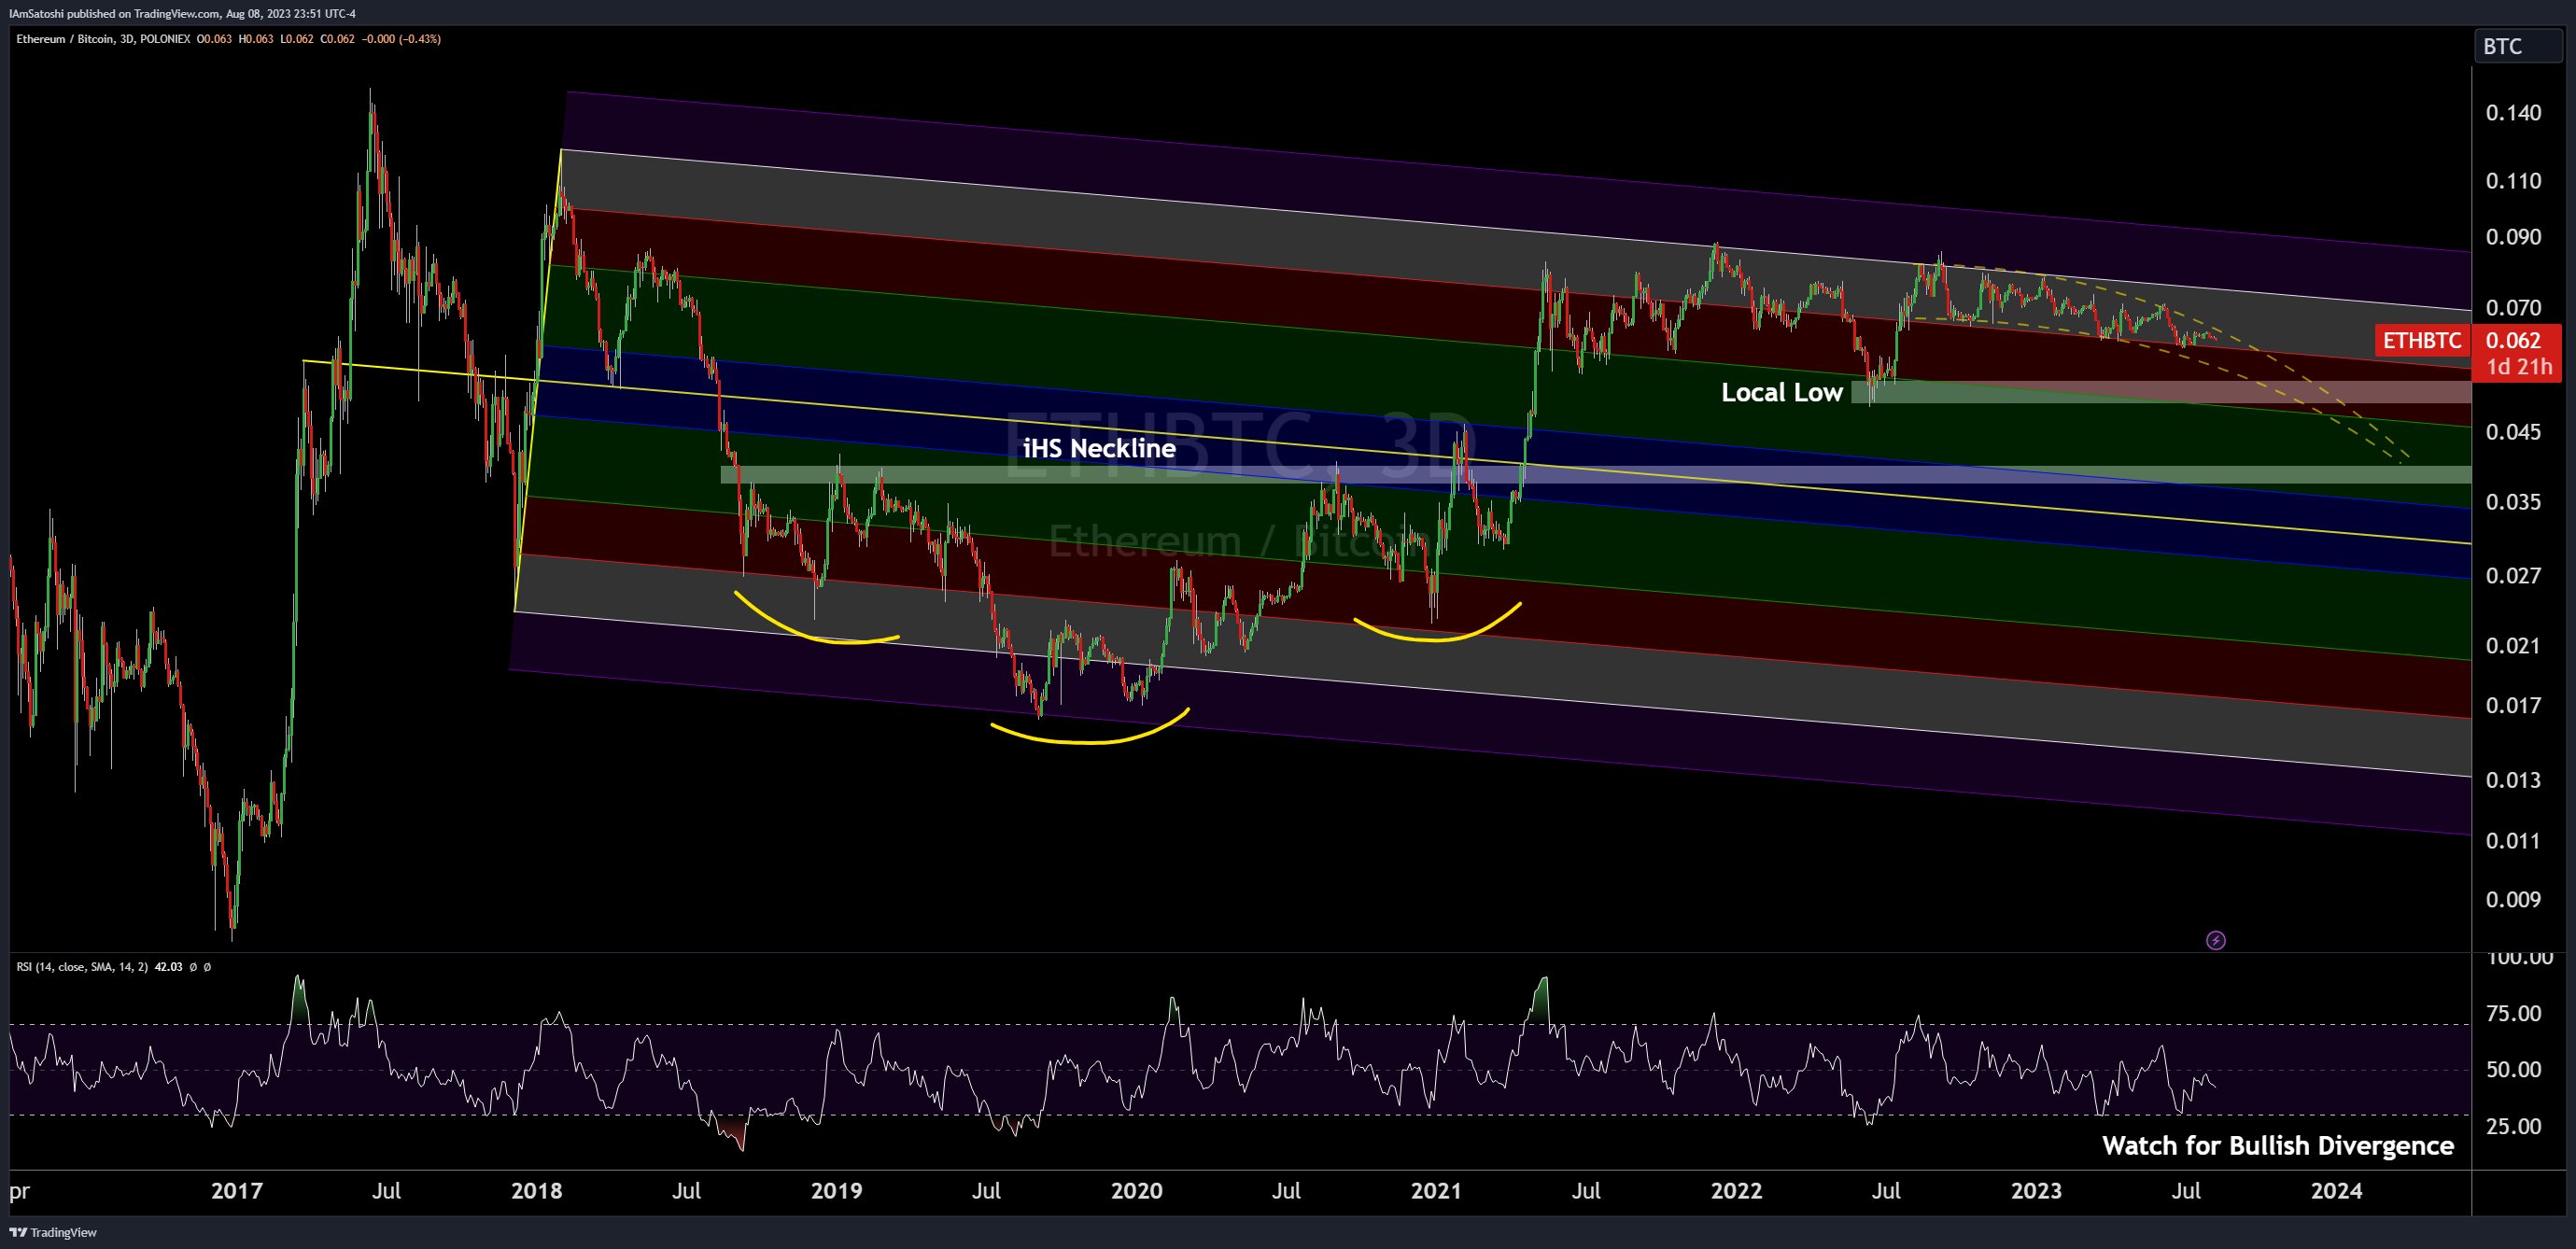
However, if the ETH/BTC pair can break and sustain new highs, it might hint at a runaway trade for Ethereum. But Olszewicz remains skeptical, stating it’s “unlikely based on ETF flows.”
Olszewicz also doesn’t shy away from discussing potential bearish scenarios. He’s closely watching certain bearish ETH/BTC levels, including the current local low at 0.050 and the previous inverse head and shoulders neckline at 0.039.
For Bitcoin, he suggests a potential move to $42,000, provided it maintains certain bullish conditions. He notes, “as long as we can maintain prices above the midline of the PF & stay in the cloud, we have a decent shot at reaching $42k before halving.”
Wrapping up his analysis, Olszewicz envisions a dream trade where Bitcoin breaks bullish first, possibly due to technicals or a spot ETF approval. In this scenario, Ethereum breaks $2,000 but lags behind Bitcoin, leading to ETH/BTC getting “crushed, allowing for an eventual profit taking rotation from Bitcoin to Ethereum”. However, he concludes with a word of caution: “without inflows, we ain’t movin.”
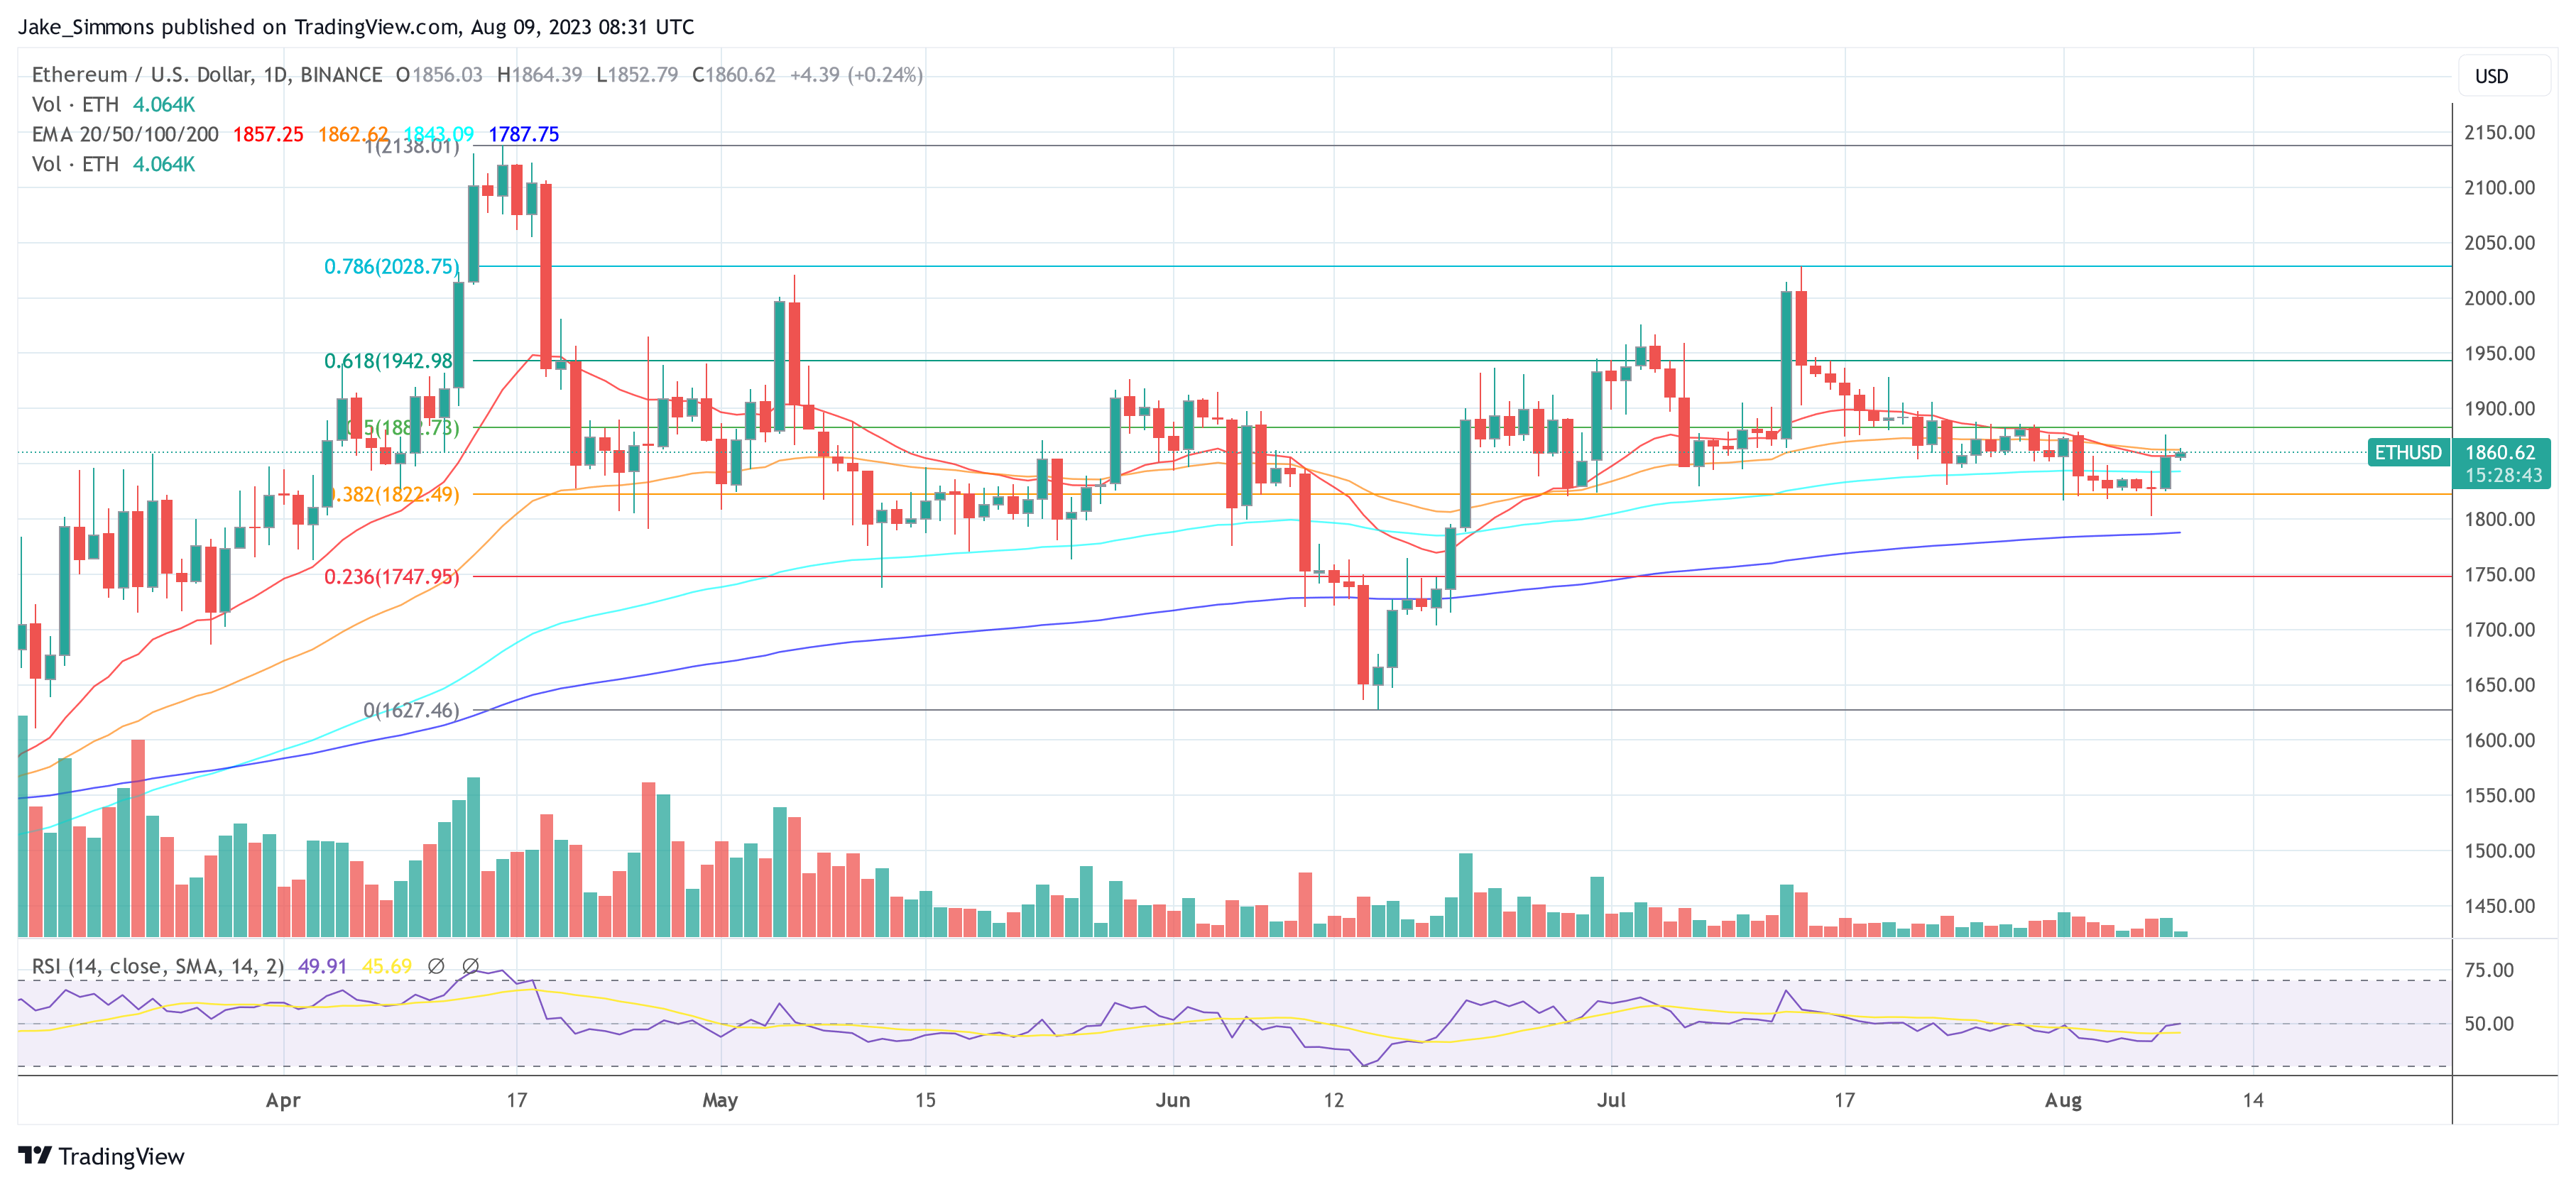
At press time, ETH traded at $1,860.
First Mover Asia: What Will Make Bitcoin Reach $30K?
Crypto Options Volume on CME Rose to Nearly $1B in July: CCData
The increase in BTC options volume on the CME suggests that institutions might be hedging their positions.
ProShares Files Application With SEC for Bitcoin and Ether Equal Weight ETF
If approved, the fund will measure “the performance of holding long positions in the nearest maturing monthly bitcoin and ether futures contracts.”
First Mover Asia: Bitcoin Remains Calm Above $29.1 K but Is Higher Volatility in Its Future?
PLUS: A decrease in bitcoin supply active a year ago indicates that long-term holders have reduced their bitcoin exposure. Is hodling starting to wane?
Ether Liquid Staking Protocols Could Double in 2 Years: HashKey
The amount of staked ether could reach between 31%-45% of the total supply by the end of Q2 2025.


