Ethereum Bearish Falling Wedge Pattern Appears, How Low Can Price Go?

Ethereum has followed the general trend of Bitcoin over the last few weeks and when the asset dipped from its 2023 peak, so did the price of ETH. Following this decline in price, a worrying pattern has appeared on the ETH chart known as a falling wedge pattern. This was brought to light by crypto analyst Alan Santana, who has painted a grim picture of what this could mean for Ethereum.

Ethereum Falling Wedge Pattern Is Bearish

In the analysis posted on the TradingView website, Alan Santana explains that the appearance of this falling wedge pattern does not bode well for the Ethereum price. Apparently, the ETH chart had formed a perfect rising wedge which eventually broke bearish. Given this, the crypto analyst explains that it shows that the Ethereum price is moving alongside the rest of the crypto market in a “normal but fast correction.”

The crypto analyst also backs up their analysis with the Ethereum Moving Average Convergence/Divergence (MACD) indicator. In the chart shared by the analyst, there is a clear decline in the MACD on the daily chart, which lends credence to the bearish pressure mounting on ETH.

Ethereum price chart from Tradingview.com

Furthermore, using the Relative Strength Index (RSI) on the daily chart as well, there is also a clear decline. The RSI has apparently already lost its trend line support and is now moving below 50. The simple fact suggests a turn toward the bearish direction for the cryptocurrency.

Santana explains that these indicators show that the bias toward a downward spiral is strong, especially since it has already seen a double-top pattern. “Volume continues to drop, the calm before the storm. Slowly, slowly down… Nothing is happening, everything is good then Boom!” the analyst warns.

Ethereum price chart from Tradingview.com

Price Targets For ETH’s Bearish Formation

From the chart posted in the analysis, the crypto analyst seems to expect at least a 20% drawdown for Ethereum following the double-top formation. Now, the chart puts the double top formation when the asset’s price briefly touched the $2,400 level last week.

After that, expectations have quickly gone in the opposite direction and as the formation plays out, the crypto analyst sees a decline to at least $1,800 from here. If further downside follows, then Santana expects that there will be more drawdowns that will end somewhere around $1,600.

The Ethereum price is still trending around $2,200 at the time of writing, suggesting the bear pressure is still mounting. If it breaks down from here, then Santana’s prediction could prove right and ETH’s price could fall back to mid-October levels.
Ethereum Whales Scoop Up $230 Million In ETH In One Week – Price Hike Next?

In the past week, some of the biggest Ethereum whales, those with holdings ranging from 1 million to 10 million ETH, have accumulated an impressive 100,000 ETH, valued at a staggering $230 million.

This active buying stance by influential investors highlights their unwavering belief in the long-term potential of Ethereum, even in the face of recent price corrections.

Despite the recent downtrend in prices, indications from recent Ethereum whale activities suggest a persistent confidence in a bullish market continuation.

Wealthy Traders Accumulate Millions In Ethereum

Subsequent to the promising start in the initial days of December 2023, various cryptocurrency assets, notably Ethereum, displayed robust performance.

Crypto whales have reportedly devoured hundreds of millions of dollars’ worth of Ether, the leading altcoin, during the past seven days, according to a well respected expert.

On the social networking site X, cryptocurrency strategist Ali Martinez informs his 36,100 followers in a new thread that wealthy traders have amassed tens of thousands of Ethereum during the previous seven days.

Price rallies are usually the result of heavy purchasing demand from wealthy investors, and the recent whale accumulation indicates that this is the case.

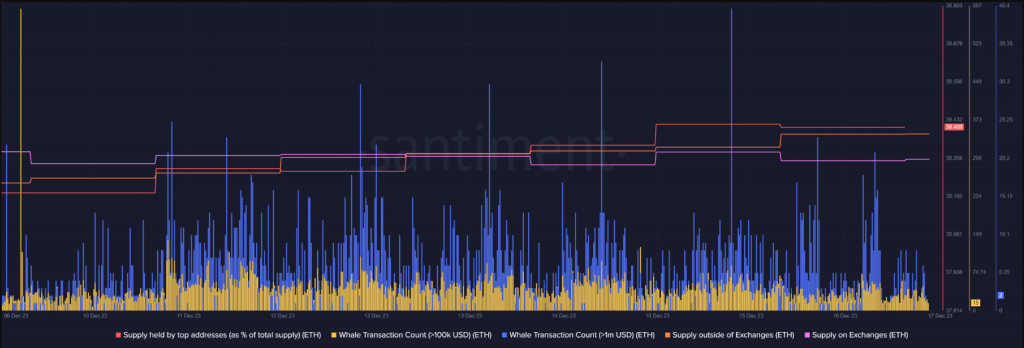
On December 7, Santiment Feed connected a whale accumulation pattern to ETH’s surge, which culminated in a 19-month high over the $2,350 price point.

As a rule, whale activity affects cryptocurrency asset prices. Recent activity among ETH whales indicates that a price rally may be approaching.

Although there is a lot of buying pressure in the market right now, caution is advised because the bottom could not have yet been achieved.

RSI And Stochastic Neutral, Ethereum Uncertainty

Relative Strength Index (RSI) and stochastic are both currently in neutral territory, according to data from CryptoQyant. There is still uncertainty regarding the market’s genuine bottom notwithstanding the buying activity.

We looked at the liquidation heatmap to try and estimate Ethereum’s possible support levels. Based on the analysis, there was a rise in liquidations in the $2,140–$2,170 range.

This implies that before Ethereum’s price initiates its next bullish rebound, it is likely to drop below these levels. But in the event of a rally, Ethereum would have to overcome a significant resistance level close to $2,380.

Ethereum’s near-term price changes are difficult to forecast because to the complex interaction of market indicators and liquidation data.

Meanwhile, the $2,148 price mark appears to be the asset’s short-term support, according to an analysis of the ETH daily price chart. In order to increase the likelihood of one more rise before the end of 2023, bulls will hope that this level holds.

If there is a break below, it may indicate the construction of a more intricate bullish continuation chart pattern, similar to a bull flag. On smaller time frames, this pattern may resemble a descending channel and undermine expectations for another significant rise in 2023.

Ether and other cryptocurrency values are sensitive to a number of external variables, including generalized macroeconomic sentiment. Ethereum has already risen 81% year-to-date at its current price.

Featured image from Shutterstock

Ethereum Price Restarts Increase But Can Bulls Turn It Into Rally?

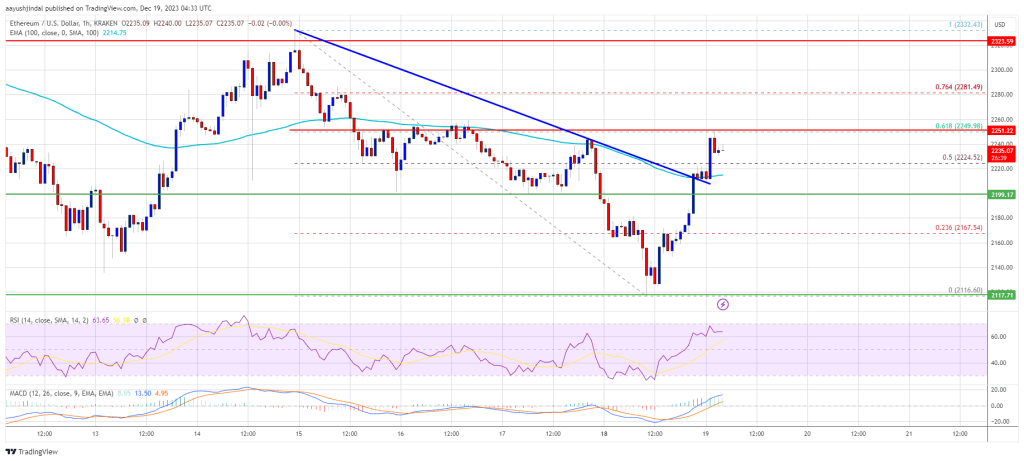
Ethereum price is recovering losses from the $2,120 support. ETH is up over 3% and the price could gain pace if it clears the $2,250 resistance.

  • Ethereum is moving higher from the $2,120 support zone.
  • The price is trading above $2,200 and the 100-hourly Simple Moving Average.
  • There was a break above a key bearish trend line with resistance near $2,210 on the hourly chart of ETH/USD (data feed via Kraken).
  • The pair could climb further higher if it clears the $2,250 resistance zone.

Ethereum Price Restarts Increase

Ethereum price extended its decline below the $2,150 level. ETH remained strong above the $2,120 level. A low was formed near $2,116 and the price started a fresh increase, like Bitcoin.

There was a move above the $2,150 and $2,200 resistance levels. The price climbed above the 50% Fib retracement level of the downward move from the $2,332 swing high to the $2,116 low. There was also a break above a key bearish trend line with resistance near $2,210 on the hourly chart of ETH/USD.

Ethereum is now trading above $2,200 and the 100-hourly Simple Moving Average. On the upside, the price is facing resistance near the $2,250 level. It is close to the 61.8% Fib retracement level of the downward move from the $2,332 swing high to the $2,116 low.

Ethereum Price

Source: ETHUSD on TradingView.com

The next key resistance is near the $2,280 level. A clear move above the $2,280 zone could send the price toward the $2,330 level. The next resistance sits at $2,400. Any more gains could start a wave toward the $2,550 level, above which Ethereum might rally and test the $2,750 zone.

Another Decline in ETH?

If Ethereum fails to clear the $2,250 resistance, it could start another decline. Initial support on the downside is near the $2,210 level or the 100 hourly SMA.

The first key support could be the $2,200 zone. A downside break and a close below $2,200 might start another major decline. In the stated case, Ether could revisit the $2,120 support. Any more losses might send the price toward the $2,000 level in the coming days.

Technical Indicators

Hourly MACDThe MACD for ETH/USD is gaining momentum in the bullish zone.

Hourly RSIThe RSI for ETH/USD is now above the 50 level.

Major Support Level – $2,200

Major Resistance Level – $2,250

Crypto Funds’ 11-Week Inflow Streak Snapped: Bitcoin Faces $33M Exodus As Altcoins Shine

The crypto investment landscape has experienced a notable shift recently, as digital asset investment products saw their first net outflows in 11 weeks. This development was predominantly led by Bitcoin, which had previously enjoyed a consistent inflow into various crypto funds.

In a recent report by CoinShares, a leading digital asset management firm, last week marked a break in an 11-week streak of inflows, with a net outflow of $16 million. This change signals a potential reevaluation among investors regarding their positions in digital assets.

Bitcoin Funds Encounter Turbulence

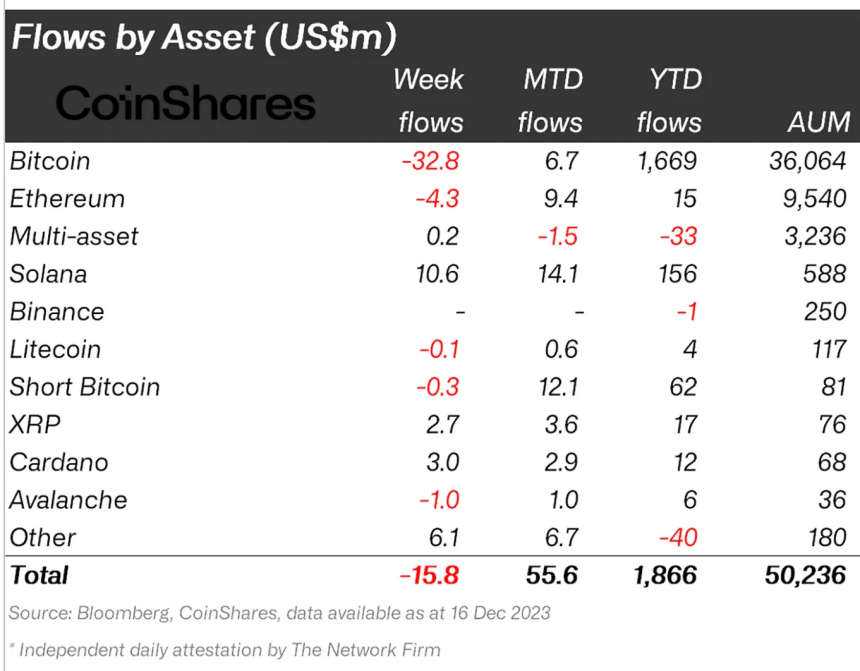
Bitcoin-based funds were at the forefront of this movement, experiencing significant outflows. Last week, these funds experienced a net outflow of $32.8 million, while short Bitcoin investment products also saw a minor outflow of $300,000.

Despite this, trading activity for Bitcoin remained robust, grossing $3.6 billion last week, substantially higher than the $1.6 billion yearly average.

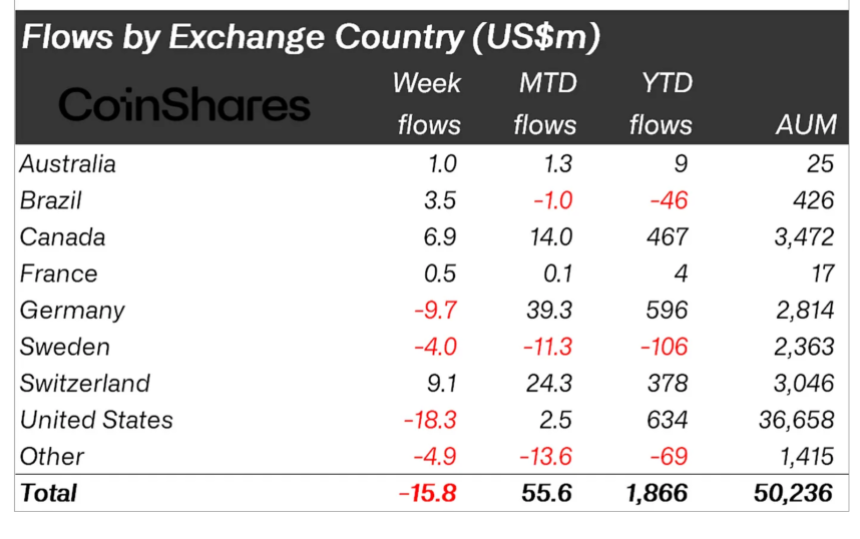
James Butterfill, Head of Research at CoinShares, analyzed the outflows and suggested that the net flows were primarily driven by the US and German markets, which saw outflows of $18.3 million and $9.7 million, respectively.

In contrast, markets such as Switzerland and Canada saw inflows, indicating a mixed regional response that leans more towards profit-taking rather than a wholesale sentiment shift in the asset class, according to Butterfill.

Crypto asset flows by country.

Altcoins Gain Traction As Blockchain Equities Surge

Interestingly, while Bitcoin and other major assets like Ethereum and Avalanche experienced outflows, altcoins such as Solana, Cardano, and XRP bucked the trend. They mainly registered inflows of $10.6 million, $3 million, and $2.7 million, respectively.

Crypto asset flows.

These movements underscore the diversification within the crypto asset class and highlight investor interest in a broader range of digital currencies beyond the dominant Bitcoin and Ethereum.

Blockchain equities also reflected a favourable sentiment, with inflows amounting to $122 million last week. This marks the continuation of a nine-week streak, accumulating $294 million in total — the largest streak to date.

This uptick in blockchain equities underscores the growing investor confidence in the technological infrastructure underpinning cryptocurrencies.

Regarding price performance, the past week saw mixed results among top crypto assets. While Bitcoin recorded a relatively modest decline of 1.8%, XRP and Ethereum saw more significant drops of 4.4% and 3.7%, respectively.

Bitcoin (BTC) price chart on TradingView

Conversely, altcoins such as Solana, Cardano, and Avalanche showcased appreciable gains. Avalanche led the pack with an increase of over 10% in the past week, followed by Solana and Cardano with gains of 3.1% and 3.6%, respectively.

Featured image from iStock, Chart from TradingView

Ethereum Price Key Indicators Suggest Strong Case For Correction Below $2K

Ethereum price is again moving lower below the $2,200 support. ETH is showing a few bearish signs and might decline further below $2,000.

  • Ethereum started a fresh decline from the $2,330 resistance zone.
  • The price is trading below $2,220 and the 100-hourly Simple Moving Average.
  • There is a connecting bearish trend line forming with resistance near $2,210 on the hourly chart of ETH/USD (data feed via Kraken).
  • The pair could accelerate lower if there is a break below the $2,135 support.

Ethereum Price Dips Again

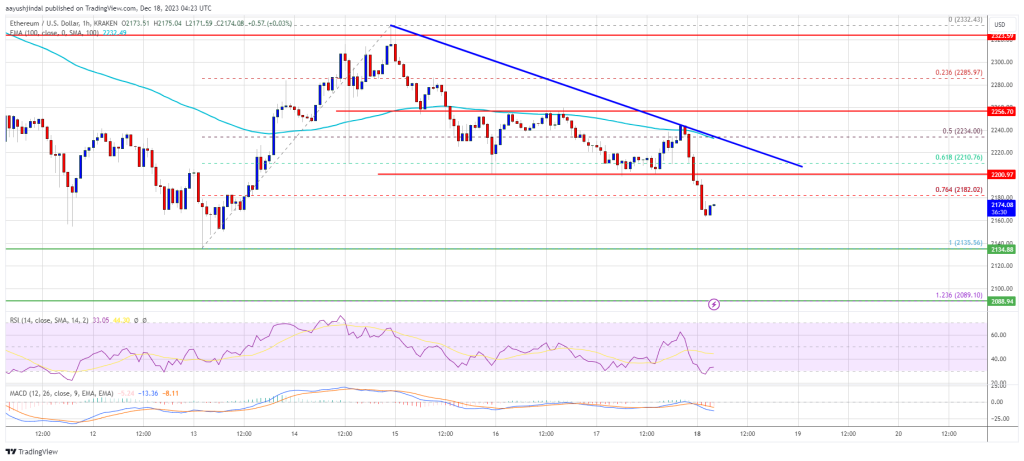
Ethereum price failed to gain strength for more gains above the $2,300 resistance. ETH peaked near the $2,330 zone and started a fresh decline, like Bitcoin.

There was a move below the $2,250 and $2,220 levels. The price even dropped below the 50% Fib retracement level of the key increase from the $1,980 swing low to the $2,330 high. The bears are now in control below the $2,180 support zone.

Ethereum is trading below $2,220 and the 100-hourly Simple Moving Average. There is also a connecting bearish trend line forming with resistance near $2,210 on the hourly chart of ETH/USD.

If there is a fresh increase, the price could face resistance near the $2,200 zone. The next key resistance is near the $2,210 level and the trend line. The main resistance is now at $2,250. A clear move above the $2,250 zone could send the price toward the $2,330 level.

Ethereum Price

Source: ETHUSD on TradingView.com

The next resistance sits at $2,400. Any more gains could start a wave toward the $2,550 level, above which Ethereum might rally and test the $2,750 zone.

More Losses in ETH?

If Ethereum fails to clear the $2,210 resistance, it could continue to move down. Initial support on the downside is near the $2,135 level or the last swing low.

The first key support could be the $2,080 zone. It is close to the 1.236 Fib extension level of the key increase from the $1,980 swing low to the $2,330 high. A downside break below $2,080 might start another major decline. In the stated case, Ether could even decline below the $2,000 support.

Technical Indicators

Hourly MACDThe MACD for ETH/USD is gaining momentum in the bearish zone.

Hourly RSIThe RSI for ETH/USD is now below the 50 level.

Major Support Level – $2,135

Major Resistance Level – $2,210

Massive Bitcoin Options Expiry Imminent, BTC Inflows Spike

A recent report has revealed an upcoming significant event that will see the expiration of a notable amount of Bitcoin (BTC) and Ethereum (ETH) options contracts.

Bitcoin And Ethereum Options Contract Set To Expire

Global options trading service platform Greeks.live, took to X (formerly Twitter) to share data regarding the expiration of the crypto assets. 

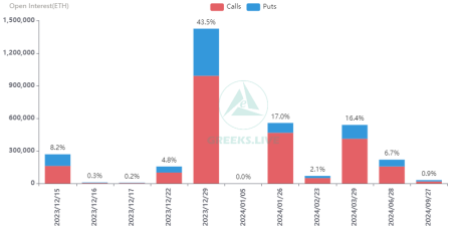
According to the platform, about 37,000 BTC options with a notional value of $1.58 billion are set to expire. In addition, Bitcoin’s current put-call ratio stands at 1.02 with a “Maxpain” point of $42,000.

Meanwhile, for Ethereum, the data shows that about 268,000 options valued at $610 million are set to expire soon. In addition, the current put-call ratio for ETH stand at 0.66, with a “maxpain” point of $2,250. The post read:

Dec. 15 Options Data. 37,000 BTC options are about to expire with a Put Call Ratio of 1.02, a Maxpain point of $42,000, and a notional value of $1.58 billion. 268,000 ETH options are due to expire with a Put Call Ratio of 0.66, a Maxpain point of $2,250, and a notional value of $610 million.

Notably, the put-call ratio, to put it simply, contrasts the trading volume of put and call options. A ratio higher than 1 signifies a higher number of puts (sell) than calls (buy) options, implying a negative outlook among traders. 

Bitcoin

Furthermore, the price at which the highest number of options would expire worthless is known as the maximum pain (Maxpain) point. 

Greeks.live asserted that this week saw a decline in the market, with BTC dropping close to $40,000 at one point. As a result, many hedge their positions, which led to a greater proportion of Put than Call positions this week. The bulk of trading is still concentrated on Bitcoin options even with the decline.

The platform also highlighted that the Implied Volatility (IV) has remained quite flat for about a month now. In addition, significant option moves are still going on.

The Crypto Assets Set To See Substantial Inflow 

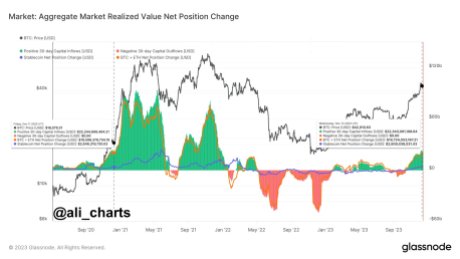
Cryptocurrency analyst Ali has recently revealed that billions of inflow are set to be poured into Bitcoin and Ethereum. The analyst shared this crucial information with the crypto community in an X post on Thursday, December 14.

Bitcoin

According to Ali, over $19.7 billion is about to flow into the two major players in the cryptocurrency market. He also added that this capital inflow is comparable to what we observed in December 2020.

The X post was accompanied by a chart showing a virtual explanation of a similar scenario. Ali further highlighted that after the scenario, the price of BTC moved from $18,000 to $65,000.

With billions of dollars flooding into the two major crypto, the market might be poised for further profits.

Bitcoin

Ethereum Price Holds 100 SMA But Needs To Clear This For More Gains

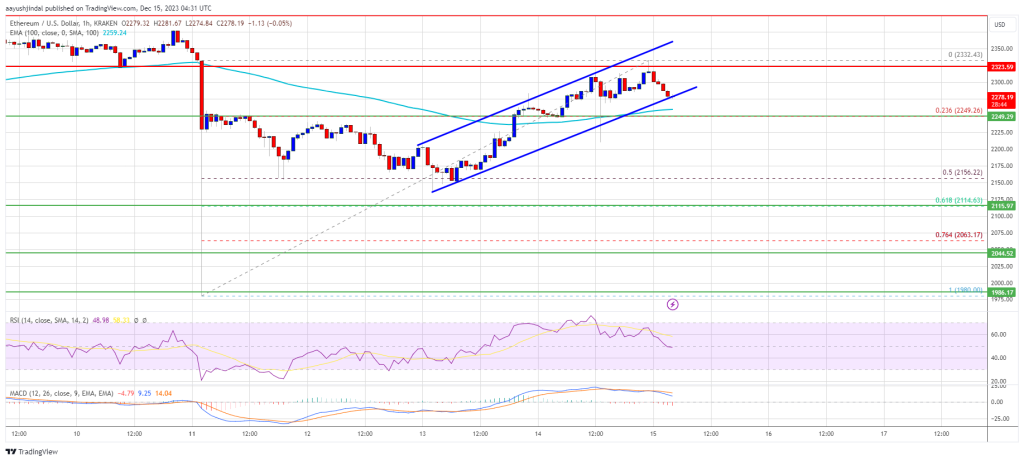
Ethereum price is consolidating above $2,250. ETH could start a fresh increase if there is a clear move above the $2,320 resistance zone.

  • Ethereum started a fresh increase above the $2,200 and $2,220 levels.
  • The price is trading above $2,240 and the 100-hourly Simple Moving Average.
  • There is a key rising channel with support near $2,275 on the hourly chart of ETH/USD (data feed via Kraken).
  • The pair could start a steady increase if there is a close above $2,320 and $2,350.

Ethereum Price Eyes More Upsides

Ethereum price started a steady increase above the $2,180 resistance. ETH gained bullish momentum after there was a close above the $2,200 resistance.

The price even spiked above the $2,300 level and settled above the 100-hourly Simple Moving Average. A high was formed near $2,332 and the price is consolidating gains. There was a minor bearish wave below the $2,300 level. However, Ethereum is still above $2,240 and the 100-hourly Simple Moving Average.

There is also a key rising channel with support near $2,275 on the hourly chart of ETH/USD. The channel support and the 100 hourly SMA are close to the 23.6% Fib retracement level of the upward move from the $1,980 swing low to the $2,332 high.

Ethereum Price

Source: ETHUSD on TradingView.com

On the upside, the price is facing resistance near the $2,320 level. The next key resistance is near the $2,350 level. The main resistance is still near $2,400. A clear move above the $2,400 zone could send the price toward the $2,500 level. The next resistance sits at $2,520. Any more gains could start a wave toward the $2,580 level.

Fresh Decline in ETH?

If Ethereum fails to clear the $2,320 resistance, it could start a fresh decline. Initial support on the downside is near the $2,275 level or the 100-hourly Simple Moving Average and the channel trend line. The next key support is $2,165.

The main support is now near $2,120 or the 61.8% Fib retracement level of the upward move from the $1,980 swing low to the $2,332 high. A downside break below $2,120 might start another major decline. In the stated case, Ether could revisit the $2,000 support.

Technical Indicators

Hourly MACDThe MACD for ETH/USD is losing momentum in the bullish zone.

Hourly RSIThe RSI for ETH/USD is now above the 50 level.

Major Support Level – $2,275

Major Resistance Level – $2,320

DeFi Researcher Questions Injective Protocol’s Appeal: Is INJ Overvalued?

Thor Hartvigsen, a data-driven decentralized finance (DeFi) researcher, is questioning the appeal of Injective Protocol, a layer-1 platform whose creators say is designed to expressly power finance.

As of December 2023, INJ, the native currency of Injective Protocol, is one of the top-performing coins, surpassing Bitcoin (BTC) and Ethereum (ETH).

Is Injective Protocol Undervalued Based On On-Chain Metrics?

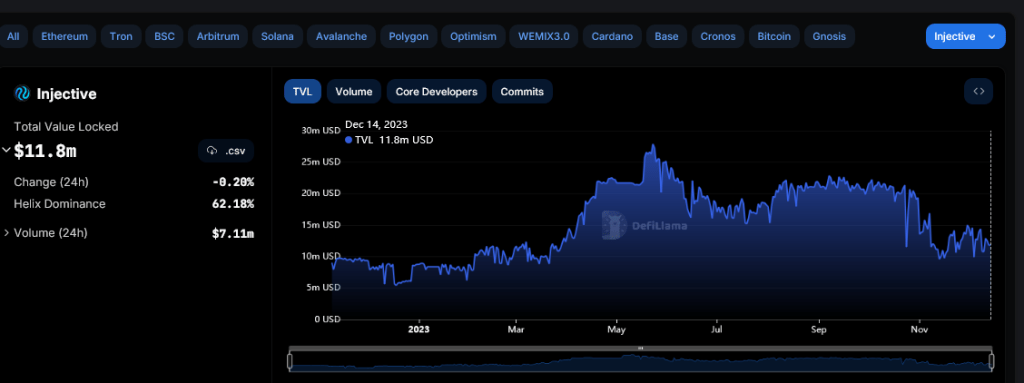
Taking to X on December 14, Hartvigsen highlighted the platform’s relatively low total value locked (TVL) of $11 million and the limited number of protocols launched on the platform, currently standing at seven.

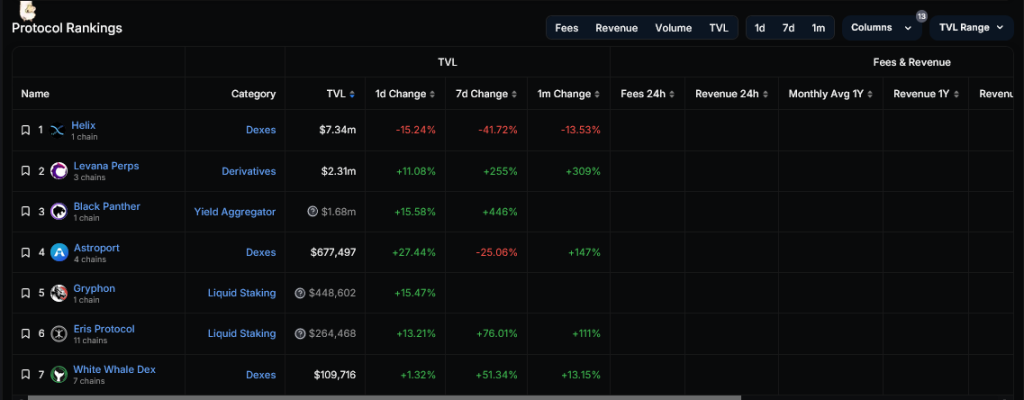
Based on the researcher’s analysis, the largest dapp on the layer-1, Helix Protocol, a decentralized exchange (DEX), only manages a daily trading volume of about $7.4 million. 

Injective Protocol TVL | Source: DeFiLlama

Hartvigsen states this is significantly lower than other perpetual futures protocols, including the Perpetual Protocol. These competitors, the analyst notes, are valued at around $200 and $300 million based on fully diluted valuation (FDV).

So far, looking at data, there are only seven active protocols on Injective, with Helix managing over 60% of the ecosystem’s TVL, reinforcing its dominance.

If on-chain activity and the number of active protocol leads, Hartvigsen wants answers to irrefutably justify Injective Protocol’s $3.2 billion valuation.

The researcher compares Injective with other blockchains, including Ethereum and Solana. These platforms command relatively higher trading volume and on-chain activity. 

Injective Protocol dapps | Source: DeFiLlama

To illustrate, Hartvigsen cites DefiLlama data, which shows that Injective’s volume ranges from $5 to $7 million daily from seven dapps.

On the other hand, Solana, a competing layer-1, presently processes between $500 and $700 million. Meanwhile, Injective Protocol cannot match Ethereum, which processes over $1 billion in trading volume.

INJ Up 395%, Will Prices Continue Rising On Investor Optimism?

In response to Hartvigsen’s analysis, yiggit, a user claiming to be a legal counsel, defended Injective Protocol. The user emphasized that TVL, as the researcher cited, cannot be the sole determinant to gauge a project’s potential. 

Related Reading: Bitcoin Deja Vu: Capital Inflows Mirror Pre-2021 Bull Run Momentum

Yiggit added that Injective Protocol’s potential is rooted in the expected number of upcoming apps. Notably, the legal counsel notes that optimism also stems from the Injective Protocol’s origins in Cosmos. In the Cosmos ecosystem, staking tends to catalyze participation as users seek to receive airdrops.

Injective Protocol price trending upward on the daily chart | Source: INJUSDT on Binance, TradingView

Still, whether or not the researcher’s assessment is valid depends on time. So far, looking at the INJ price action in the daily chart, the coin has been charting higher, registering new all-time highs.

To illustrate, INJ is up 395% from mid-October 2023, rallying as the broader crypto market recovers. At this valuation, CoinMarketCap data shows that the project has a market cap of over $2.7 billion.

Ethereum Bounces Off Support Zone: Path To New All-Time High Set?

On-chain data shows Ethereum has successfully found a rebound at a major support zone, a positive sign for the asset’s exploration at higher levels.

Ethereum Recently Made A Retest Of A Strong On-Chain Support Zone

In terms of on-chain analysis, the potential of any particular price range to act as support or resistance lies in the total number of investors who bought their coins inside said price range.

The reason behind that is the holders are more likely to react whenever the price retests their cost basis or acquisition price, which is obviously an important level to them since it can flip their profit-loss situation.

A single holder showing such a reaction won’t cause any effects on the market, naturally, but if a large number of investors share their cost basis inside a tight range, the asset’s retest of the range could perhaps produce a sizeable reaction.

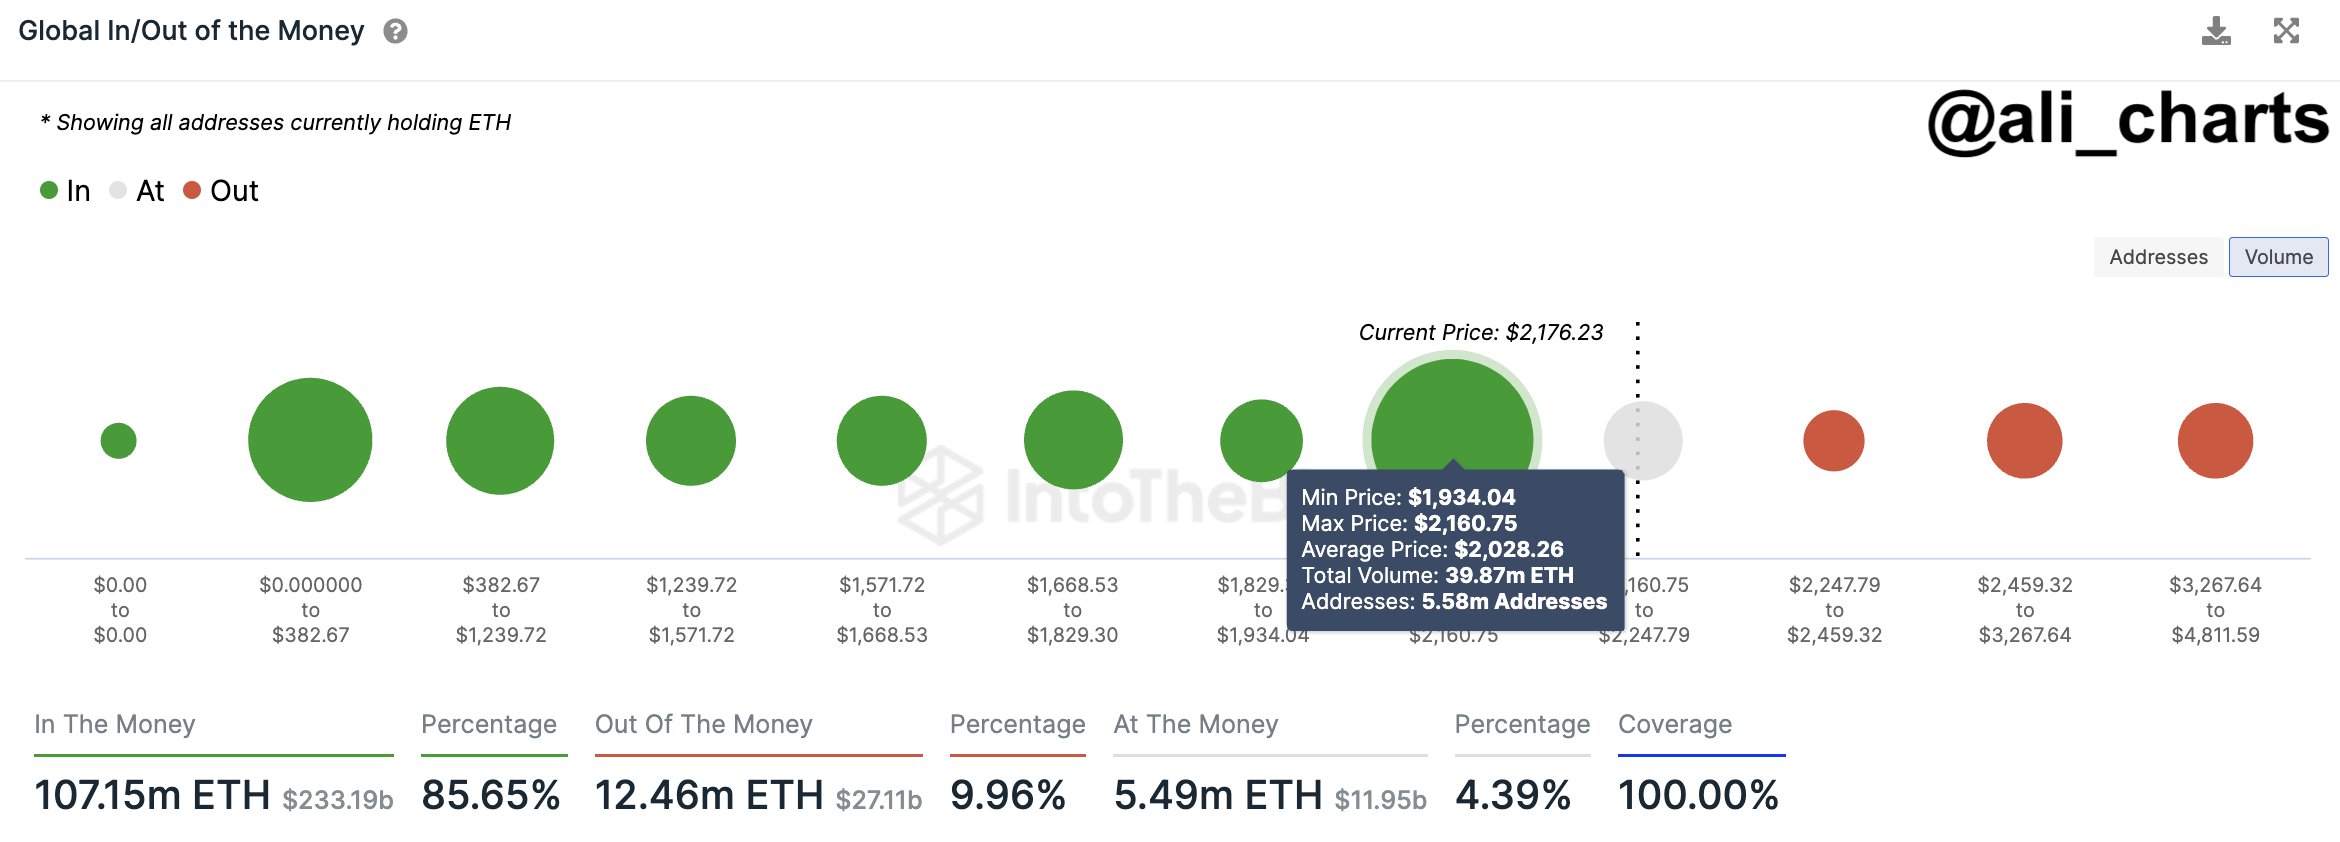
Hence, the larger the concentration of investors inside a particular range, the higher the ability of said range to act as resistance/support. Analyst Ali shared this chart recently in an X post that showed how the various Ethereum price ranges looked like in terms of the amount of addresses who acquired their coins at them at the time of the post:

Ethereum On-Chain Support

From the graph, it’s apparent that the $1,934 to $2,160 range is the Ethereum range that hosts the cost basis of the most amount of addresses. At the time Ali had made the post, Ethereum was retesting this range.

Now, since this range has such a high number of investors, a retest of it is probable to cause some reaction on the ETH price. But what kind of reaction would it be, support or resistance?

What decides this is the direction the price is retesting from. If the retest is from above, that is, these investors had been in profit just before the retest, then the market could feel some support.

This is because the holders might think this same price range could be profitable again in the future, so they might decide to participate in some accumulation at it.

Similarly, a retest from below could end up leading to resistance for Ethereum, as the investors might fear the asset dropping once more, so they could become more likely to sell.

Therefore, this huge range holding the cost basis of 5.85 million addresses should have acted as support for Ethereum during its latest retest. And indeed, since the retest, the asset has successfully found a rebound, as it has shot up towards higher levels.

As is visible in the chart, the ranges ahead up to the asset’s all-time high are all relatively thin with investors. This means that, thanks to the large support basis below, ETH shouldn’t have too much trouble traversing through these levels, at least in theory.

ETH Price

Since finding the rebound at the support range, Ethereum has climbed towards the $2,300 level.

Ethereum Price Chart