Analyst Endorses MATIC, Time To Double Down On Polygon And Ethereum Layer-2 Tokens?

Ryan Sean Adams, a vocal Ethereum commentator and crypto investor, is bullish on MATIC, the native token of Polygon. Taking to X on November 8, Adams said MATIC should be a top-10 crypto asset, adding that people are asleep on layer-2s.

Polygon (MATIC) Remains In An Uptrend

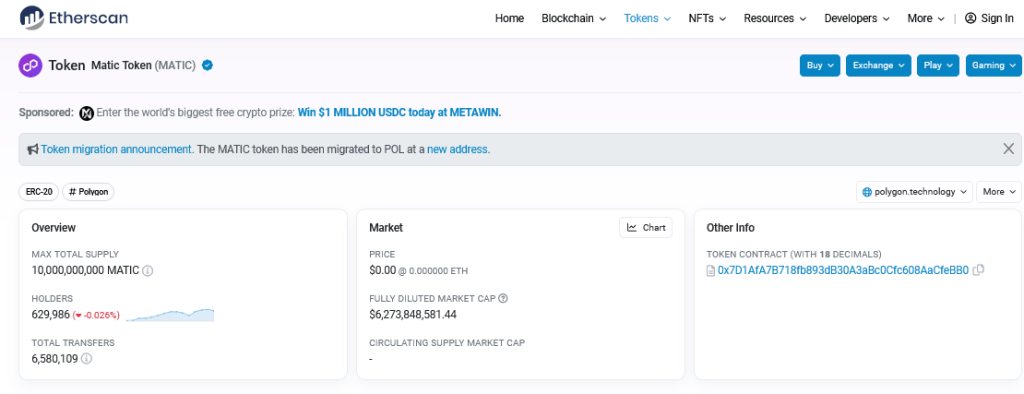
When writing on November 8, MATIC is among the top 15 most valuable coins by market cap. It also remains volatile, fluctuating, and moving up and down the market cap leaderboard rankings. Even so, considering its spot valuation exceeding $7.3 billion according to CoinMarketCap (CMC), a crypto tracker, MATIC remains relatively liquid with a broad user base. 

Etherscan data on November 8 shows that there are 629,967 MATIC holders, down roughly 2%, but the number remains higher despite the contraction following the crypto winter of 2022, which spilled over to 2023.

MATIC holders | Source: Etherscan

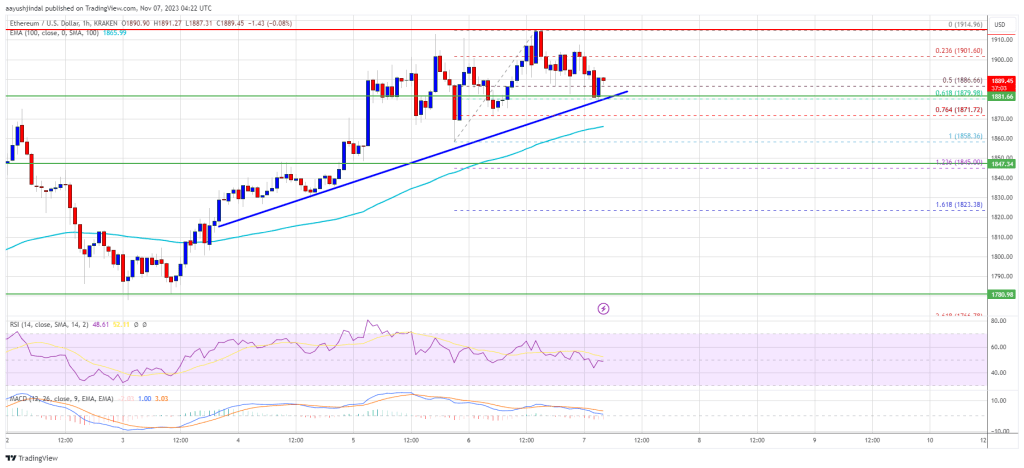
As of November 8, MATIC is up 60% from September 2023 lows. According to CMC, the coin is also up 13% on the last trading day, pushing weekly gains to over 27%. Looking at the candlestick arrangement in the daily chart, the uptrend momentum is strong, and buyers appear to be doubling down.

Presently, bull bars are aligned along the upper BB, suggesting that there is intense buying pressure. At the same time, MATIC is within a bullish breakout formation, breezing past August highs. 

Polygon, a sidechain, is among the many scaling solutions for Ethereum. The platform is compatible with Ethereum, allowing protocols to build on Polygon while enjoying the high activity and security of the first smart contract network. Polygon is also considered a layer-2, though it isn’t technically a layer-2 since it doesn’t depend on roll-ups like Arbitrum or OP Mainnet.

Time To Double Down On MATIC And Layer-2 Tokens

In Adams’ view, considering layer-2 tokens, including MATIC or ARB, at spot levels could translate to more gains in the next bull run. Nonetheless, it should be noted that MATIC, for instance, is down 72% from 2021 highs.

Moreover, the coin is trending inside June’s bear trade range. A comprehensive close above this level may signal the end of the bear run, possibly anchoring buyers targeting $1.5.

Polygon price trending upwards on the daily chart | Source: MATICUSDT on Binance, TradingView

In late October, Polygon Labs officially launched the POL, a token that will prime Polygon 2.0, Ethereum, signaling the first steps to see MATIC gradually phased out. POL will serve more roles in Polygon 2.0, specifically powering an ecosystem of zero knowledge-based layer-2 chains using Polygon’s infrastructure. News of this smart contract launch seemed to have catalyzed demand, driving token prices higher.

Bitcoin Dominates: Overtakes Ethereum In 24H NFT Sales Volume For The First Time

In a turn of events within the non-fungible token (NFT) market, Bitcoin (BTC) has achieved a significant milestone by surpassing Ethereum (ETH) in 24-hour NFT sales volume. This marks the first time that Bitcoin has outperformed Ethereum in this aspect.

BTC’s NFT Breakthrough

Bitcoin’s recent achievement of surpassing Ethereum in 24-hour NFT sales volume signals a changing trend and growing interest in the NFT market. 

While Ethereum has long been recognized as the dominant blockchain for NFTs, Bitcoin’s entrance into the space demonstrates its increasing relevance and appeal to NFT enthusiasts and collectors.

The data highlights that Bitcoin accounted for $17,291,694 in NFT sales, with 575 buyers participating. On the other hand, Ethereum recorded $26,689,252 in total sales, with 11,225 buyers. 

Bitcoin

Despite Ethereum maintaining a higher total sales figure, the relatively lower wash percentage of Bitcoin suggests a potentially healthier and more organic market activity.

However, when it comes to volatility, data from Deribit, the leading crypto derivatives exchange, shows that the spread between ETH and BTC volatility, commonly referred to as the ETH DVOL vs. BTC DVOL spread, has narrowed significantly since October 23rd from -11.6 to just -0.6. This shift indicates a change in investor sentiment and increased attention towards Ethereum and altcoins.

In light of this development, Ethereum has outperformed Bitcoin over the past fourteen days. ETH has seen significant price movement, gaining over 2% in the last 24 hours, 6% in the last seven days, and 4% in the last fourteen days, bringing its current price to $1,899.

Bitcoin

Meanwhile, Bitcoin has exhibited a slowdown in its upward momentum and is currently consolidating above $35,400. It has seen a 2% increase in the past 24 hours, 3% in the past seven days, and 1% in the fourteen-day timeframe.

However, it is important to note that BTC has gained more than 82% year-to-date, while ETH has only increased by 30% during the same period, according to CoinGecko data

Nasdaq 100 Correlation With Bitcoin Plummets

According to recent Kaiko data, BTC has witnessed a significant decline in its correlation with traditional assets throughout the year. One notable development is the diminishing correlation between Bitcoin and the Nasdaq 100 index. 

Over the past year, Bitcoin’s 60-day correlation with the Nasdaq 100 has substantially declined, plunging from over 70% in September 2022 to approximately 19% as of last week. 

Bitcoin

Bitcoin’s negative correlation with the US dollar, which ranged from 40% to 50%, has also weakened. Currently, the correlation is around 11%, signifying a reduced tendency for Bitcoin’s value to move in the opposite direction of the US dollar.

While Bitcoin’s correlation with gold has seen some upward momentum since August, the average correlation throughout the year has remained relatively low at 12%. 

This suggests that the relationship between Bitcoin and gold has been modest regarding price movements and indicates a potential divergence in investment characteristics between the two assets.

Featured image from Shutterstock, chart from TradingView.com 

Ethereum Failed Transactions: You Won’t Believe How Much Users Have Lost

The Ethereum network has usually been criticized for the number of failed transactions that occur on it and how it leads to users losing their money as a result of this. This onslaught was recently renewed after a figure in the crypto community showed the staggering amount that has been lost from failed transactions.

ETH Users Lose Over 100,000 To Failed Transactions

In a post on his X (formerly Twitter) platform, the Marketing and Communications Director of Blockstream, Fernando Nikolić, shared a screenshot that showed that Ethereum users had lost over $100,000 due to failed transactions. Interestingly, the $100,000 value happened to be only for the top 10 transactions in the screenshot, with Nikolić noting that there were other ones.

From the screenshot, one can see how a particular user lost over $38,000 in gas fees from a single transaction. The second user on the list lost over $17,000 in gas fees, with others on the list also losing thousands of dollars in gas fees despite the fact that the transaction failed. Usually, gas fees paid on the Ethereum network are gone forever, irrespective of whether the transactions succeed or fail. 

Noteworthily, eight out of the transactions from the screenshot occurred back in May during the period of the frenzy around the meme coin PEPE, which caused an unusual surge in traffic on the Ethereum network.

Failed transactions are known to occur rampantly during such periods because a surge in activity on the network leads to a significant increase in gas fees, with some users falling short of the required gas fee (at the point of executing their trade) needed to process a transaction, which causes it to fail. 

Ethereum price chart from Tradingview.com

Coordinated Attack On Ethereum?

In his post, Nikolić referred to the failed transactions on the Ethereum network as “hot garbage.” Although his post could just be about a concerned member of the crypto community calling out the network, it bears mentioning that he happens to be the second Bitcoin maximalist calling out the network in the space of a week. 

Another Bitcoin maximalist, Bit Paine, had earlier suggested that the network was a scam. The crypto pundit hinted that the Ethereum network has helped facilitate the creation of several “digital penny” stocks, which he also referred to as unregistered securities

However, both statements could be unrelated and simply two astute members of the Bitcoin community, showing why they believe Bitcoin remains supreme

At the time of writing, Ethereum is trading above $1,800, up in the last 24 hours, according to data from CoinMarketCap. 

Ethereum Price Bullish Momentum Fades But ETH Bulls Still In Control

Ethereum price is still struggling to clear the $1,920 resistance against the US dollar. ETH is moving lower but downsides might be limited below $1,850.

  • Ethereum is still struggling to clear the $1,920 level.
  • The price is trading above $1,860 and the 100-hourly Simple Moving Average.
  • There was a break above a connecting bearish trend line with resistance near $1,880 on the hourly chart of ETH/USD (data feed via Kraken).
  • The pair could rise once again unless there is a close below the $1,850 support zone.

Ethereum Price Stuck In Range

Ethereum remained stable above the $1,850 support zone. ETH made another attempt to gain bullish momentum above the $1,880 resistance, like Bitcoin.

There was a break above a connecting bearish trend line with resistance near $1,880 on the hourly chart of ETH/USD. However, the pair again failed to clear the $1,920 resistance zone. A high is formed near $1,907 and the price is moving lower.

There was a drop below the $1,885 level. The price even tested the 50% Fib retracement level of the recent increase from the $1,851 swing low to the $1,907 high.

Ethereum is now trading above $1,860 and the 100-hourly Simple Moving Average. On the upside, the price is facing resistance near the $1,900 level. The first major resistance sits at $1,920. To start a fresh increase, the bulls need to clear the $1,920 resistance.

Ethereum Price

Source: ETHUSD on TradingView.com

In the stated case, the price could rally toward the $2,000 resistance. The next key resistance is near $2,050, above which the price could accelerate higher toward the $2,120 level.

Are Dips Limited in ETH?

If Ethereum fails to clear the $1,900 resistance, it could continue to move down. Initial support on the downside is near the $1,880 level. The next key support is $1,870 or the 100 hourly SMA.

The 61.8% Fib retracement level of the recent increase from the $1,851 swing low to the $1,907 high is also at $1,870. The main support sits at $1,850. A downside break below the $1,850 support might send Ether further lower. In the stated case, the price could drop toward the $1,780 level.

Technical Indicators

Hourly MACDThe MACD for ETH/USD is losing momentum in the bullish zone.

Hourly RSIThe RSI for ETH/USD is now above the 50 level.

Major Support Level – $1,870

Major Resistance Level – $1,920

Altcoins Market Share Versus Bitcoin At A 4 Month High: What’s The Trigger?

Looking at Kaiko’s data shared on November 7 by Dessislava Ianeva, a Research Analyst at the blockchain analyst firm, it is evident that altcoins market share versus Bitcoin (BTC) has been rising in the past four months, reaching a 4-month high, the highest level since July 2023.

The surge in market share can be attributed to multiple factors but primarily because of the upswing in Bitcoin prices, improving sentiment across the crypto market, and project-related developments that have attracted capital over the past few trading months.

Altcoins market share versus Bitcoin rising | Source: Kaiko

Altcoins Market Share Rising Versus Bitcoin

Kaiko notes that the altcoins market share of the top 30 altcoins stands at 44%, an improvement over the past few trading months. This is a notable expansion considering that altcoin prices, including those of leading coins like Ethereum (ETH), XRP, Solana (SOL), Cardano (ADA), and the rest posted sharp losses in 2022. Even though prices continued falling, losses were contained in 2023 but remain lower from 2021 peaks when asset prices surged to record lows. 

Despite altcoins gnawing more market share from Bitcoin, the most valuable coin continues to enjoy multiple advantages, especially from a regulatory standpoint. For instance, the coin has been endorsed by regulators in the United States, Europe, and Canada.

In this line, complex derivatives products, including Exchange-Traded Products (ETPs) and futures, are already listed in Canada, the United States, and some European countries. The spike at the end of July was partly because of the increasing confidence across crypto that the United States Securities and Exchange Commission (SEC) might approve the first Exchange-Traded Fund (ETF).

This confidence follows BlackRock’s decision to submit its Bitcoin ETF application. Due to their track record, market analysts elevated the odds of the strict agency to authorize the first spot in Bitcoin ETF.

Why Are Altcoins Like Ethereum, XRP, And Solana Rallying?

Presently, the upward momentum in Bitcoin has been shrinking but remains at around 2023 high on improving market sentiment. The slowdown in the uptrend coincides with rapidly shifting investor patterns, especially in Solana, XRP, and Ethereum.

To illustrate, the SEC’s decision to approve the launch of the Ethereum Futures product led to more interest in the project, directly supporting ETH prices. At the same time, Solana has been edging higher, even reversing post-FTX losses despite action by FTX estate managers.

Ethereum price trending upwards on the daily chart | Source: ETHUSDT on Binance, TradingView

There is more on-chain activity on Solana. Meanwhile, regulatory clarity on XRP has seen Ripple double down, striking more partners.

Ethereum Bullish Revival: Will This Breakthrough Lead To A New Market Phase?

Ethereum (ETH), the second-largest cryptocurrency by market capitalization, has exhibited a promising technical development, igniting optimism within the crypto community.

The formation of a bullish flag pattern within the daily timeframe has captured the attention of analysts and traders, hinting at potential positive movements in the near future.

A bullish flag pattern is a common technical analysis formation in financial markets, frequently visible on price charts. It involves an upward price surge (the flagpole) succeeded by a consolidation or sideways movement (the flag) within a downward or sideways channel.

Typically identified within the daily timeframe, it signals recent upward movement followed by a consolidation phase. Traders and analysts keenly observe this pattern as it often implies a potential continuation of an upward trend.

This aligns perfectly with the current recovery sentiment in the cryptocurrency market, as Ether managed to breach the upper trendline of the pattern earlier this week, pointing towards the possibility of a substantial upward surge.

Ethereum: Breakthrough Resistance

The recent surge in Ethereum’s price has broken past a critical resistance level marked by the convergence of its 50-day and 100-day Exponential Moving Averages (EMAs). These EMAs hold paramount importance for traders and analysts, often serving as key indicators of market trends and momentum.

The successful breach of this resistance level further reinforces the bullish sentiment surrounding Ethereum, indicating a potential shift towards a more robust upward trajectory.

The bullish flag pattern that has taken shape on Ethereum’s price chart has been a long time in the making, spanning over a period of seven months. During this time, the price of ETH has fluctuated within the converging trendlines of the pattern, reflecting the market’s indecision and the tug-of-war between buyers and sellers.

It is noteworthy that the upper boundary of the pattern has acted as a significant support level twice, underlining its influence in shaping market sentiment and price dynamics.

Market Insights And Caution

As of the latest market data provided by CoinGecko, the current price of Ethereum stands at $1,890, reflecting a modest 24-hour gain of 0.5% and a notable upward trajectory of 5.3% over the past seven days. These figures reaffirm the growing interest in Ethereum, highlighting the market’s confidence in the coin’s potential for further gains.

Industry experts and seasoned traders offer valuable insights into this recent development, emphasizing the importance of closely monitoring the price action and overall market sentiment surrounding Ethereum. With the bullish flag pattern hinting at a potential bullish continuation, market participants are advised to stay vigilant and consider the implications of this technical setup in their trading strategies.

Despite the positive momentum, caution remains essential, as the cryptocurrency market is known for its inherent volatility and unpredictability. Investors and traders are advised to conduct thorough research, employ risk management strategies, and stay informed about market developments to make well-informed decisions in this dynamic and rapidly evolving landscape. 

(This site’s content should not be construed as investment advice. Investing involves risk. When you invest, your capital is subject to risk).

Featured image from Shutterstock

Ethereum Price Hesitates But A Bull-Run To $2,000 Seems Likely

Ethereum price is slowly moving up toward the $2,000 resistance against the US dollar. ETH is in a better positive for a decent upward move than Bitcoin.

  • Ethereum is still attempting to move toward the $2,000 level.
  • The price is trading above $1,850 and the 100-hourly Simple Moving Average.
  • There is a connecting bullish trend line forming with support near $1,880 on the hourly chart of ETH/USD (data feed via Kraken).
  • The pair could continue to move higher above the $1,920 and $1,950 levels.

Ethereum Price Remains Supported

Ethereum formed a support base and slowly moved higher above the $1,850 resistance zone. ETH even broke the $1,880 level and spiked toward the $1,920 resistance, unlike Bitcoin.

The price traded as high as $1,915 and is currently consolidating gains. There was a minor downside correction below the $1,900 level. The price dipped below the 50% Fib retracement level of the upward move from the $1,858 swing low to the $1,915 high.

However, the bulls are protecting more downsides below $1,880. They are protecting the 61.8% Fib retracement level of the upward move from the $1,858 swing low to the $1,915 high.

Ethereum is now trading above $1,880 and the 100-hourly Simple Moving Average. There is also a connecting bullish trend line forming with support near $1,880 on the hourly chart of ETH/USD.

Ethereum Price

Source: ETHUSD on TradingView.com

On the upside, the price is facing resistance near the $1,900 level. The first major resistance sits at $1,920. If ETH surpasses the $1,920 resistance, it could gain bullish momentum and even clear $1,950. In the stated case, the price could drift toward the $2,000 barrier. The next key resistance is near $2,050, above which the price could accelerate higher toward the $2,120 level.

Are Dips Supported in ETH?

If Ethereum fails to clear the $1,920 resistance, it could start a downside correction. Initial support on the downside is near the $1,880 level or the trend line.

The next key support is $1,860 or the 100 hourly SMA. The main support sits at $1,850. A downside break below the $1,850 support might spark bearish moves. In the stated case, Ether could drop toward the $1,750 level.

Technical Indicators

Hourly MACDThe MACD for ETH/USD is losing momentum in the bullish zone.

Hourly RSIThe RSI for ETH/USD is now above the 50 level.

Major Support Level – $1,850

Major Resistance Level – $1,920