Ethereum price is slowly moving up toward the $2,000 resistance against the US dollar. ETH is in a better positive for a decent upward move than Bitcoin.
- Ethereum is still attempting to move toward the $2,000 level.
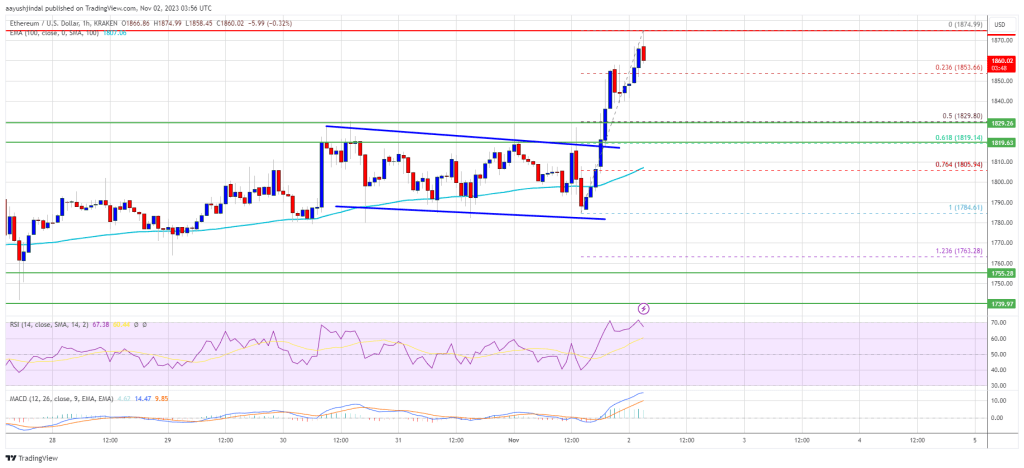
- The price is trading above $1,850 and the 100-hourly Simple Moving Average.
- There is a connecting bullish trend line forming with support near $1,880 on the hourly chart of ETH/USD (data feed via Kraken).
- The pair could continue to move higher above the $1,920 and $1,950 levels.
Ethereum Price Remains Supported
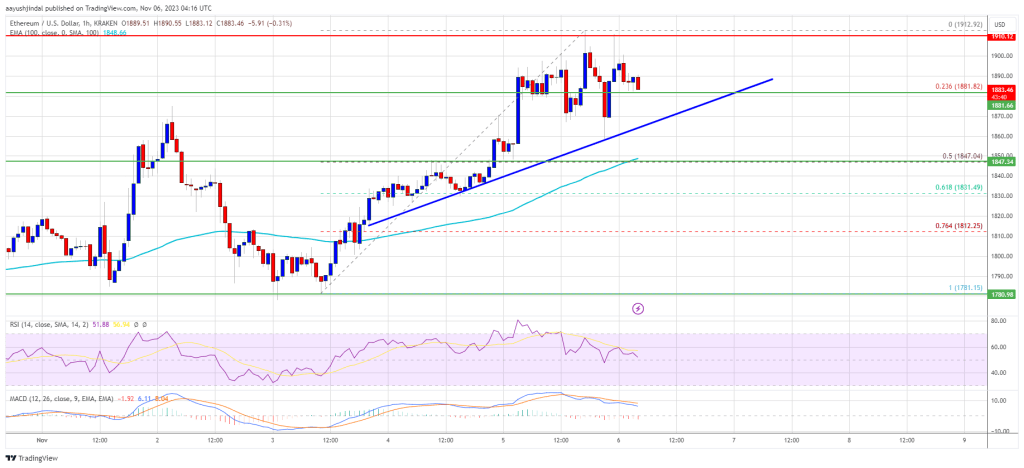
Ethereum formed a support base and slowly moved higher above the $1,850 resistance zone. ETH even broke the $1,880 level and spiked toward the $1,920 resistance, unlike Bitcoin.
The price traded as high as $1,915 and is currently consolidating gains. There was a minor downside correction below the $1,900 level. The price dipped below the 50% Fib retracement level of the upward move from the $1,858 swing low to the $1,915 high.
However, the bulls are protecting more downsides below $1,880. They are protecting the 61.8% Fib retracement level of the upward move from the $1,858 swing low to the $1,915 high.
Ethereum is now trading above $1,880 and the 100-hourly Simple Moving Average. There is also a connecting bullish trend line forming with support near $1,880 on the hourly chart of ETH/USD.
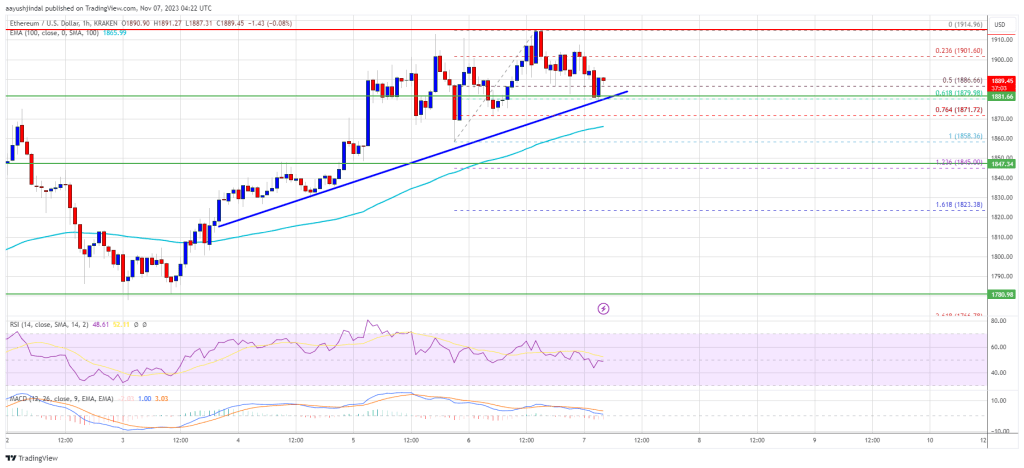
Source: ETHUSD on TradingView.com
On the upside, the price is facing resistance near the $1,900 level. The first major resistance sits at $1,920. If ETH surpasses the $1,920 resistance, it could gain bullish momentum and even clear $1,950. In the stated case, the price could drift toward the $2,000 barrier. The next key resistance is near $2,050, above which the price could accelerate higher toward the $2,120 level.
Are Dips Supported in ETH?
If Ethereum fails to clear the $1,920 resistance, it could start a downside correction. Initial support on the downside is near the $1,880 level or the trend line.
The next key support is $1,860 or the 100 hourly SMA. The main support sits at $1,850. A downside break below the $1,850 support might spark bearish moves. In the stated case, Ether could drop toward the $1,750 level.
Technical Indicators
Hourly MACD – The MACD for ETH/USD is losing momentum in the bullish zone.
Hourly RSI – The RSI for ETH/USD is now above the 50 level.
Major Support Level – $1,850
Major Resistance Level – $1,920