Earlier this year, Ethereum staking was popular, particularly with Lido Finance’s rise to prominence in the DeFi space, but it is now facing challenges, suspicions, and resentment.
Stellar, Early Blockchain Built for Payments, Adds Smart Contracts to Take on Ethereum
The nine-year-old project, one of the earliest major blockchains, is getting a facelift to incorporate “smart contracts,” that theoretically could attract new applications and users – and potentially more demand for the XLM token.
Investment Manager Methodic Unveils Ether Staking Fund Offering Exposure to ETH Price and Yield
The Methodic CoinDesk ETH Staking Fund offers institutional exposure to spot ETH price and staking yields.
Real Reason Behind Ethereum Founder’s Massive ETH ‘Sales’ Exposed
A crypto wallet owned by the Ethereum founder Vitalik Buterin has seen a series of transactional activities lately, piquing the interest of crypto community members at a time when Ethereum selling pressures are rising.
Following this, Buterin has taken the initiative to address the concerns regarding his recent transfer of digital assets to multiple exchanges.
Ethereum Co-Founder Discloses Truth Behind Multi-Transfers
In a recent post on Warp Cast, a decentralized social network, Russian-Canadian computer programmer and founder of Ethereum, Vitalik Buterin publicized the real reason behind the latest ETH transfers made via his wallet address.
Buterin explained to the public that the large-scale ETH transactions that were performed using his wallet were not sold by him. He stated that over the years, he has mostly focused on donating large sums of Ethereum funds to charity organizations and other projects. He further solidified his claims saying that he had not sold ETH for personal profits since 2018.
“If you see an article saying ‘Vitalik sends XXX ETH to [exchange]’, it’s not actually me selling, it’s almost always me donating to some charity or nonprofit or other projects, and the recipient selling because, well, they have to cover expenses,” Buterin stated.
Buterin is well-known for his philanthropic acts toward charity organizations and medical interventions. The Ethereum co-founder made headlines in 2021, after donating $1 billion worth of SHIB tokens to a COVID-19 relief fund in India.
Additionally, in February 2023, Buterin donated $150,000 to Anka Relief to fund a crypto aid project that would support Türkiye after its recent earthquake experiences.
Although there have been many proofs of Buterin’s propensity to donate to multiple charities, the crypto community has remained skeptical and vigilant, relentlessly monitoring the Ethereum founder’s cryptocurrency activities, as well as these recent high-value ETH transactions.
Spokesperson Reveals $15 Million ETH Transfer From Kanro Charity
According to data from PeckShield Alert, a blockchain security and auditing firm, Vitalik Buterin recently made a large-scale transaction of $15 million USDC to the Gemini Exchange.
This transaction in question is among the list of recent transfers associated with the Ethereum founder. These movements have prompted both curiosity and concern in the crypto community, as observers attempt to determine the underlying motive behind Buterin’s transactions.
A report from Cointelegraph said an Ethereum Foundation Spokesperson has clarified the details behind the lofty transaction. According to the Spokesperson, the $15 million USDC transfer was only executed under Buterin’s Ethereum Name Service (ENS) and not from his wallet address.
The spokesperson also supposedly confirmed that the funds were from a transfer made by a charity multi-sig wallet, Kanro, which is closely linked to Buterin to sponsor a grant.
Ethereum LSDFi sector grew nearly 60x since January in post-Shapella surge: CoinGecko

The LSDFi sector’s total value locked has grown 5,870% since January as ETH holders seek better yields.
Ethereum Underperforms Bitcoin, Bulls Struggle To Protect Key Support
Ethereum price failed to start fresh increase above $1,600 against the US dollar. ETH is now struggling to stay above the $1,550 support zone.
- Ethereum extended its decline and tested the $1,550 support zone.
- The price is trading just below $1,580 and the 100-hourly Simple Moving Average.
- There is a connecting bearish trend line forming with resistance near $1,570 on the hourly chart of ETH/USD (data feed via Kraken).
- The pair could accelerate lower if the bulls fail to protect the $1,550 support.
Ethereum Price Dips Further
Ethereum struggled to settle above $1,650 and started a fresh decline. ETH traded below the $1,620 and $1,600 support levels. There was a short consolidation phase before the price extended its decline, unlike Bitcoin.
There was a move below the $1,575 support and the price tested $1,550. A low is formed near $1,553 and the price is now consolidating losses. There is also a connecting bearish trend line forming with resistance near $1,570 on the hourly chart of ETH/USD.
Ethereum is now trading just below $1,580 and the 100-hourly Simple Moving Average. On the upside, the price is facing resistance near the $1,570 level and the trend line. The 23.6% Fib retracement level of the downward move from the $1,669 swing high to the $1,553 low is also just above the trend line.
The first major resistance is near the $1,600 zone or the 50% Fib retracement level of the downward move from the $1,669 swing high to the $1,553 low.
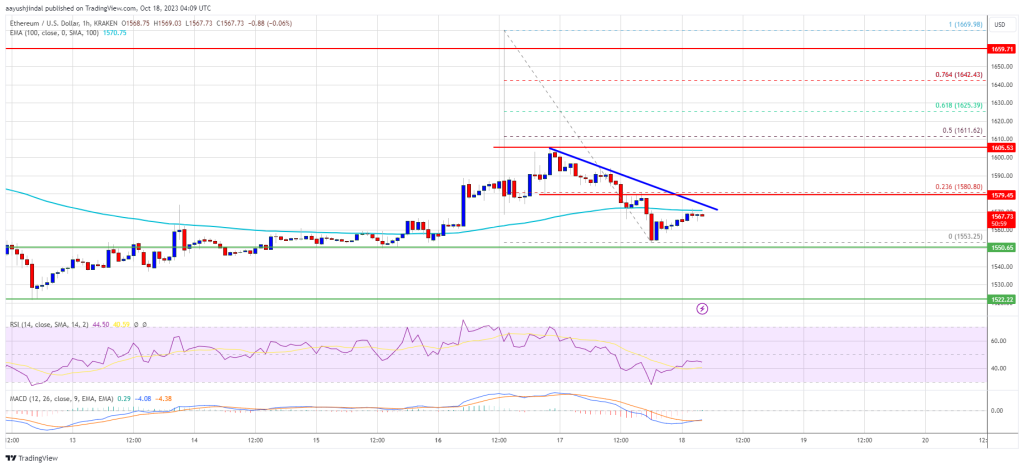
Source: ETHUSD on TradingView.com
A close above the $1,600 resistance might start a decent increase. In the stated case, Ether could rise and recover toward the $1,660 resistance. Any more gains might open the doors for a move toward $1,720.
More Losses in ETH?
If Ethereum fails to clear the $1,570 resistance, it could start another decline. Initial support on the downside is near the $1,550 level.
The next key support is $1,520. A downside break below the $1,520 support might send the price further lower. In the stated case, the price could drop toward the $1,480 level. Any more losses may perhaps send Ether toward the $1,420 level.
Technical Indicators
Hourly MACD – The MACD for ETH/USD is losing momentum in the bullish zone.
Hourly RSI – The RSI for ETH/USD is now below the 50 level.
Major Support Level – $1,550
Major Resistance Level – $1,570
Chinese Developers Eager To Build On Solana: Will SOL Breeze Past $30?
China developers are active and willing to build on leading blockchain platforms if statistics from Solana Hyperdrive Hackathon submission details are anything to go by. In an X post on October 17, Matty Taylor, the Head of Growth at the Solana Foundation, said there were far more developers from China who submitted applications, willing to participate in the Solana Hyperdrive hackathon than from the United States.
Solana Attracting Chinese Developers
The hackathon has a prize pool of $1 million, and all submissions had to be submitted by October 15. It is an online event aiming to “nurture and expand” the Solana ecosystem.
Developers from 68 countries submitted, with the highest numbers coming from China and Vietnam. The rest were mainly from the United States, India, Mexico, Turkey, and Germany.
That notable participation from Chinese developers can be a massive boost for Solana, indicating that the blockchain could be popular in the Asian economic powerhouse. China remains pro-blockchain and believes that the technology can give them an edge and even improve efficiency in some critical sectors, like agriculture, healthcare, governance, and finance, that the country seeks to enhance gradually.
However, China has banned crypto trading and mining, citing the “need to go green, protect consumers, and ensure financial stability.” The Chinese central bank, PBoC, said cryptocurrencies could pose a risk to the country’s financial system.
Unlike Ethereum, Solana permits fast transaction processing and is relatively scalable with decent activity. Although the project suffered following the collapse of FTX in November 2022, there has been a revival in price and on-chain activity.
The Revival, Will SOL Breach $30?
To illustrate, non-fungible token (NFT) trading activity on Solana has steadily risen over the past few months. While there was a spike, the network didn’t halt, as in previous instances, especially in 2022.
Instead, the high reliability seems to have inspired activity, directly helping revive SOL prices that collapsed by over 90%, worsened by news that Sam Bankman-Fried and Alameda Research allegedly embezzled customer funds. FTX had invested in Solana and has a considerable share of SOL, which will be liquidated and reimbursed to impacted clients.
At spot rates, SOL is up 36% from September 2023 lows and overly firm. Looking at the candlestick arrangement in the daily chart, SOL is trading at October and 2023 highs and could break higher if bulls press on. The October 16 bull bar is wide-ranging, has marked trading volumes, and could anchor the next leg towards July 2023 highs of around $32.
Uniswap’s New Fee Structure: Are You About To Pay More For These Tokens?
Recently, Uniswap, a prominent decentralized exchange, made headlines by introducing a 0.15% swap fee on specific tokens. While generating buzz and curiosity, this decision has raised several questions regarding its impact on traders.
Decentralized exchanges (DEX) facilitate peer-to-peer trading without intermediaries. The absence of centralized entities has advantages but also presents challenges, especially regarding fee structures.
Uniswap’s latest update to alter its fee structure is a significant shift with potential implications for its large user base.
Uniswap Fee Structure: Analyzing The Financial Impact
According to data shared by Colin Wu, a blockchain-focused reporter, the daily fees from this change on Uniswap V3 could range between $388,000 and $444,000.
Providing deeper insight into the platform’s operations, Wu mentions that approximately 35% to 40% of the entire transaction volume on Uniswap occurs on the front end.
These figures, while substantial, are just the tip of the iceberg. Specific tokens targeted for this new fee include popular tokens such as ETH, USDC, WETH, USDT, DAI, WBTC, agEUR, GUSD, LUSD, EUROC, and XSGD.
However, according to the Chinese reporter, this fee will only apply when these tokens are traded through Uniswap Labs interfaces on the mainnet and its supported Layer 2 networks.
Currently, about 35%-40% of the transaction volume in Uniswap is completed through front end, H/T @1kbeetlejuice. Ethereum Uniswap V3 in the past 24h is $810m, excluding major stablecoin pairs, which is $740m, the daily fees charged by V3 may be $388k-444k.… https://t.co/EAeV6xwQHX
— Wu Blockchain (@WuBlockchain) October 17, 2023
Understanding The Broader Context
While the announcement sparked curiosity, it also led to some confusion concerning the fees. Uniswap’s help center, in response, clarified that these newly implemented fees stand apart from the Uniswap Protocol fee switch, which is determined through votes by Uniswap’s governance mechanism.
Despite the explanation by the DEX’s team, the genesis of this new fee introduction remains ambiguous to many within the community.
In response to Wu’s initial post, several individuals opposed the update, with a particular user questioning the rationale behind the 0.15% fee, the considerations leading to this specific percentage, and the selection of particular tokens for the fee imposition.
According to data from Coinmarketcap, Uniswap has reported a significant trading volume of $518.3 million in the past 24 hours, capturing 18.3% of the market share within the decentralized exchange sector.
Meanwhile, Uniswap native token UNI has witnessed a substantial decline. The asset has dipped by more than 10% over the past two weeks and showed a continuous drop of 5.5% in the last 24 hours. Currently, UNI is trading for $3.8.
Featured image from Bitcoin-Bude, Chart from TradingView
Ethereum Price Faces Crucial Test: Will $1,570 Withstand the Pressure?
Ethereum price started a steady increase from the $1,520 zone against the US dollar. ETH is now struggling to clear the $1,605 and $1,620 resistance levels.
- Ethereum is attempting a recovery wave above the $1,570 level.
- The price is trading just above $1,575 and the 100-hourly Simple Moving Average.
- There is a key bullish trend line forming with support near $1,572 on the hourly chart of ETH/USD (data feed via Kraken).
- The pair could rise further if there is a close above the $1,620 resistance level.
Ethereum Price Gains Traction
Ethereum started a fresh increase from the $1,520 level. ETH gained traction like Bitcoin and spiked above the $1,600 resistance level. It even climbed above $1,620, but the bears appeared near $1,650.
A high was formed near $1,669 before there was a fresh decline. Ether trimmed gains and settled below the $1,600 level. It tested the $1,575 support and is currently consolidating near the 23.6% Fib retracement level of the recent decline from the $1,669 swing high to the $1,574 low.
Ethereum is now trading just above $1,575 and the 100-hourly Simple Moving Average. There is also a key bullish trend line forming with support near $1,572 on the hourly chart of ETH/USD.
On the upside, the price is facing resistance near the $1,605 level. The first major resistance is near the 50% Fib retracement level of the recent decline from the $1,669 swing high to the $1,574 low at $1,620. A close above the $1,620 resistance might start a decent increase.
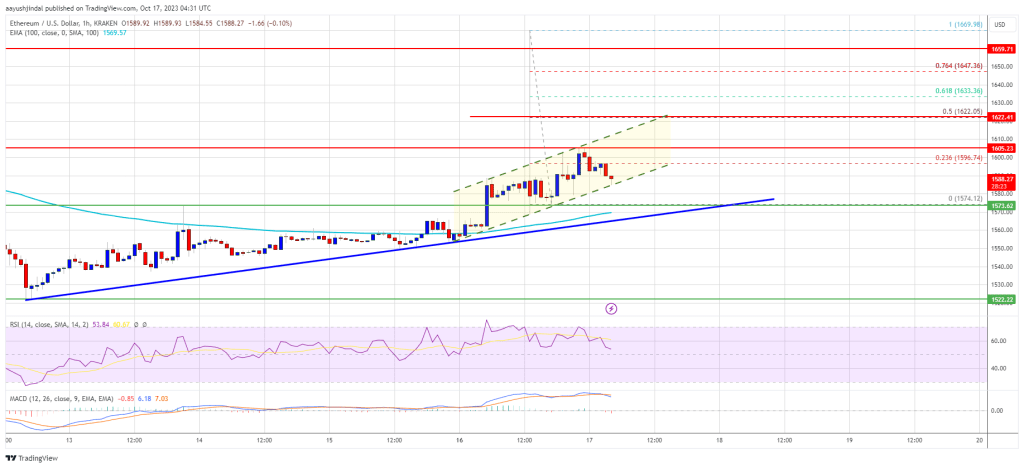
Source: ETHUSD on TradingView.com
In the stated case, Ether could rise and recover toward the $1,665 resistance. Any more gains might open the doors for a move toward $1,750.
Another Decline in ETH?
If Ethereum fails to clear the $1,605 resistance, it could start another decline. Initial support on the downside is near the $1,575 level and the 100-hourly Simple Moving Average.
The next key support is $1,550. A downside break below the $1,550 support might send the price further lower. In the stated case, the price could drop toward the $1,520 level. Any more losses may perhaps send Ether toward the $1,440 level.
Technical Indicators
Hourly MACD – The MACD for ETH/USD is losing momentum in the bullish zone.
Hourly RSI – The RSI for ETH/USD is now above the 50 level.
Major Support Level – $1,575
Major Resistance Level – $1,620
Price analysis 10/16: SPX, DXY, BTC, ETH, BNB, XRP, SOL, ADA, DOGE, TON

Stock markets flashed green at the weekly open, and crypto prices followed.
Protocol Village: ARPA Network’s Random Number Generator ‘Randcast’ Live on Optimism
The latest in blockchain tech upgrades, funding announcements and deals. For the week of Oct. 16-22, with live updates throughout.
Investor Demand for Ether Staking Yields Has Slowed: Coinbase
Staking yields have dropped to 3.5% from above 5% in the last few months, the report said.
Ethereum Price Avoids Collapse But Recovery Could Be Capped
Ethereum price managed to recover from the $1,520 level against the US dollar. ETH is now facing hurdles near the $1,565 and $1,600 resistance levels.
- Ethereum is attempting a recovery wave above the $1,550 level.
- The price is trading just above $1,550 and the 100-hourly Simple Moving Average.
- There was a break above a major bearish trend line with resistance near $1,555 on the hourly chart of ETH/USD (data feed via Kraken).
- The pair could start another decline unless there is a clear move above $1,565 and $1,600.
Ethereum Price Starts Minor Recovery
Ethereum managed to stay above the $1,500 and $1,520 levels. ETH formed a short-term support base and recently started a fresh increase from the $1,520 zone, like Bitcoin.
There was a move above the $1,550 resistance level. The price climbed above the 23.6% Fib retracement level of the main drop from the $1,664 swing high to the $1,521 low. Besides, there was a break above a major bearish trend line with resistance near $1,555 on the hourly chart of ETH/USD.
Ethereum is now trading just above $1,550 and the 100-hourly Simple Moving Average. However, the bears seem to be preventing an upside break above the $1,565 resistance.
If there is a clear move above the $1,565 resistance, Ether could rise toward the next major hurdle at $1,600. It is close to the 50% Fib retracement level of the main drop from the $1,664 swing high to the $1,521 low. A close above the $1,600 resistance might start a decent increase.
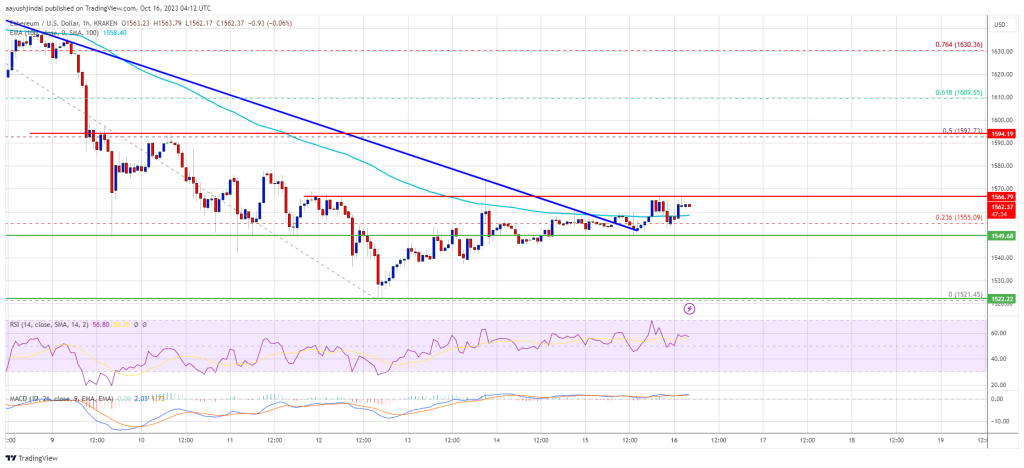
Source: ETHUSD on TradingView.com
In the stated case, Ether could rise and recover toward the $1,665 resistance. Any more gains might open the doors for a move toward $1,750.
Another Decline in ETH?
If Ethereum fails to clear the $1,565 resistance, it could start another decline. Initial support on the downside is near the $1,550 level and the 100-hourly Simple Moving Average.
The next key support is $1,520. A downside break below the $1,520 support might send the price further lower. In the stated case, the price could drop toward the $1,440 level. Any more losses may perhaps send Ether toward the $1,420 level.
Technical Indicators
Hourly MACD – The MACD for ETH/USD is losing momentum in the bullish zone.
Hourly RSI – The RSI for ETH/USD is now above the 50 level.
Major Support Level – $1,550
Major Resistance Level – $1,565
Best Time to Buy Ethereum Could Be Soon: Last Cycle Suggests
Ethereum has been in a descending channel against Bitcoin since August of last year, meaning Bitcoin has been the better investment over this time. However, historical trends show the tides could be changing soon, with Ethereum possibly on the brink of entering an accumulation phase.
Ethereum Price Action
Ethereum is trading at $1600, marking a 22% decrease from its price last August. Bitcoin, on the other hand, is 8% up over the same period.
This is a common trend that happens during bear markets. Coins with larger market capitalizations tend to be more resilient against price decreases as investors become more risk-averse and look to preserve their capital. While Ethereum isn’t short at a market capitalization of $187 billion, it’s still considerably lower than Bitcoin at $525 billion.
During bull markets, coins with lower market capitalization outperform Bitcoin again as investors lean towards assets with greater potential returns.
Ethereum Price Compared Against Bitcoin
When comparing ETH’s value to BTC, it’s evident that Ethereum has been trading within a descending channel since last August. This pattern, characterized by its lower highs and lower lows, often indicates a bearish trend in the market.
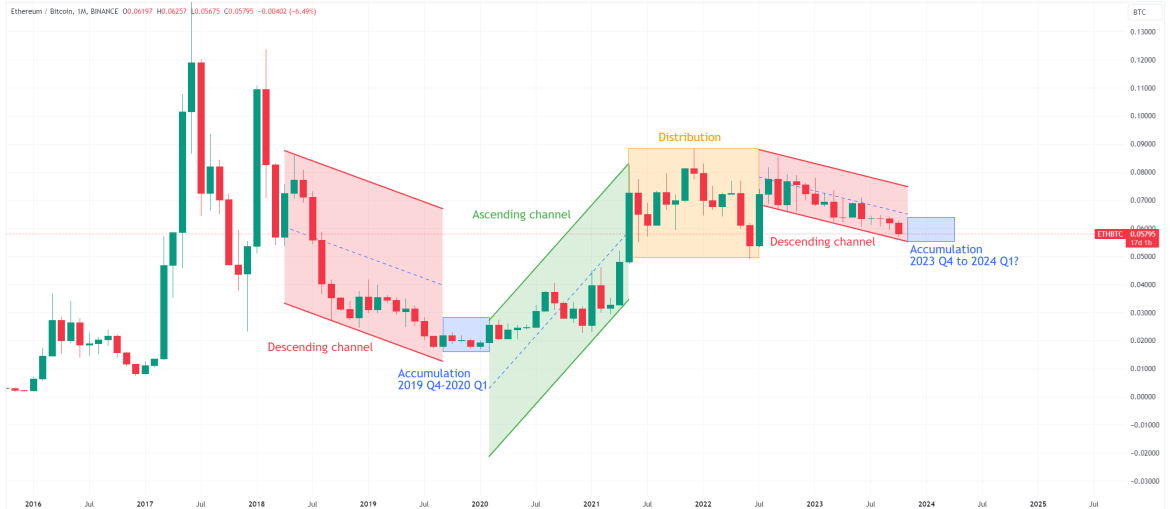
The chart above highlights three other distinct phases:
Accumulation phase: During this phase, price tends to stabilize, hinting at an upcoming change in momentum
Ascending channel: Here, the price experiences a significant reversal, often on a parabolic trajectory, characterized by highs and higher lows.
Distribution phase: In the final phase, the price ceases its upward movement. Investors typically use this phase to capitalize on their gains and liquidate their positions.
The accumulation phase is typically the best time for investors to convert their Bitcoin into Ethereum. This phase is marked by price holding on at the bottom and then showing signs of reversal. Ethereum is still forming lower lows against Bitcoin, so it has not entered the accumulation phase yet. However, the last cycle shows that this could be changing soon.
Last Cycle
Reflecting on the last cycle, Ethereum was in a descending channel against Bitcoin for 17 months. The accumulation phase then occurred from September 2019 up until February 2020. Based on the four-year theory, which suggests similar phases in the market occur every four years, this shows that the accumulation phase should also be approaching very soon in this cycle.
Yet, while the last cycle offers valuable insights, it’s important to note that no two cycles are the same. In the current cycle, ETH’s price action has not seen as much of a drop as in the previous cycle, which could be attributed to changing fundamentals and asset maturation.
Final thoughts
While an accumulation phase for Ethereum has not been confirmed yet, there remains the potential for its price to drop even further relative to Bitcoin. However, if the previous cycle is anything to go by, we could enter the accumulation phase soon. This phase typically presents prime buying opportunities for Ethereum.
Investment Disclaimer: The content provided in this article is for informational and educational purposes only. It should not be considered investment advice. Please consult a financial advisor before making any investment decisions. Trading and investing involve substantial financial risk. Past performance is not indicative of future results. No content on this site is a recommendation or solicitation to buy or sell securities or cryptocurrencies.
Predycto is the author of a cryptocurrency newsletter. Sign up for free. Follow @Predycto on Twitter.
On-Chain Tracker Notices Major Difference Between Bitcoin And Ethereum Whales
As earlier reported, Bitcoin holders have steadily held on to their coins in the past few months. Bitcoin whales, in particular, seem to be doubling despite the current uncertainty in Bitcoin’s future projection. Long-term holders add an average of 50,000 BTC to their wallets every month, as indicated by the HODLer Net Position Change indicator provided by Glassnode.
On the other hand, whales of Ethereum, the second largest crypto in the world, appear to be on a different trajectory. On-chain data has shown that while Bitcoin whales hoard their coins, Ethereum whales appear to be dumping their holdings in recent years.
Bitcoin Whales Buying More, Ethereum Whales Selling
Bitcoin whales, meaning the largest holders with 1000 BTC or greater, have been steadily accumulating more BTC since 2018, according to data from on-chain analytics firms. However, there have been sell-offs, either through extended bear markets or during profit-taking after a strong bullish uptrend.
A research analyst for Cryptoslate named James Straten posted on social media that Ethereum whales with more than 1,000 ETH have been selling since the same period. While sharing a Glassnode chart, he shared a correlation between the whales of the blockchains.
On-chain data shows ETH whales have offloaded 20 million ETH since 2022, with 12 million ETH being sold off this year alone.
Possible Explanation For The Contrasting Whale Activity
The story these on-chain metrics tell provides insight into the prevailing mood among large crypto holders of different blockchains.
Although the amount of ETH held by whales might indicate they have sold or moved their funds to other cryptocurrencies, a better possibility is that these whales transferred their ETH into Ethereum smart contracts. Since Ethereum version 2.0 kickstarted its journey in December 2020, the number of tokens in the staking protocol has grown significantly.
ETH 2.0 requires validators to stake 32 ETH in its deposit contract to validate transactions on the Ethereum blockchain. At the moment, the contract now has 31.2 million ETH worth $48.6 billion locked. This seems consistent with on-chain data, which shows that the percentage of supply tied in smart contracts overtook the supply in addresses holding 1000+ ETH in late 2020.
Crypto research analyst André Dragosch shared this correlation on social media platform X. The correlation buttresses that the Glassnode data doesn’t consider the ETH tied in smart contracts for its whale supply metric.
With a domination of 17.8% over the whole cryptocurrency market, the Ethereum blockchain continues to solidify its position as the undisputed leader of smart contracts. Unlike Bitcoin whales, bullish ETH whales are not just HODLing but employing techniques to maximize their crypto gains.
At the time of writing, ETH is trading at $1,557. However, a recently failed bullish pattern formation could send the price of ETH falling below $1,000.
Cover image from Unsplash, chart from Tradingview
This Trader Is On The Brink Of Losing Money, Will Selling WBTC On Aave V2 Help?
A trader on Aave, a decentralized liquidity protocol operating on multiple platforms, including Ethereum and OP Mainnet, has begun selling wrapped Bitcoin (WBTC) to repay outstanding debt, records on October 13 reveal. WBTC is a tokenized version of Bitcoin issued on Ethereum that allows holders to engage in decentralized finance (DeFi) activities.
Trader Selling WBTC To Repay Debt On Aave v2
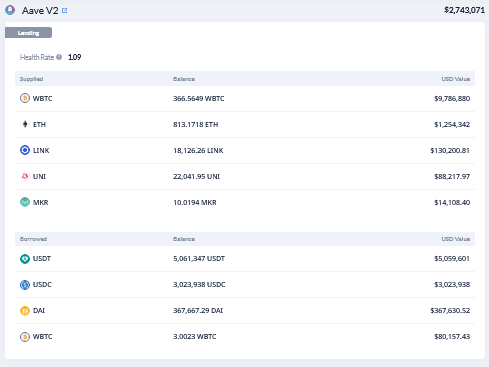
According to Lookonchain data, the unidentified trader marked with address “0x47ab” borrowed roughly $8 million worth of multiple stablecoins, including USDC, USDT, and DAI, Maker’s stablecoin, on Aave v2 after depositing various assets, including WBTC, Maker (MKR), and Ethereum (ETH) worth approximately $11 million.
When writing, the health factor of borrowed assets stands at 1.09, teetering close to liquidation. According to Aave’s documents, the health factor is a metric that compares the safety of collateral and borrowed loans to the underlying value. Technically, the higher it is, the safer the funds are from liquidation. If the health factor exceeds $1, deposited collateral will be liquidated to borrow outstanding loans.
Aave is a popular decentralized finance (DeFi) protocol where token holders can choose to supply liquidity and earn passive income. At the same time, users can deposit collateral and borrow overcollateralized loans, which they can repay at any time, provided the health factor is around 1. Since loans are overcollateralized, the collateral is usually higher than the borrowed amount.
Volatile Bitcoin Prices To Blame?
As it is, the trader, Lookonchain shows, has started selling WBTC to repay outstanding debt. A big chunk of what the trader supplied is in WBTC, standing at 366.56 WBTC, worth roughly $9.1 million at spot rates.
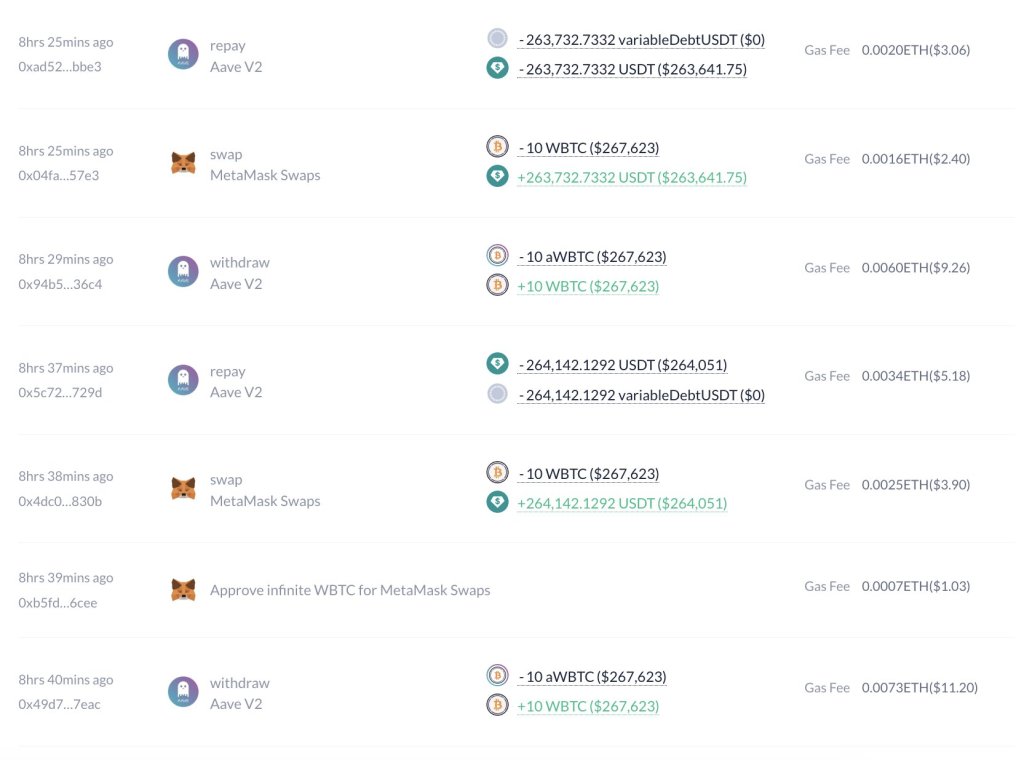
However, considering market prices have fluctuated recently, the contraction has impacted the health factor, increasing the risk of collateral liquidation. To counter this, the trader sold 3 WBTC for roughly $80,000.
The address still owes Aave V2 approximately $8.08 million, mostly in USDT, at around $5 million. There are $3 million of USDC and around $368,000 of DAI. It is unclear whether the trader will seek to borrow more, especially if Bitcoin prices increase.
The address remains long on MKR, the governance token of the MakerDAO protocol; Uniswap’s UNI; Chainlink’s LINK; and Ethereum. Besides WBTC, the trader’s second-largest holding is in ETH, while the smallest is MKR. Ironically, MKR has been one of the top-performing assets, rallying by over 160% in H2 2023 alone. The token peaked at $1,600 in early October before cooling off to spot rates.
Price analysis 10/13: BTC, ETH, BNB, XRP, SOL, ADA, DOGE, TON, DOT, MATIC

Bitcoin trades in a predictable range, but will the sideways price action tempt altcoin traders to open new positions?
Ethereum’s New Low-Fee Regime May Put Its ‘Ultra Sound Money’ Thesis to Test
The Ethereum network’s revenue from fees dropped to its lowest level since April 2020 as speculative activity disappeared and users migrated to layer 2s, IntoTheBlock said.
Ethereum price drops to a 7-month low as data points to more downside

Eth price is at risk of trading below a key price support and multiple data point point to a bearish outlook for the altcoin’s price.
Failed Bullish Pattern Could Send Ethereum Sub-$1000
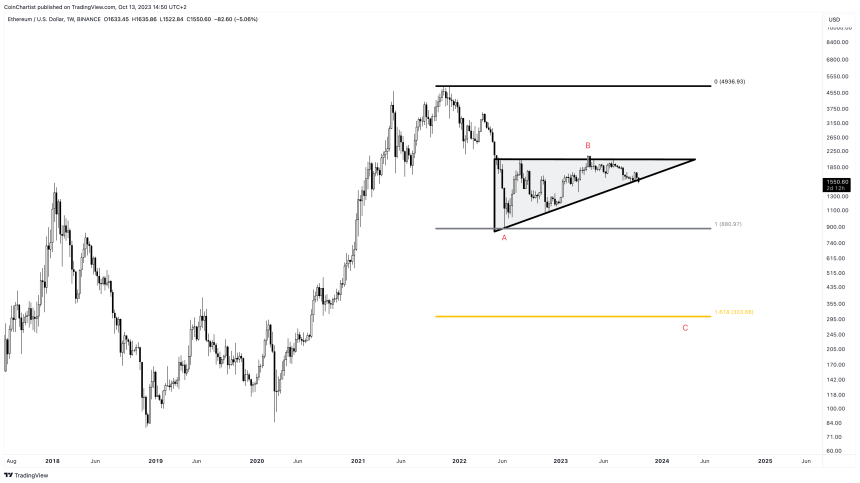
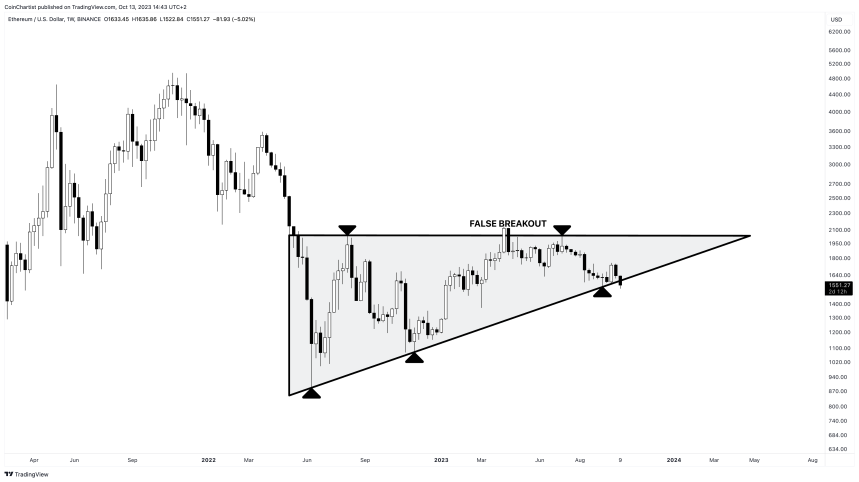
Ethereum price is trading at roughly $1,550 after failing to get back above $2,000 throughout the entirety of 2023 thus far. Increasingly higher lows during the year and a horizontal resistance zone had formed an ascending triangle – a potentially bullish chart pattern.
This pattern, however, is possibly failing. A busted pattern target could send the price per ETH sub-$1,000.
Ethereum Ascending Triangle Begins Breakdown: Target $700
Ethereum put in its bear market low back in June of 2022 while Bitcoin and other coins kept falling through the end of the year. Despite the early lead in a bear market recovery, ETH has underperformed against BTC in 2023. Now it is at risk of falling to a new low with a target of deep below $1,000 if a presumed bullish pattern breaks down instead of up.
ETHUSD has been trading in what appears to be a textbook ascending triangle pattern since its 2022 local low. A series of increasingly higher highs has created an upward slowing trend line. A horizontal resistance zone across $2,000 has kept price action at bay. Volume has been trending downward throughout the course of the pattern. Price is at roughly two-thirds to the triangle apex.
Ether even had positive news at its back: the launch of the first Ethereum Futures ETFs. Yet it has failed to produce any meaningful upside, and is now trying to move back down causing the bullish pattern to bust. If the pattern does break downward, it would have a target of around $700 per ETH based on the measure rule.
Elliott Wave Explained: Golden Fibonacci Extension Targets $300 ETH
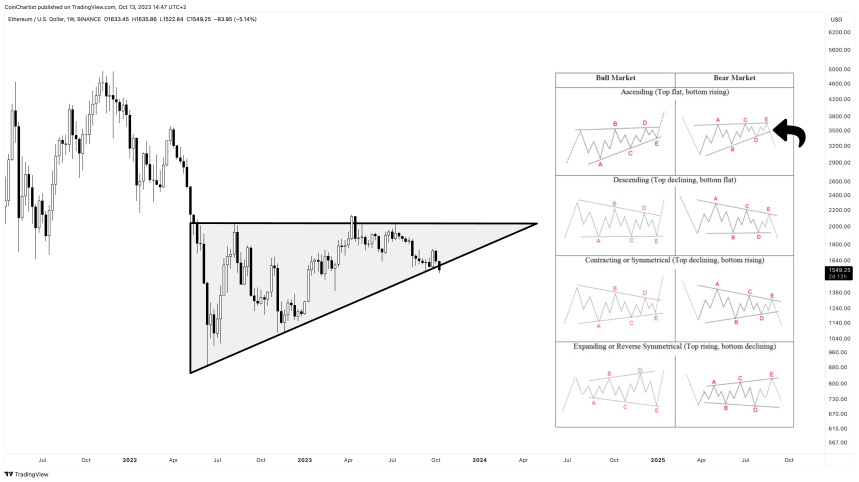
Although the ascending triangle is considered a bullish chart pattern, it only has a roughly 63% probability of breaking out, per the Encyclopedia of Chart Patterns by Thomas Bulkowski. The remaining 37% of the time break down. But technical analysis is a broad study. An ascending triangle to one trader, could be barrier triangle to another.
A barrier triangle is simply an ascending or descending triangle as defined by Elliott Wave Principle. In Elliott Wave Principle, triangles are especially telling. They only appear before the final move in a sequence. Because Elliott Wave labels waves with the trend as 1 through 5, triangles are corrective and appear only in the wave 4 place – just prior to wave 5 which ends the sequence.
In a bear market, corrective structures are labeled ABC. Triangles themselves can appear during a B wave, which once again, is ahead of the final move in the ABC count. C wave targets are often found by projecting the 1.618 Fibonacci ratio from the A wave. This makes the target of the busted pattern somewhere around $300 per ETH. Between the measure rule and the Fibonacci extension target, Ethereum could be facing sub-$1,000 prices in the future.