Ethereum price started a recovery wave above the $1,780 level against the US Dollar. ETH must clear $1,820 to start a decent increase in the near term.
- Ethereum is currently consolidating below the $1,820 resistance zone.
- The price is trading below $1,820 and the 100-hourly Simple Moving Average.
- There is a major bearish trend line forming with resistance near $1,818 on the hourly chart of ETH/USD (data feed via Kraken).
- The pair could start a decent increase if it settles above the $1,820 resistance.
Ethereum Price Recovery Faces Hurdle
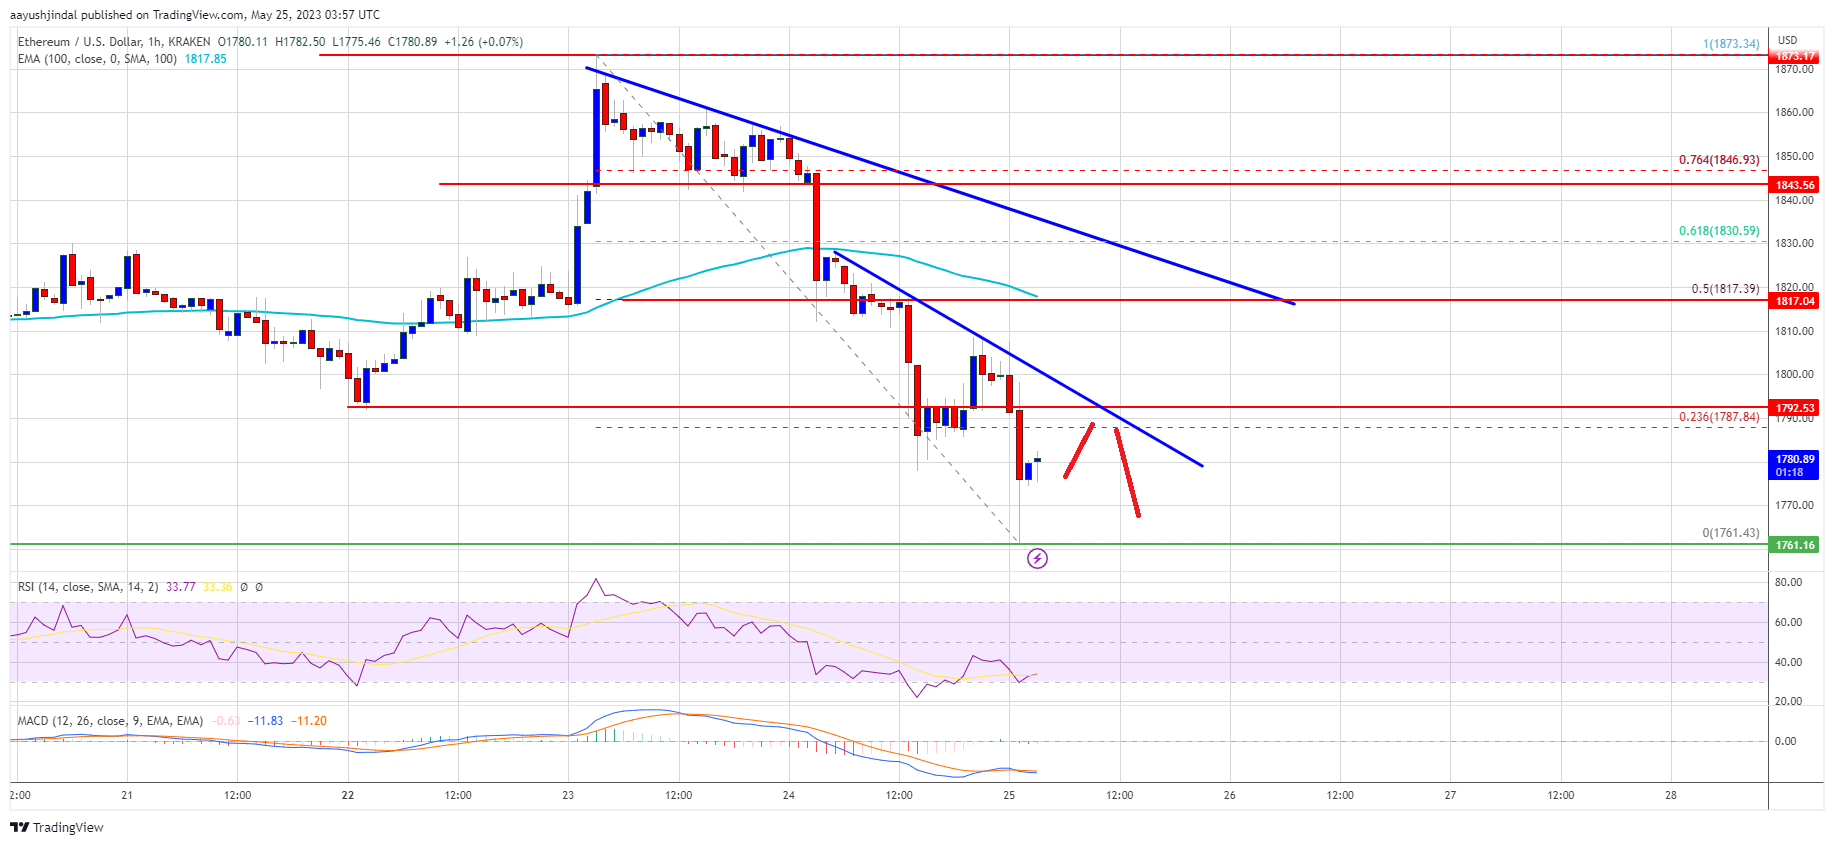
Ethereum’s price extended its decline below the $1,800 zone. ETH even declined below the $1,780 level before the bulls appeared near $1,760, similar to Bitcoin.
A low was formed near $1,761 and the price is currently attempting a recovery wave. It is trading above the 23.6% Fib retracement level of the key decline from the $1,872 swing high to the $1,761 low. Ether is now trading below $1,820 and the 100-hourly Simple Moving Average.
There is also a major bearish trend line forming with resistance near $1,818 on the hourly chart of ETH/USD. The trend line is close to the 50% Fib retracement level of the key decline from the $1,872 swing high to the $1,761 low.
Immediate resistance is near the $1,818 zone and the trend line. The first major resistance is near the $1,820 level. A close above the $1,820 resistance could send Ether toward $1,845.
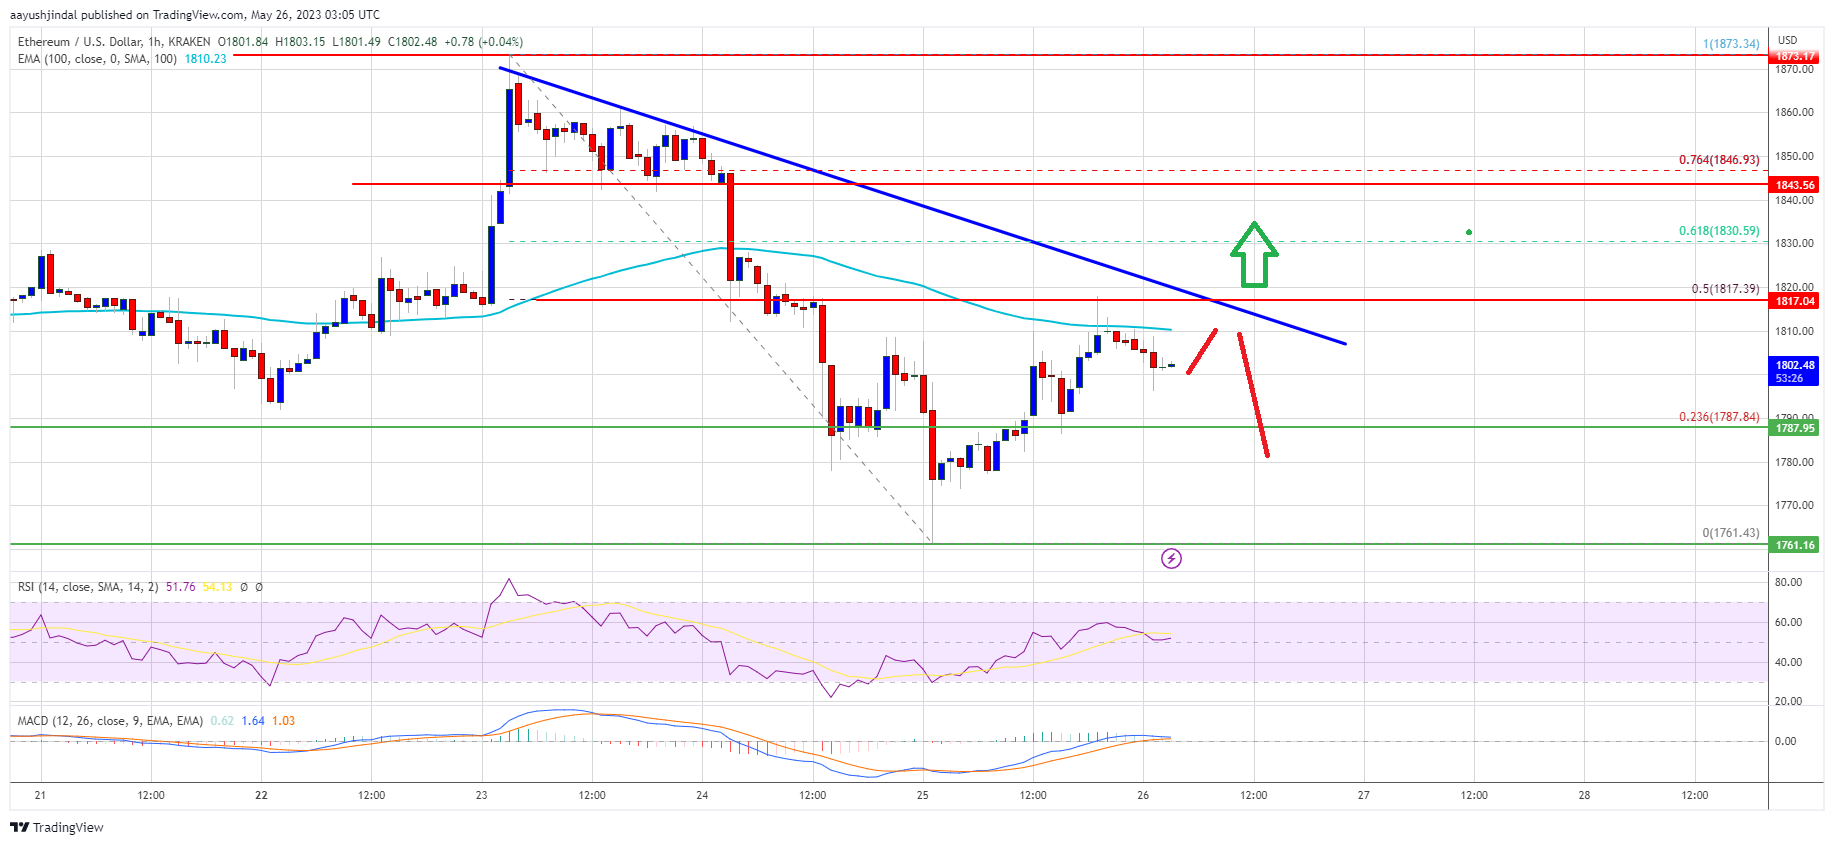
Source: ETHUSD on TradingView.com
The next resistance sits near $1,875, above which Ethereum could rise toward $1,920. Any more gains above the $1,920 resistance zone could push the price toward the $2,000 resistance.
Fresh Decline in ETH?
If Ethereum fails to clear the $1,820 resistance, it could start another bearish wave. Initial support on the downside is near the $1,785 level.
The next major support is near the $1,760 zone or the recent swing low. If there is a close below the $1,760 support, the price could start another major decline. In the stated case, the price might drop toward the $1,700 support zone. Any more losses may perhaps send the price toward the $1,660 level in the coming days.
Technical Indicators
Hourly MACD – The MACD for ETH/USD is losing momentum in the bullish zone.
Hourly RSI – The RSI for ETH/USD is above the 50 level.
Major Support Level – $1,785
Major Resistance Level – $1,820