
Polygon Labs and Google Cloud will team up in a multi-year agreement to drive the development and adoption of the Ethereum scaling protocol’s infrastructure and developer tools.
Cryptocurrency Financial News
Polygon Labs and Google Cloud will team up in a multi-year agreement to drive the development and adoption of the Ethereum scaling protocol’s infrastructure and developer tools.
Ethereum price is trading in a positive zone above $1,850 support against the US Dollar. ETH could rally toward $2,000 if it stays above the $1,880 support.
Ethereum’s price started a fresh increase from the $1,800 support zone. ETH gained pace and was able to settle above the $1,850 resistance zone, similar to Bitcoin.
The upward move was such that the price even cleared the $1,880 resistance. A high is formed near $1,940 and the price is now consolidating gains. It is trading near the 50% Fib retracement level of the recent increase from the $1,873 swing low to the $1,940 high.
Ether price is also well above $1,850 and the 100-hourly Simple Moving Average. Besides, there is a key contracting triangle forming with resistance near $1,920 on the hourly chart of ETH/USD.
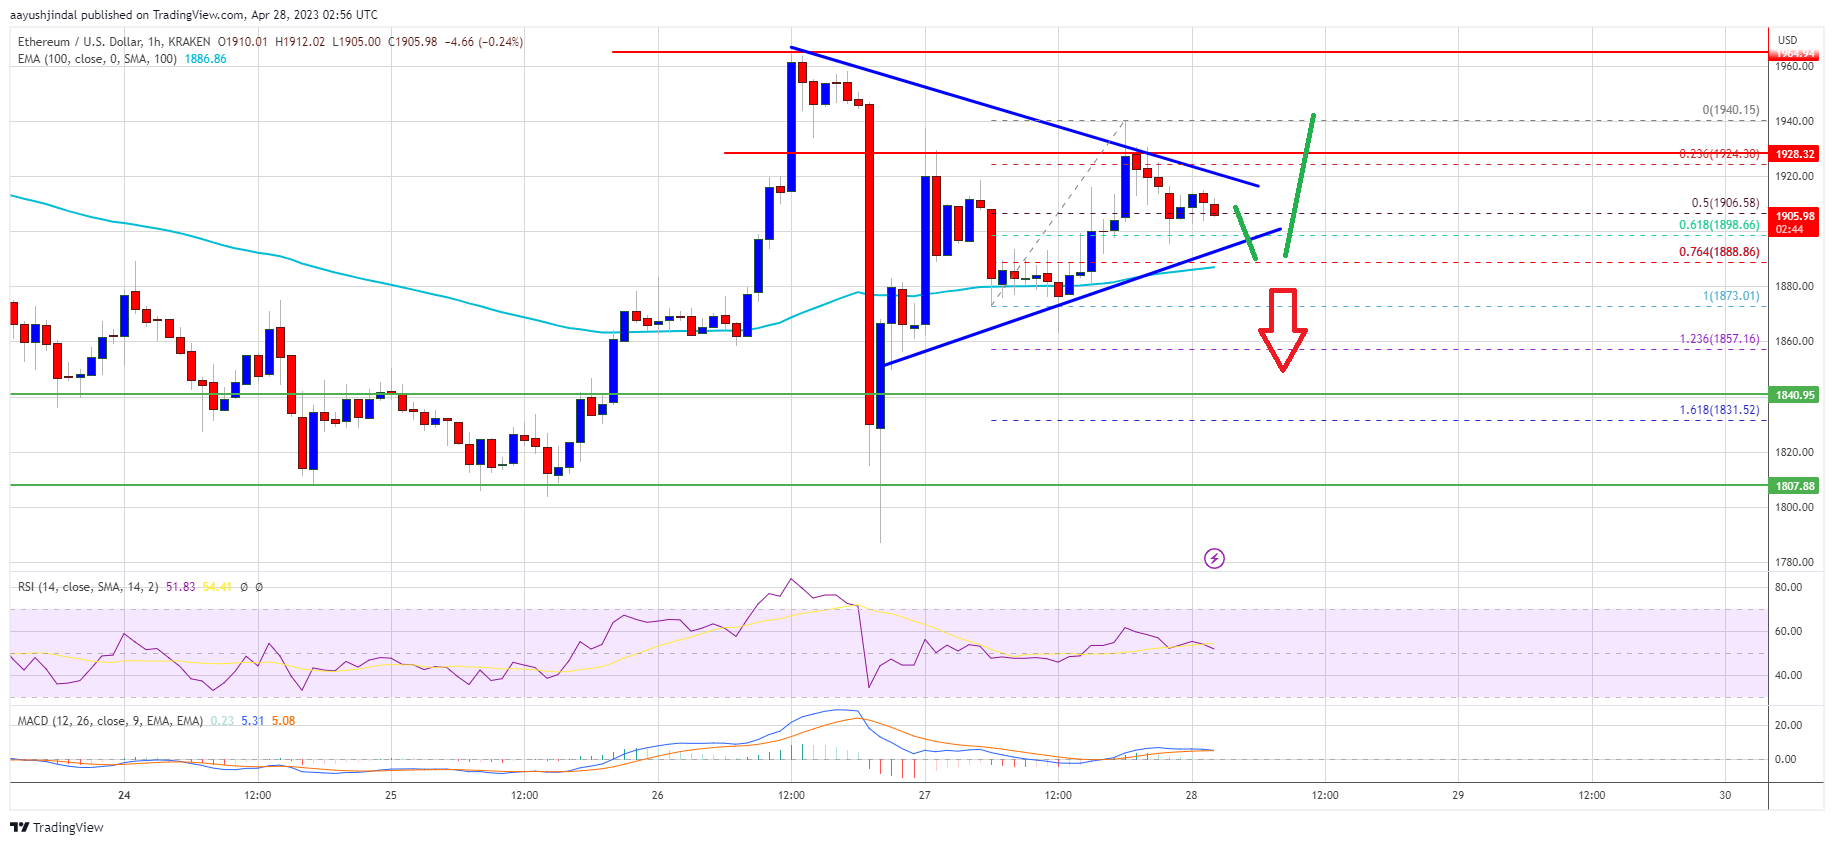
Source: ETHUSD on TradingView.com
Immediate resistance is near the $1,925 level and the triangle region. A close above the $1,925 level might start a fresh rally. In the stated case, the price could rise toward the $1,960 resistance. Any more gains could send Ether toward the $2,000 resistance. Finally, if the bulls remain in action, there could be a drift toward the $2,120 level where the bears might take a stand and protect more gains.
If Ethereum fails to clear the $1,925 resistance, it could start another decline. Initial support on the downside is near the $1,890 level and triangle trend line.
The next major support is near the $1,880 zone or the 100-hourly Simple Moving Average. It is close to the 76.4% Fib retracement level of the recent increase from the $1,873 swing low to the $1,940 high, below which ether price might revisit the $1,840 support zone. Any more losses may perhaps take the price toward $1,800 in the near term.
Technical Indicators
Hourly MACD – The MACD for ETH/USD is now losing momentum in the bullish zone.
Hourly RSI – The RSI for ETH/USD is above the 50 level.
Major Support Level – $1,880
Major Resistance Level – $1,925

The SEC boss reiterated that “the law is clear” on cryptocurrencies being securities, while others highlighted the lack of regulatory clarity in the U.S.

Ether traders have been neutral-to-bearish for the past week, indicating little confidence in ETH breaking above $2,000.
The native currency of Avalanche, AVAX, remains under pressure despite Circle’s effort to launch a facility that will enable the direct transfer of USDC between Ethereum and Avalanche blockchains.
Avalanche is a smart contracting platform with sub-second transaction finality and a rival of Ethereum. However, considering the first-mover advantage of Ethereum and the activity level on the pioneer smart contracting platform, Avalanche lags even though it offers high scalability translating to relatively low trading fees.
Despite the launch of the Cross-Chain Transfer Protocol (CCTP) by Circle, the team behind USDC, a stablecoin; AVAX remains under trading range and has been unable to move higher, reversing recent losses.
When writing on April 27, AVAX is down 18% from April 2023 highs of around $20 and down roughly 10% in the last trading week, according to CoinMarketCap data.
Although the market uptrend of April 26 temporarily forced AVAX higher, buyers on April 27 didn’t follow through. AVAX remains below the local resistance at $18 but above last week’s support at around $16.
However, from a broader perspective, AVAX is up 25% from March 2023 lows and has gained 65% from December 2022 lows. The impressive performance was a huge boost for AVAX, a coin that plunged 88% from November 2021 peaks when it was changing hands at around $145.
Based on the current AVAX formation, it is yet to be seen whether fundamental events will trigger demand and push the coin above $20, reversing this week’s losses.
The decision by Circle to develop and launch a mainnet protocol for bidirectional cross-chain transfers between Ethereum and Avalanche will be convenient for users.
It could also boost decentralized finance (DeFi) activities in Avalanche since users don’t have to use a third party, effectively eradicating the need for bridges and helping consolidate the web3 ecosystem. This would also have a significant effect on general liquidity on the Avalanche blockchain.
Avalanche is suited for the development of decentralized finance (DeFi) dapps and as of April 27, the blockchain managed over $798 million as measured by the total value locked (TVL), according to DeFiLlama. Aave, a lending protocol available in, among other chains, Ethereum, is the largest DeFi dapp by TVL, managing $262 million.
Besides liquidity, considering the mega hacks of 2022, for example, the Ronin and BNB Chain Bridge hacks, the Cross-Chain Transfer Protocol (CCTP) also boosts security for users and DeFi protocols.
Circle said several firms, including MetaMask, Celer, and Wormhole, have pledged to use the CCTP.
The benchmark is derived from daily transaction fees and staking rewards generated by Ethereum, bringing pricing tools that institutional investors expect into digital assets.
Ethereum, the second-largest cryptocurrency by market cap, is facing another bout of turbulence as it experiences a fresh influx of coins into exchange addresses.
According to recent data, this surge in Ethereum inflows is reminiscent of a similar occurrence that coincided with a drop in the cryptocurrency’s value below the $2,080 mark.
The question on the minds of traders and enthusiasts alike is, will this latest wave of inflows lead to a similar outcome?
In the past week, Ethereum experienced a decline of 3.51%, with bulls barely managing to keep prices above the $2,000 support zone. However, when Bitcoin was rejected at the $30,000 mark, Ethereum also saw a drop in value.
Despite this bearish trend, the cryptocurrency managed to post a 1% gain in the last 24 hours and is currently priced at $1,886 according to CoinMarketCap.
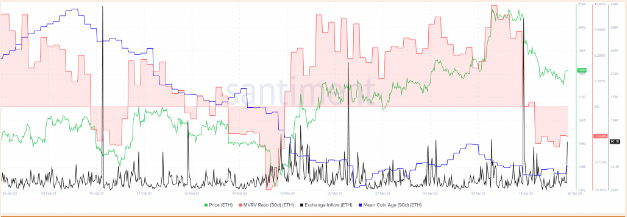
The 30-day MVRV (Market Value to Realized Value) ratio for Ethereum, which measures the average profit or loss of all addresses that acquired ETH within the past month, retreated from a three-month peak in mid-April to negative values at the time of writing.
This drop was a result of intense selling pressure over the past two weeks, which saw ETH’s value decline from $2,125 to $1,820.
The MVRV values indicated that short-term holders of ETH were at a loss, and that the average age of the coins has not changed much in the last week, but it has gone up a little bit in the last few days.
Based on the data of exchange inflow over the past week, it appears that there is a high likelihood of further selling taking place soon.
Given the current market sentiment and technical indicators, it’s possible that Ethereum could see further losses in the coming days. If the bears continue to dominate the market, the cryptocurrency could break through the $1800 support level and head towards the $1,600 range.
However, if the bulls manage to gain momentum, Ethereum could potentially see a price movement towards the $2,000 range. The 4-hour chart shows a resistance level at $1,890, which, if broken, could lead to a potential price increase.
It’s important to note that cryptocurrency markets are notoriously volatile and unpredictable, and unexpected events could always occur that impact the price of Ethereum. As always, traders should exercise caution and carefully analyze market trends before making any investment decisions.
While Ethereum has experienced losses in the past week, there is still potential for a price increase if the bulls manage to gain momentum. However, the current market sentiment and technical indicators suggest that further losses could be in store.
It remains to be seen how the market will develop in the coming days and weeks, and traders should remain vigilant and adapt to changing conditions.
-Featured image from TipRanks
Ethereum price saw swing moves from the $1,800 support against the US Dollar. ETH is again rising and might aim for a retest of the $2,000 resistance.
Ethereum’s price saw a couple of swing moves from the $1,800 support zone. First, ETH rallied above the $1,900 resistance. However, it faced a strong selling interest near $1,960 and reacted to the downside.
There was a sharp 10% drop below $1,900, similar to Bitcoin from $30,000. The price retested the main $1,800 support zone. A low is formed near $1,787 and the price is again rising. It is trading above $1,850 and the 100-hourly Simple Moving Average.
Ether is also trading above the 61.8% Fib retracement level of the recent drop from the $1,964 swing high to the $1,787 low. Immediate resistance is near the $1,920 zone. Besides, there is a connecting bearish trend line forming with resistance near $1,925 on the hourly chart of ETH/USD.
The trend line is close to the 76.4% Fib retracement level of the recent drop from the $1,964 swing high to the $1,787 low. A close above the $1,925 level might spark more bullish moves.
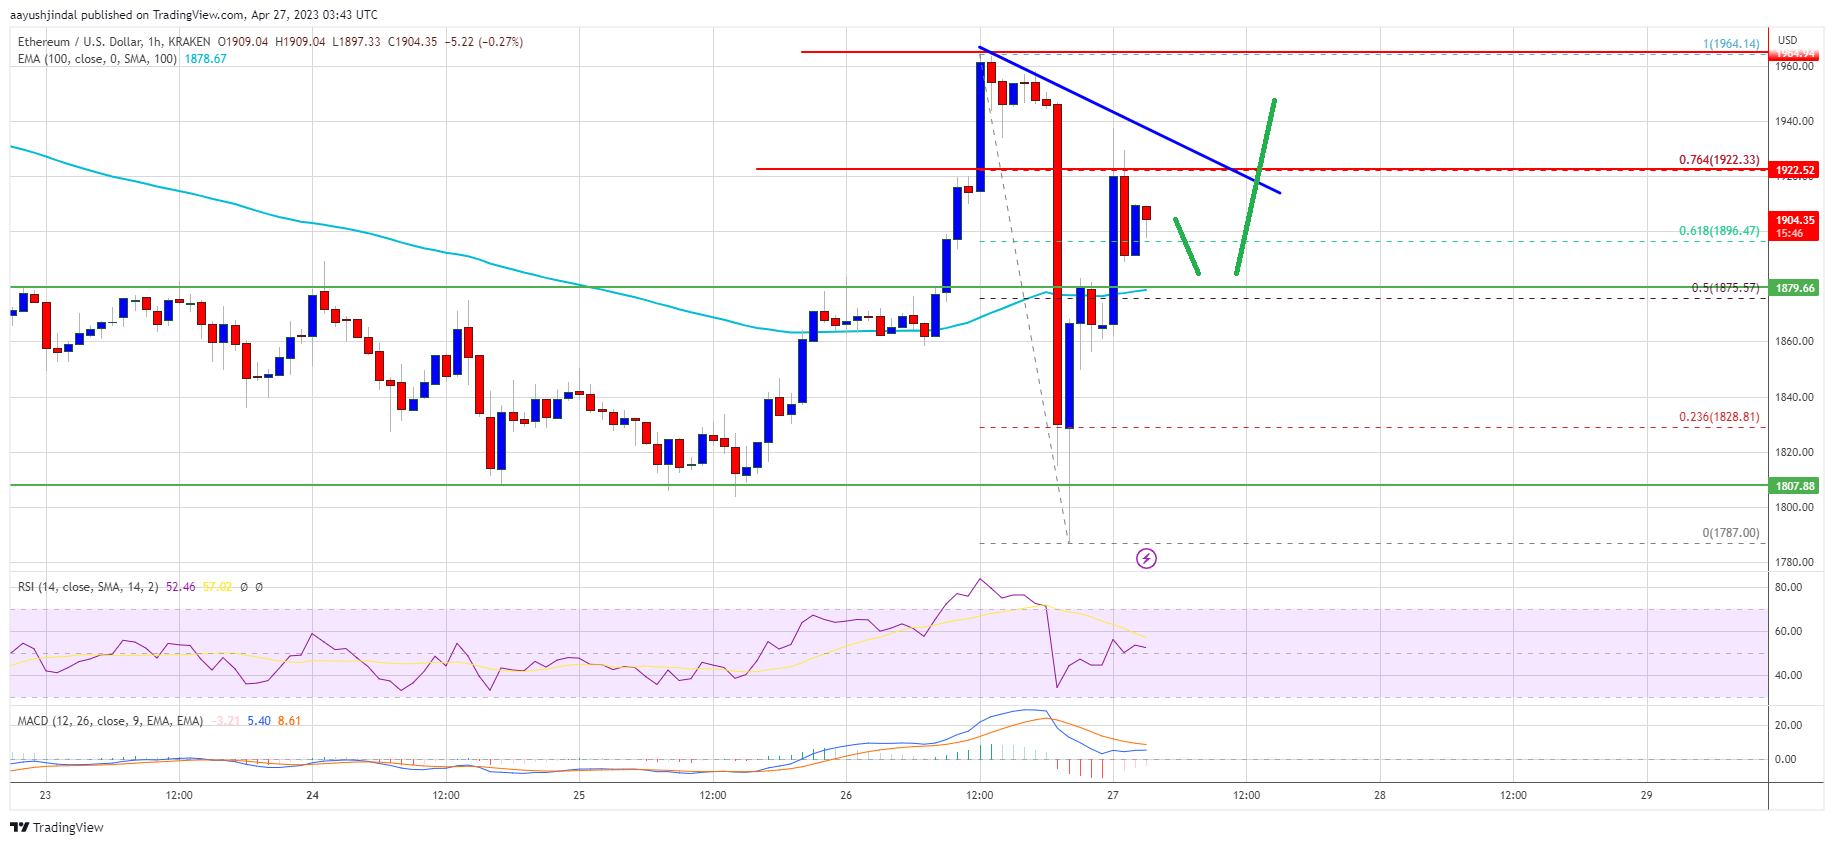
Source: ETHUSD on TradingView.com
In the stated case, the price could rise toward the $1,960 resistance. Any more gains could send Ether toward the $2,000 resistance, above which the bulls might aim for a move toward $2,120.
If Ethereum fails to clear the $1,925 resistance, it could start another decline. Initial support on the downside is near the $1,880 level and the 100-hourly Simple Moving Average.
The next major support is near the $1,840 zone, below which ether price might revisit the $1,800 support zone. Any more losses may perhaps take the price toward $1,720 in the near term.
Technical Indicators
Hourly MACD – The MACD for ETH/USD is now gaining momentum in the bullish zone.
Hourly RSI – The RSI for ETH/USD is above the 50 level.
Major Support Level – $1,880
Major Resistance Level – $1,925
In a wide ranging conversation, four crypto industry senior executives discussed what’s next in the digital asset market’s evolution.

The new layer relies on Bundlr, a decentralized storage platform built on Arweave, for mass storage of social media data.
Token airdrops – and the prospect of them – have become a major customer acquisition strategy for Ethereum’s layer 2 scaling projects. But is this strategy a sustainable one?
If Bitcoin’s energy consumption can be thought of as a skyscraper, Ethereum’s energy use post-Merge, would be the size of a raspberry, according to University of Cambridge research.
Ethereum price started an upside correction from $1,800 against the US Dollar. ETH could continue to rise if it clears the $1,900 and $1,920 resistance levels.
Ethereum’s price extended its decline below the $1,820 zone. However, ETH remained well-bid above the $1,800 level and recently started an upside correction, similar to Bitcoin from $27,000.
There was a move above the $1,825 and $1,840 resistance levels. Besides, there was a break above a key bearish trend line with resistance near $1,828 on the hourly chart of ETH/USD. The pair traded above the 50% Fib retracement level of the recent drop from the $1,890 high to the $1,807 low.
Ether price is now trading above $1,850 and the 100-hourly Simple Moving Average. It is testing the 76.4% Fib retracement level of the recent drop from the $1,890 high to the $1,807 low.
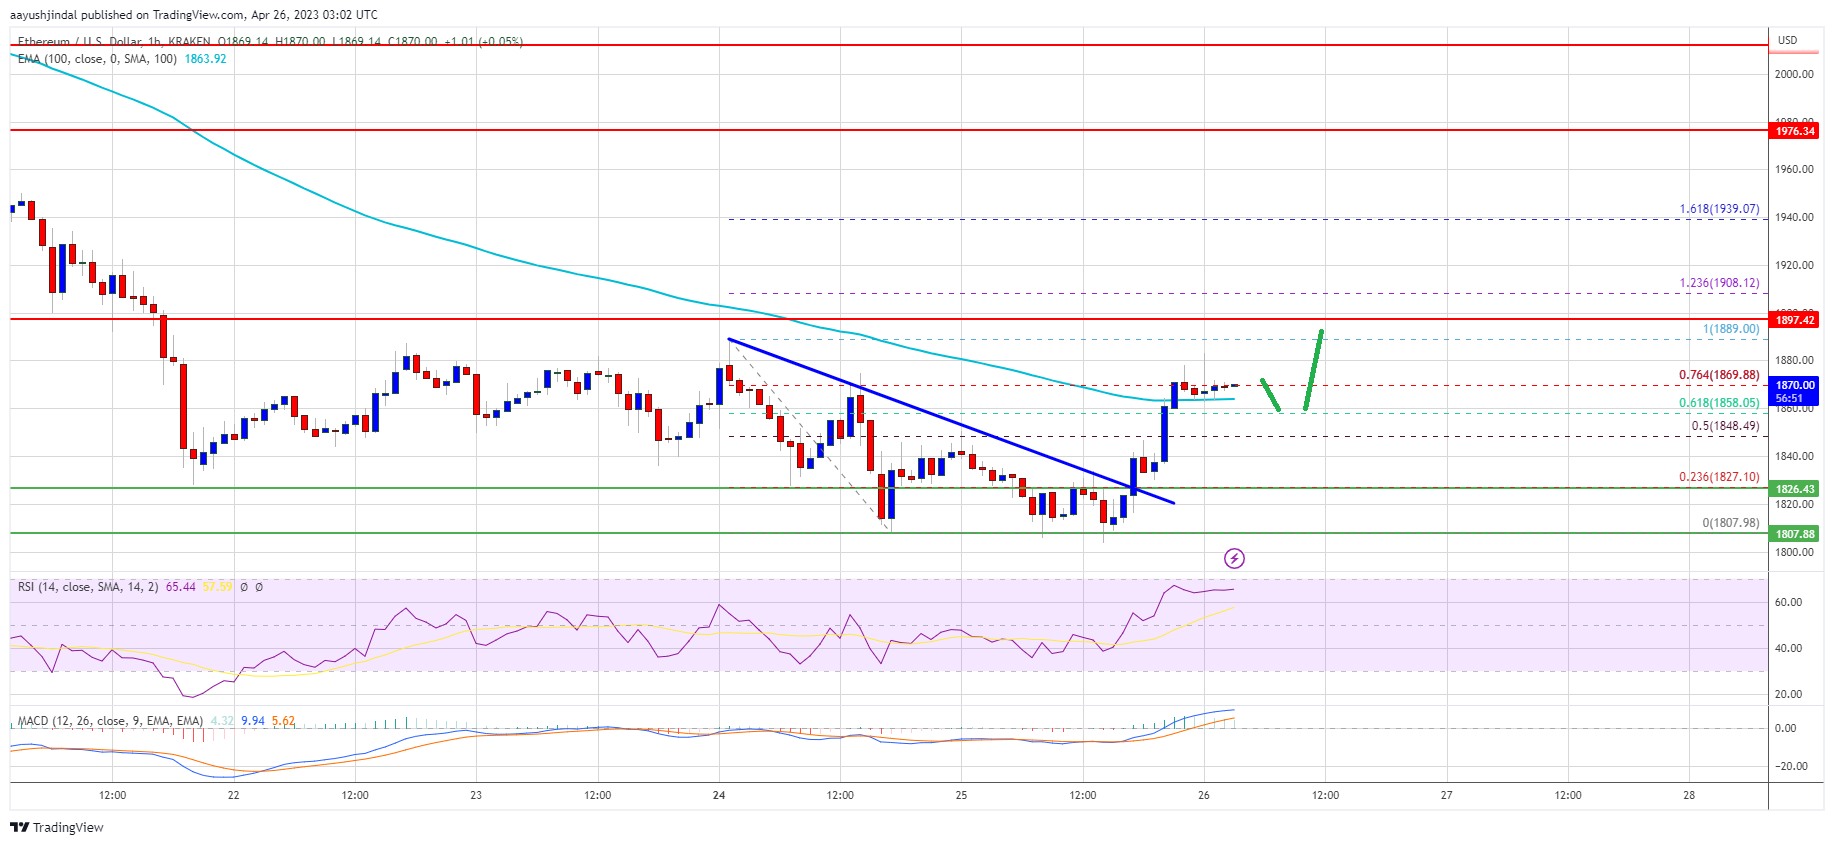
Source: ETHUSD on TradingView.com
Immediate resistance is near the $1,880 zone. The next major resistance is near $1,900. The main resistance sits near the $1,920 level. A close above the $1,900 level and a move above $1,920 could spark bullish moves. In the stated case, the price could rise toward the $2,000 resistance. Any more gains could send Ether toward the $2,080 resistance.
If Ethereum fails to clear the $1,880 resistance or the $1,900 barrier, it could start another decline. Initial support on the downside is near the $1,860 level and the 100-hourly Simple Moving Average.
The next major support is near the $1,825 zone, below which ether price might revisit the $1,800 support zone. If the bulls fail to protect $1,800, the price might gain bearish momentum. In the stated case, the price might decline toward $1,765. Any more losses may perhaps take the price toward $1,700 in the near term.
Technical Indicators
Hourly MACD – The MACD for ETH/USD is now gaining momentum in the bullish zone.
Hourly RSI – The RSI for ETH/USD is above the 50 level.
Major Support Level – $1,825
Major Resistance Level – $1,900
Ethereum’s (ETH) staking ecosystem has made headlines in the blockchain space since the recent Shanghai upgrade. As the crypto market continues to grow, Ethereum has emerged as a market leader in staking, offering some of the best yields and attracting more investors. But what exactly makes Ethereum’s staking so attractive?
According to DeFi Ignas, a leading expert in decentralized finance (DeFi), Ethereum’s ETH has the best token economics in crypto. One of the main reasons for this is Ethereum’s decision to move away from the Proof of Work (PoW) to a Proof of Stake (PoS) consensus mechanism.
He suggests that If Ethereum had remained on PoW, $4.7 billion worth of ETH would have been issued, more than the entire market cap of UNI, Uniswap’s native token, at $4 billion. This move has made Ethereum supply deflationary, creating a more valuable asset for investors.
However, as DeFi Ignas points out, Ethereum’s staking ratio currently stands at just 14.8%, the lowest among major blockchains. This is despite offering a competitive ~4.5% APR. One reason for this low staking ratio is that other blockchains have a more concentrated token distribution, with insiders, team members, and early investors actively staking for rewards.
According to DeFi Ignas, recent data suggests that the staking landscape is shifting, with some major players losing market share and a significant amount of ETH being withdrawn from staking platforms. In particular, Kraken, Coinbase, and Huobi have all seen a decline in their market share in the past month. Furthermore, 36% of all ETH staking withdrawals originate from Kraken.

It’s worth noting that when there are more withdrawals than deposits, it typically indicates a bearish sentiment among investors, as they sell their holdings in larger quantities than they are buying. This is further supported by the fact that around 40% of all ETH stakers have a negative ETH PnL, meaning they are holding ETH at a loss.
However, there is a silver lining to this data. According to DeFi Ignas, 29% of all ETH stakers have staked their ETH at the current price, which suggests that there are still many investors who believe in the long-term potential of ETH and are willing to hold onto their investments despite short-term market fluctuations, which for him, this is a bullish sign for the future of Ethereum staking.
ETH Staking, The Best Risk/Reward Option For Financial Freedom?
According to DeFi Ignas, Ethereum staking is poised to overtake decentralized exchanges (DEXes) by total value locked (TVL), with just 15% of all ETH currently staked across 83 protocols.
Also, despite being a relatively new industry, the Liquidity Staking Derivative (LSD) ecosystem has already surpassed lending, bridging, and CDP stablecoins in terms of TVL, and it’s expected to continue growing in the future.
Additionally, Distributed Validator Technology (DVT), which enables “squad staking” by allowing groups to stake different amounts of ETH collectively, is another trend gaining traction in the Ethereum staking ecosystem.
On the same note, the prominent crypto analyst McKenna has stated in a recent Twitter post that Ethereum’s staking rate has increased from 14.15% to 14.93% post-Shanghai, and this trend is expected to continue. McKenna predicts that ETH staking will become a major sink, with a staking rate close to 20% by the end of the year.
The increase in staking is also a bullish sign for the future of Ethereum, as it demonstrates the community’s commitment to the network and its success. As more funds are locked in staking, the circulating supply of ETH decreases, creating a scarcity that could potentially drive up the asset’s price.
Featured image from Unsplash, chart from TradingView.com
Ethereum (ETH) has seen a surge in price throughout April, and this increase has corresponded with a significant milestone for Ethereum’s Layer 2 networks: the total value locked (TVL) has surpassed $10 billion as of April 14, according to L2Beat, an analytics and research website about Ethereum layer 2 scaling.
This marks a new record high for the amount of ETH locked on the Ethereum network since the Shapella upgrade. With the TVL of Ethereum’s Layer 2 networks hitting an all-time high, many are speculating about the potential for further growth and adoption of these companion networks.
After the Shapella Upgrade was put in place, the price of Ethereum [ETH] became more volatile. Still, the Ethereum network has gotten a lot of attention, as shown by the fact that most deposits have been made on its beacon chain. There have been more deposits compared to withdrawals on the networrk.
As more and more users turn to Layer 2 solutions to address the high fees and congestion on the main Ethereum network, it remains to be seen how this trend will continue to evolve in the coming months.

Nansen’s records show that since the Shapella upgrade, the amount of ETH locked on the Ethereum network has reached a new all-time high. As of April 24, the total amount of ETH locked was 18,879,775 ETH.
TVL is a metric used in the cryptocurrency world to measure the amount of digital assets locked in various protocols or applications. It is often used as an indicator of the level of activity and demand within a specific DeFi (decentralized finance) ecosystem.
The TVL of Ethereum’s Layer 2 networks, which are complementary networks to Ethereum, also increased along with the rising value of ETH in April, peaking at a record high of $10 billion on mid-April.

Despite a decline in crypto prices, the TVL has since remained at around $9.22 billion, more than double its value at the start of the year, according to L2Beat, a layer 2 analytics site.
However, it is worth noting that there is currently approximately 4.7% of the total ETH on the Beacon chain waiting for full exit, which includes rewards amounting to 894,671 ETH. Furthermore, 27,809 validators are currently waiting for a full exit.
Meanwhile, Glassnode’s recent data has revealed a decrease in whale interest in ETH, with the total number of addresses holding more than 10 ETH reaching a four-month low of 349,078.
This can be attributed to the increasing long/short difference, which suggests that many short-term holders have sold their holdings and exited their positions.
#Ethereum $ETH Number of Addresses Holding 10+ Coins just reached a 4-month low of 349,078
Previous 4-month low of 349,082 was observed on 23 April 2023
View metric:https://t.co/6ggy1nLbSD pic.twitter.com/BsKhJDysPR
— glassnode alerts (@glassnodealerts) April 24, 2023
As a result, the future of ETH’s prices will depend heavily on the behavior of long-term holders.
Despite this decline, the current Ethereum price on CoinMarketCap is $1,829.37, showing a 1.48% decrease in the past 24 hours.
Only time will tell if long-term holders will continue to support ETH or if the decline in whale interest will have a lasting impact on its value.
-Featured image from CoinChapter

Another chunk of ETH has been withdrawn due to Kraken, but deposits going onto the network have almost matched them.
Ethereum price is showing bearish signs below $1,920 against the US Dollar. ETH could continue to move down if it clears the $1,800 support zone.
Ethereum’s price attempted a short-term upside correction from the $1,820 zone. ETH climbed above the $1,850 resistance zone but upsides were limited, similar to Bitcoin.
Ether traded as high as $1,889 and recently started a fresh decline. There was a break below the $1,820 level. A new weekly low is formed near $1,807 and the price is now consolidating losses. It is trading below $1,900 and the 100-hourly Simple Moving Average.
There is also a key bearish trend line forming with resistance near $1,845 on the hourly chart of ETH/USD. Immediate resistance is near the $1,845 zone and the trend line. It is close to the 50% Fib retracement level of the recent decline from the $1,889 high to the $1,807 low.
The next major resistance is near $1,860 or the 61.8% Fib retracement level of the recent decline from the $1,889 high to the $1,807 low. An upside break above $1,860 might send Ethereum toward $1,900. The main resistance is still near the $1,920 level.
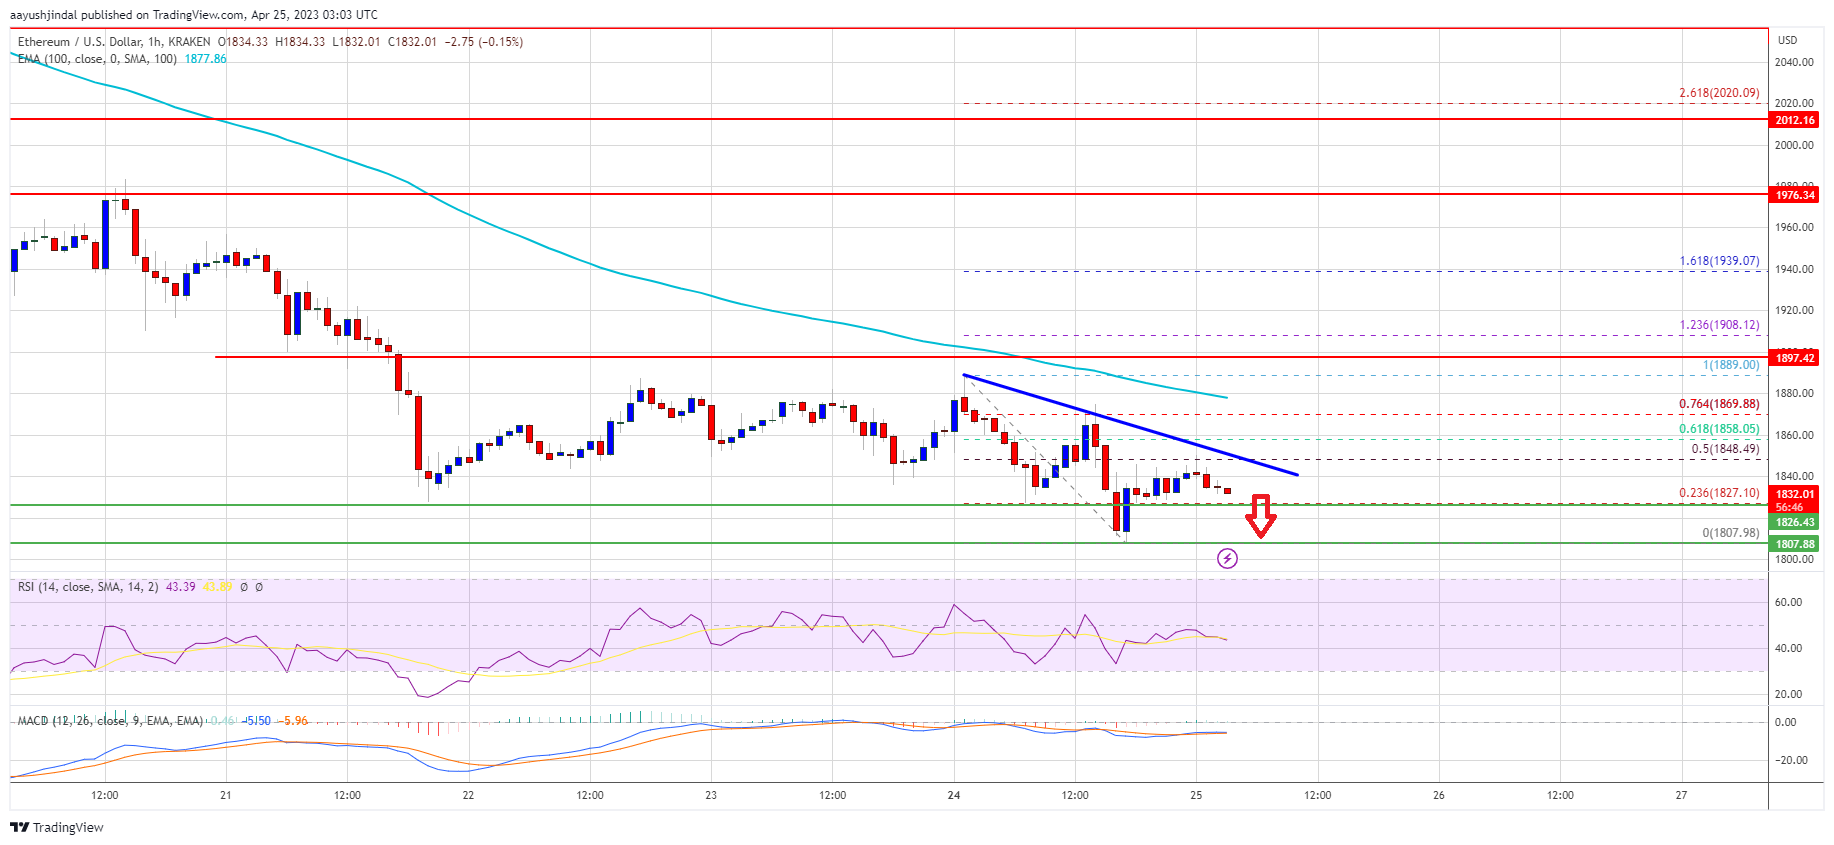
Source: ETHUSD on TradingView.com
If the bulls can push Ether above the $1,920 level, there could be a steady increase. In the stated case, the price could rise toward the $2,000 resistance. Any more gains could send Ether toward the $2,080 resistance.
If Ethereum fails to clear the $1,845 resistance, it could continue to move down. Initial support on the downside is near the $1,810 level.
The next major support is near the $1,800 zone, below which ether price might gain bearish momentum. In the stated case, the price might decline toward $1,765. Any more losses may perhaps take the price toward $1,700.
Technical Indicators
Hourly MACD – The MACD for ETH/USD is now gaining momentum in the bearish zone.
Hourly RSI – The RSI for ETH/USD is below the 50 level.
Major Support Level – $1,800
Major Resistance Level – $1,920
The influx into ETH staking was mainly driven by deposits from institutional staking platforms and reinvesting rewards, crypto analysts said.


