MATIC Bullish Signals Abound: Technical Indicators Hint At Sustained Uptrend

MATIC is the native utility token of the Polygon blockchain and it is currently ranked 18th by market cap, with a total supply of 10 billion MATIC and a total trading volume of over $204 million in the last 24 hours. It has been moving upward since its last rejection at a $0.6342 support level.  

Following the recent bullish trend of the crypto market, MATIC has not been left behind as the price has been on an uptrend with very strong momentum for a while now. Since its last rejection point, MATIC has seen a price reversal of over 10%.

Technical Indicators Point Toward Sustained Uptrend For MATIC

To figure out where MATIC’s price might be headed next, several indicators can be used to examine the chart;

1-Day MACD: A technical look at the MACD indicator from the 4-hour timeframe, the MACD histograms are trending above the zero line, and both the MACD line and the Signal line have crossed and are heading towards the MACD zero line, indicating a bullish trend.

MATIC

1-Day RSI: the formation of the Relative Strength Index (RSI) in the above image also suggests an upward movement as the RSI signal line is seen moving toward the 50% level. This indicates that buyers are gradually becoming active in the market therefore overpowering the strength of sellers.

4-hour Alligator: A look at the alligator indicator from the 4-hour time frame shows that the crypto asset is trading above the alligator lines as the alligator lip and teeth have both successfully crossed above the alligator jaw, suggesting that the price might continue to move in an upward direction.

MATIC

Potential Price Movement

From the previous downward movement, the price of MATIC has managed to create one major resistance level of $0.7365 and one major support level of $0.6324. Currently, MATIC is moving toward this resistance level and if it breaks above this level, it might go even further to test the next resistance level of $0.7680. 

However, if it fails to break above this major resistance, it will reverse and start a downward movement toward its previous support. Also, if it manages to break below this support level, the price might move further downward thereby continuing on its downtrend. As of the time of writing the price of MATIC was trading around $0.7253 and about -0.94% down in the last 24 hour

MATIC

MATIC Price Prediction: Can Polygon Rip Higher To $1.15

MATIC price is up over 5% and it tested the $0.950 resistance. Polygon bulls are in full control, and they might aim for more upsides above $1.00.

  • MATIC price started a fresh increase above the $0.920 resistance against the US dollar.
  • The price is trading above $0.925 and the 100 simple moving average (4 hours).
  • There was a break above a key bearish trend line with resistance at $0.9150 on the 4-hour chart of the MATIC/USD pair (data source from Kraken).
  • The pair could continue to move up if it clears the $0.9720 resistance.

Polygon Price Starts Fresh Increase

After forming a base above the $0.8620 level, Polygon’s price started a fresh increase. MATIC cleared many hurdles near $0.880 and $0.8950 to move into a positive zone, like Bitcoin and Ethereum.

There was also a move above the $0.90 resistance and the 100 simple moving average (4 hours). The bulls pushed the price above the 23.6% Fib retracement level of the downward move from the $1.0854 swing high to the $0.8612 low.

Besides, there was a break above a key bearish trend line with resistance at $0.9150 on the 4-hour chart of the MATIC/USD pair. MATIC is trading above $0.9250 and the 100 simple moving average (4 hours).

Immediate resistance is near the $0.960 zone. The first major resistance is near the $0.9720 level or the 50% Fib retracement level of the downward move from the $1.0854 swing high to the $0.8612 low. If there is an upside break above the $0.9720 resistance level, the price could continue to rise.

MATIC Price Prediction

Source: MATICUSD on TradingView.com

The next major resistance is near $1.00. A clear move above the $1.00 resistance could start a steady increase. In the stated case, the price could even attempt a move toward the $1.100 level or $1.150.

Are Dips Limited in MATIC?

If MATIC’s price fails to rise above the $0.9720 resistance level, it could start a downside correction. Immediate support on the downside is near the $0.915 level and the same trend line.

The main support is near the $0.880 level. A downside break below the $0.880 level could open the doors for a fresh decline toward $0.8620. The next major support is near the $0.8250 level.

Technical Indicators

4 hours MACD – The MACD for MATIC/USD is gaining momentum in the bullish zone.

4 hours RSI (Relative Strength Index) – The RSI for MATIC/USD is now above the 50 level.

Major Support Levels – $0.9150 and $0.880.

Major Resistance Levels – $0.9720, $1.00, and $1.15.

Polygon (MATIC) In Buy Zone That Earlier Led To 112% & 87% Surges

On-chain data shows Polygon (MATIC) is currently inside the same buy zone that earlier led to rallies of around 112% and 87% for the asset.

Polygon 30-Day MVRV Ratio Is Significantly Negative Currently

As pointed out by analyst Ali in a post on X, MATIC is showing a historically bullish pattern in its 30-day MVRV ratio. The “Market Value to Realized Value (MVRV) ratio” here refers to an on-chain indicator that keeps track of the ratio between the Polygon market cap and realized cap.

The realized cap is a capitalization model that calculates the total valuation of the cryptocurrency by assuming that the “real” value of any coin in circulation isn’t the current MATIC spot price, but rather the price at which it was last transferred on the blockchain.

Considering that the last movement of any coin was the last time it changed hands, the price at its time would serve as its current cost basis. As such, the realized cap essentially sums up the cost basis of every coin in circulation.

Put another way, the realized cap is a measure of the total amount of capital the investors have put into the asset. Since the MVRV ratio compares the value the holders are carrying right now (that is, the market cap) against this initial investment, its value can tell us about the profit-loss status of the market as a whole.

Now, here is a chart that shows the trend in the 30-day version of the Polygon MVRV ratio, which tells us about the profit-loss balance specifically for the investors who bought within the past month:

Polygon MVRV Ratio

In the graph, the 30-day MVRV ratio has been displayed in terms of a percentage, with the 0% mark aligning with the scenario where the market cap and realized cap are equal.

It’s visible that the indicator has registered some steep drawdown for Polygon recently and has dipped deep inside the negative territory. This would imply that the investors who bought within the last 30 days have entered into notable losses.

The latest levels of the metric have been low enough to qualify for a zone that has provided profitable buying opportunities in the past. “Historically, the last two entries into this zone saw MATIC surge by 112% and 87%,” notes the analyst.

A possible explanation behind this pattern could be the fact that as these 30-day investors enter into losses, the selling pressure in the market goes down as there aren’t many profit-takers left. This naturally facilitates for bottoms to take place.

It now remains to be seen whether this past pattern would repeat for Polygon this time as well, and if it does, whether any resulting surge would be of a similar scale or not.

MATIC Price

Polygon has registered a 3% surge in the past day, with its price now floating above $0.93. Given the timing, it’s possible the MVRV ratio buy signal may already be in effect.

Polygon Price Chart

Polygon Observes Buy Signal: Analyst Suggests MATIC Rebound To This Level

An analyst has explained how a buy signal forming in the price of Polygon (MATIC) could lead to the asset rebounding towards these price targets.

Polygon Is Showing A TD Sequential Buy Signal Right Now

In a new post on X, analyst Ali has discussed about the a Tom Demark (TD) Sequential signal forming in the MATIC price chart. The TD Sequential here refers to an indicator in technical analysis that’s generally used for pinpointing probable locations of reversal in any given asset’s value.

This indicator has two phases to it, the first of which is known as the “setup.” In this phase, candles of the same polarity are counted up to nine, at the end of which the price may be assumed to have encountered a point of reversal.

Naturally, if the candles leading up to the completion of the setup had been red, the reversal would be towards the upside, while green candles would suggest a potential top for the asset.

Once the setup is done with, the second phase called the “countdown” begins. This phase works similarly to the setup, except for the fact that it lasts for thirteen candles instead of nine. After these thirteen candles of the same polarity are also in, the price may be considered to have attained another likely point of reversal.

Polygon has recently completed a TD Sequential phase of the former type. Below is the chart shared by Ali that shows the formation of this TD Sequential signal for the MATIC daily price.

Polygon (MATIC) Price Chart

As displayed in the above graph, the Polygon daily price has finished a TD Sequential setup with a downtrend recently. This would suggest that the asset may be at a potential bottom at the moment.

“If MATIC stays strong above $0.87, we could see a rebound to $0.95, or better yet, $1!” says the analyst. A potential rally to the former of these targets would suggest an increase of more than 8% from the current price, while a run to the latter level would mean growth of almost 14%.

It now remains to be seen how the Polygon price will develop from here and if the TD Sequential buy signal will end up holding or not.

MATIC Price

The past few weeks have been a bad time for Polygon investors as the cryptocurrency’s price has slid down all the way from around the $1.3 level to now the $0.87 mark, corresponding to a drawdown of over 33%.

The chart below shows what the trend in MATIC’s value has looked like over the past month.

Polygon Price Chart

Amid this downward trajectory, the TD Sequential buy signal may perhaps end up being at least a glimmer of hope for the Polygon holders.

Polygon (MATIC) Whale Makes Large Deposit To Binance, Bearish Sign?

On-chain data shows a Polygon whale has made a sizeable deposit to the cryptocurrency exchange Binance, a sign that may be bearish for MATIC.

Polygon Whale Has Deposited $13.7M Worth Of MATIC To Binance

According to data from the cryptocurrency transaction tracker service Whale Alert, a massive MATIC transaction has been spotted on the blockchain during the past day.

The transfer in question involved the movement of 13.1 million MATIC, worth almost $13.7 million in US Dollars, when the transaction went through on the network. Given the large scale of the transfer, it’s likely that a whale entity was responsible for it.

Whales can be influential beings on the blockchain due to their sheer scale of holdings. As such, their movements can be worth watching, as they may lead to fluctuations in the market or, at the very least, inform us about the sentiment among these humongous entities.

As for what any such transaction may imply for the market, it comes down to the intent behind it. Below are additional details regarding the latest Polygon whale transfer, which may reveal its context.

Polygon Whale Transaction

As is visible above, the sending address involved in this Polygon transaction was an unknown wallet. This means the address was unaffiliated with any known centralized platform like an exchange and, thus, was likely to be an investor’s wallet.

On the other hand, the receiving address was connected to a centralized entity: the cryptocurrency exchange Binance. Moves like this that go from unknown wallets to exchanges are known as exchange inflows.

The whale making an inflow to Binance suggests they wanted to use one of the platform’s services, which can include selling. As such, the transaction may prove to be bearish for Polygon’s price if the whale ends up selling their stack.

MATIC Is Behind Market With Only 1% Surge Today

Whereas the rest of the cryptocurrency market has been racing up in the past day, led by Bitcoin’s strong surge towards $57,000, Polygon has lagged as the asset has only been able to see an uplift of 1% in the last 24 hours.

The below chart shows how the coin has performed in the last few days.

Polygon Price Chart

However, Polygon’s returns of around 7% over the past week aren’t too far off from Bitcoin’s 9% profits in the same period. Still, the relatively poor performance in the past day may be why the whale has potentially decided to sell their large stack.

Regarding market cap, MATIC is currently the 14th largest coin in the sector, with its closest competitor, Polkadot (DOT), speeding away with its gains of more than 6%.

Polygon Market Cap

The Polygon Vesting Contract Is Officially Empty, Will This Send MATIC Price To $3?

Like many other crypto projects, the native token of the Polygon network, MATIC, was launched with some portion of the supply vested for the team over a period of time. In the case of Polygon, the vesting was for five years, and since 2019, there have been periodic token unlocks. However, the unlocks, which have often been a deterrent for investors, are now over, as the last batch was just released to the team.

Polygon Last Unlock Goes To Team

On Wednesday, February 21, the Polygon Foundation received the very last portion of their vested tokens from the vesting contract. In total, 273,304,816 million MATIC tokens valued at $260 million were released to the Foundation’s wallet.

This unlock marks the very last unlock that the Foundation will receive, meaning that almost all of the available supply of MATIC is now in circulation. The latest unclog brings the circulating supply of the cryptocurrency to 9,618,318,574 out of its 10,000,000,000 maximum supply. As a result of this, the market cap of Polygon is sitting just above $9.14 billion with a fully diluted valuation (FDV) of approximately $5 billion.

The entirety of the MATIC supply has been unlocked, which means that there will be no more tokens being brought into circulation. This is a huge milestone for the project, whose investors have waited years for the vested tokens to finally run out.

MATIC price chart from Tradingview.com (Polygon)

How Will This Affect The MATIC Price?

The fact that the entirety of the MATIC supply is now in circulation is bullish for the digital asset, especially in the long term. Inflation is a factor that tends to drive investors away and keep them from holding their coins due to the fear of more tokens coming into circulation, causing supply to exceed demand.

Now that the entirety of the supply is now in circulation, it gives the MATIC price a chance to enter into price discovery. However, there is still some concern about when the Polygon Foundation might start selling their coins as the entirety of the unlocked tokens still sit in the Foundation’s wallet.

If they do decide to sell, though, it is likely that the foundation would do so through OTC (over-the-counter) deals to minimize the impact of such a sale on the token price. As a result, the MATIC price might not suffer much.

At the time of writing, the MATIC token is trading at $0.95 with a 24-hour increase of 1.11%. Although its performance has been far from encouraging, the token is sitting only 67% below its 2021 all-time high of $2.92.

Polygon Could See Bull Rally To $1.73 If This Happens: Analyst

An analyst explained that Polygon could see a potential bull rally to $1.73 if the cryptocurrency’s price is above this level.

Polygon Appears To Be Breaking Out Of A Symmetrical Triangle Currently

In a new post on X, analyst Ali talked about a multi-year Symmetrical Triangle that Polygon has been traveling inside. The “Symmetrical Triangle” is a pattern in technical analysis (TA) that, as its name already implies, looks like a triangle.

The pattern comprises two converging trendlines, with the upper line being made by joining lower highs in the price, while the lower level connects higher lows.

A feature of this pattern is that these two lines approach each other at roughly an equal (but opposite) slope. This is the reason why there is “symmetrical” in its name.

When the price trades inside the triangle, it tends to encounter resistance at the upper level. As such, tops can probably form at the line. Similarly, the lower line can act as a source of support, thus facilitating likely bottoms to take place.

If the asset breaks through either of these barriers, its price could probably see a sustained push in that direction. This means that breaks above the triangle can be bullish signals, while drops under it can signify that a bearish trajectory has taken over.

There are also other triangle patterns in TA, with two popular ones being the Ascending and Descending Triangles. These two patterns differ from the Symmetrical Triangle in that one of their trendlines is parallel to the time axis (meaning their lines can never have an equal slope).

Now, here is the chart shared by Ali that shows a Symmetrical Triangle pattern that the weekly price of Polygon has traded inside for the last couple of years:

Polygon Symmetrical Triangle

As the graph shows, the Polygon weekly price has shown signs of a breakout from this Symmetrical Triangle pattern that it has been stuck inside for multiple years.

Since such breakouts have historically been bullish, this surge for MATIC could mean some sustained bullish momentum may be coming. This is only, of course, if the break truly gets confirmed.

“If MATIC can maintain a close above $0.96, it could signal the start of a bull rally, with a potential target of $1.73!” explains the analyst. From the current asset price, a run to this target would mean an increase of more than 78% for the cryptocurrency.

MATIC Price

After witnessing a break above the $1 mark, Polygon slipped yesterday as its price declined to $0.90. However, the coin has recovered above $0.97 in the past day.

This is above the $0.96 target set by the analyst, so if Polygon can continue to maintain above it now, the break might get confirmed for the asset.

Polygon Price Chart

MATIC Price Prediction: Polygon Rallies To $1 and Bulls Are Not Done Yet

MATIC price is up over 10% and it tested the $1.00 resistance. Polygon bulls are in full control, and they might aim for more upsides above $1.00.

  • MATIC price started a fresh increase above the $0.850 resistance against the US dollar.
  • The price is trading above $0.95 and the 100 simple moving average (4 hours).
  • There is a key bullish trend line forming with support at $0.958 on the 4-hour chart of the MATIC/USD pair (data source from Kraken).
  • The pair could continue to move up if it clears the $1.00 resistance.

Polygon Price Starts Fresh Surge

After forming a base above the $0.80 level, Polygon’s price started a fresh increase. MATIC cleared many hurdles near $0.880 and $0.900 to move into a positive zone, like Bitcoin and Ethereum.

There was also a move above the $0.92 resistance and the 100 simple moving average (4 hours). Finally, it tested the $1.00 resistance. A multi-week high is formed near $1.000 and the price is now consolidating gains above the 23.6% Fib retracement level of the upward move from the $0.8185 swing low to the $1.00 high.

MATIC is trading above $0.950 and the 100 simple moving average (4 hours). There is also a key bullish trend line forming with support at $0.958 on the 4-hour chart of the MATIC/USD pair.

Immediate resistance is near the $0.995 zone. The first major resistance is near the $1.00 level. If there is an upside break above the $1.00 resistance level, the price could continue to rise.

MATIC Price Prediction

Source: MATICUSD on TradingView.com

The next major resistance is near $1.08. A clear move above the $1.08 resistance could start a steady increase. In the stated case, the price could even attempt a move toward the $1.120 level or $1.150.

Are Dips Limited in MATIC?

If MATIC’s price fails to rise above the $1.00 resistance level, it could start a downside correction. Immediate support on the downside is near the $0.955 level and the trend line.

The main support is near the $0.900 level or the 50% Fib retracement level of the upward move from the $0.8185 swing low to the $1.00 high. A downside break below the $0.900 level could open the doors for a fresh decline toward $0.850. The next major support is near the $0.800 level.

Technical Indicators

4 hours MACD – The MACD for MATIC/USD is gaining momentum in the bullish zone.

4 hours RSI (Relative Strength Index) – The RSI for MATIC/USD is now above the 50 level.

Major Support Levels – $0.955 and $0.900.

Major Resistance Levels – $1.00, $1.08, and $1.12.

Report Shows Polygon Users Rivaled Ethereum In 2023, But Why Has Price Failed To Clear $1?

Layer-2 network Polygon is reported to have competed with Ethereum in 2023, as both networks saw the most influx of new users. This development has once again raised concerns about MATIC’s price, considering that such an achievement should potentially mean that new money moved into the ecosystem last year. 

Polygon and Ethereum Acquired The Most Users In 2023

According to a report by Blockchain analytics firm Flipside, Polygon and Ethereum led the pack with 30.6 million acquired users in 2023. Giving a further breakdown, Polygon is said to have acquired 15,24 million users, while Ethereum attracted 15.4 million users. Meanwhile, these users are defined as persons who performed at least two transactions on the networks. 

Despite falling about 160,000 short of Ethereum’s numbers, Polygon’s numbers are still impressive, considering that it ranked ahead of other networks like Bitcoin and Solana. The layer-2 network also outperformed other Ethereum L2 networks like Arbitrum, Optimism, and Base, which recorded 7.3 million, 3.3 million, and 1.9 million acquired users, respectively. 

Notably, Polygon hit the ground running as soon as 2023 began, setting the record for monthly acquired users with 2 million in January. Interestingly, January 2023 was the first time MATIC rose above $1 in a very long while. It held above that level until the end of April 2023. After that, MATIC traded below that level for most of the year, only rising above $1 towards the end of December 2023. 

MATIC price chart from Tradingview.com (Polygon)

Why Has MATIC Failed To Rise And Hold Above $1

A recent analysis by Blockchain intelligence firm ChainArgos suggested that the Polygon team has been secretly selling off MATIC tokens, something which could have accounted for the significant sell pressures that have risen at different times for the crypto token. This could also serve as a plausible explanation for why MATIC has struggled to hold above $1 despite enjoying great utility. 

The Polygon team was accused of not executing its token allocations in line with the publicly stated plan, with part of the allocated funds accounting for some of the tokens that were sold. These secret sales, which have for long gone under the radar, are said to be circumvented through wallets linked to the crypto exchange Binance

So far, about 767 million MATIC have apparently been offloaded in these secret transactions. ChainArgos hinted at how these transactions have no doubt affected MATIC’s price on different occasions, as they noted that the outflows are a “good indicator for an upcoming top and subsequent move lower.”

At the time of writing, MATIC is trading at around $0.73, up in the last 24 hours, according to data from CoinMarketCap. 

How To Buy, Sell, And Trade Tokens on The Polygon Network

Polygon (formerly Matic Network) is a game-changing Layer 2 scaling solution that addresses Ethereum’s scalability challenges. It empowers developers to create and deploy scalable, interoperable decentralized applications (dApps) by utilizing sidechains, plasma chains, and innovative scaling techniques. 

If you’re unfamiliar, sidechains are unique blockchains that are bound to the main Ethereum blockchain and are effective in supporting many Decentralized Finance (DeFi) protocols available on the Ethereum network. This enables rapid transaction speed and cost-effectiveness while maintaining the security and decentralization of the Ethereum network.

As a Layer 2 solution, Polygon operates in parallel to the Ethereum blockchain. Rather than individually validating each transaction, batches of transactions are sent to the Ethereum blockchain, significantly accelerating the validation process and reducing fees.

Polygon implements a proof-of-stake consensus mechanism wherein users can stake tokens for a predetermined duration to validate transactions. In return for their staking activities, participants are rewarded with MATIC tokens.

To ensure robust security, Polygon implements the advanced technique of “commit-chain” or “checkpointing.” It securely anchors the state of Polygon chains onto the Ethereum mainnet at regular intervals, enhancing data integrity and leveraging Ethereum’s inherent security. By capitalizing on Ethereum’s proven security measures, Polygon provides users with a reliable and resilient platform for their transactions and dApps.

The Polygon Network offers a comprehensive set of features that address scalability, security, and developer-friendliness. In this article, we will delve into the key attributes of the Polygon network and assess its substantial potential within the Ethereum ecosystem.

Features Of The Polygon Network

Cross-Chain Connectivity

Polygon network offers bridges that enable smooth transfers of assets and data across diverse blockchains. This fosters interoperability between chains, empowering users to leverage the advantages of multiple blockchain networks and access a broader array of decentralized finance (DeFi) protocols and applications. 

Polygon presents a Layer 2 scaling solution for Ethereum by leveraging sidechains to address scalability challenges. This solution facilitates quicker and more economical transactions, alleviating congestion and mitigating high fees on the Ethereum network

Ethereum Compatibility

Polygon seamlessly integrates with the Ethereum Virtual Machine (EVM), enabling developers to effortlessly migrate their existing Ethereum decentralized applications (dApps) to the Polygon network. This compatibility guarantees a seamless transition and adoption of Polygon while leveraging the extensive Ethereum ecosystem and developer tools.

Commit-Chain Checkpointing 

Polygon employs commit-chain checkpointing, securing the state of its chains by anchoring them onto the Ethereum mainnet. This approach guarantees the integrity of data, harnesses Ethereum’s robust security measures, and safeguards against any unauthorized alterations or tampering of the sidechain data.

Ethereum Network Security 

Leveraging Ethereum as its anchor chain, Polygon leverages the inherent security and decentralization of the Ethereum network. This integration fortifies the overall security of the Polygon ecosystem, ensuring users have access to a reliable and resilient platform for transactions and decentralized applications (dApps).

Developer-Centric Environment

Polygon provides an array of developer tools and infrastructure that empower developers to create and deploy decentralized applications (dApps) seamlessly. The Polygon Software Development Kit (SDK) offers a streamlined framework for building scalable applications on the network, simplifying the development process. 

Polygon also prioritizes the needs of developers by offering extensive documentation, guides, and resources. This ensures that developers have access to the necessary information and support to comprehend and harness the platform effectively. The availability of comprehensive resources fosters a vibrant developer community, encouraging collaboration and driving innovation on the network.

MATIC Token Utility And Exchange Availability

Polygon’s rebranding decision resulted in the retention of MATIC as its token ticker symbol. MATIC, an ERC-20 token, ensures compatibility with numerous Ethereum projects. Within the Polygon network, users rely on MATIC to secure and govern the network and cover transaction fees.

The MATIC token serves multiple purposes within Polygon’s ecosystem. Users can utilize MATIC for fee payments during transactions on the Polygon platform. MATIC can also be staked to contribute to the network’s security and earn rewards. 

Furthermore, MATIC holders have the ability to engage in governance activities by voting on proposed modifications, influencing the evolution of the network.

In terms of exchange availability, MATIC can be traded on various platforms, including prominent exchanges like UniSwap. This wide accessibility on exchanges enhances liquidity and provides individuals with convenient access to acquire or trade MATIC tokens.

How To Get Started On The Polygon (MATIC) Network

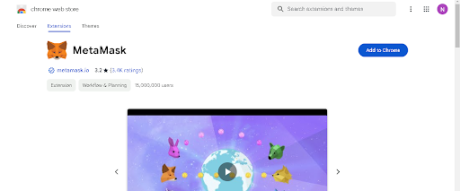
To engage in token transactions on the Polygon network, users must acquire a MetaMask wallet. MetaMask, a widely used browser extension wallet, provides a seamless interface for interacting with blockchain networks, including Ethereum. This user-friendly wallet is accessible as a browser extension for popular browsers like Google Chrome.

To ensure your MetaMask Wallet is added to your browser as an extension, click on the ‘Add to Chrome’ icon located at the top right corner, as depicted below:

Metamask

After installation and setup, MetaMask enables users to effectively manage their cryptocurrency wallets, seamlessly interact with decentralized applications (DApps), and securely execute transactions on supported blockchain networks, all directly from within their web browsers. 

Remember to diligently write down your seed phrase on a physical sheet of paper and store it in a secure location. Avoid storing it online or on any electronic device to ensure maximum security.

For the next step, add the Polygon (MATIC) network to your Metamask wallet by following the instructions provided on the Metamask website here.

Trading On The Polygon (MATIC) Network

In order to execute trades on the Polygon (MATIC) network, you will need to fund your wallet with MATIC so as to enable you to cover gas fees. These fees cover the expense associated with utilizing computational resources related to transaction processing and validation.

To purchase MATIC tokens, you can utilize centralized exchanges like Binance. Simply copy your wallet address from MetaMask and proceed to transfer MATIC tokens from your Binance account to your MetaMask wallet. 

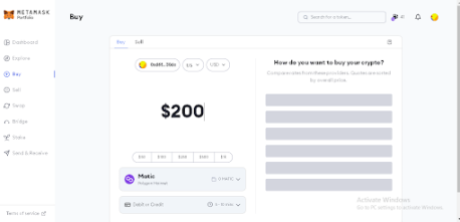
In addition, it is possible to acquire MATIC directly within the MetaMask wallet by utilizing conventional payment methods such as credit or debit cards and other similar options.  

Simply click on the “Buy/Sell” button within the MetaMask interface to access the designated section. Within this interface, you can specify the desired amount of MATIC (or any other token) you wish to purchase in terms of US dollars. Additionally, you can select your preferred payment method before finalizing the transaction by clicking on the “Buy” button. 

It’s imperative for users to be aware that when purchasing cryptocurrencies directly within MetaMask, you will be required to provide information such as your country and state. However, rest assured that this process is simple and can be completed within a minute.

Buy MATIC Metamask

You can expect your MATIC tokens to arrive in your wallet within a few minutes at most. Once they have arrived, you are ready to start trading tokens on the Polygon network. To begin your trading journey, navigate to UniSwap and commence your trading activities.

How To Trade Tokens On The Polygon Network Using UniSwap

Uniswap is an Ethereum blockchain-based decentralized exchange (DEX) protocol that enables users to trade Ethereum-based tokens from their wallets directly, eliminating the necessity for intermediaries or conventional order books. Uniswap provides users with a hassle-free method to purchase and sell various tokens.

To safeguard your wallet against fraudulent activity, ensure that you are accessing the legitimate Uniswap website

Begin by clicking on the “Launch App” button located in the top right corner, as depicted in the image below:

Polygon Network

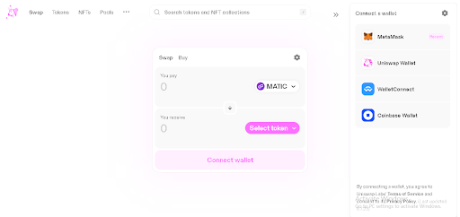
Next, proceed by selecting the “connect” option located at the top right corner of the UniSwap interface, as depicted in the provided image below:

Uniswap

Establish a connection with your preferred wallet, as shown in the image below. In this instance, the suggested wallet is Metamask:

Uniswap buy MATIC

After establishing the connection, adjust your Metamask settings to the Polygon (MATIC) network. (If you are already connected to the Polygon network, there is no need to make any network switches).

Polygon trading

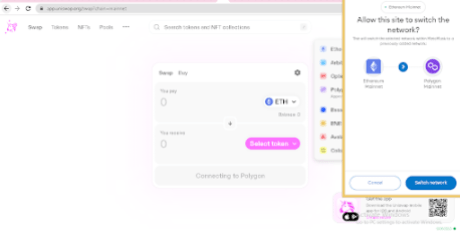
Once you have successfully connected MetaMask to the Polygon network, navigate to UniSwap to begin trading on the Polygon network through the platform.

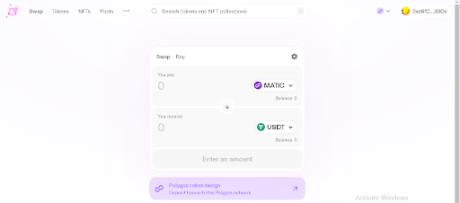
Moving forward, you need to choose your desired tokens within the UniSwap interface. As Uniswap operates on a token-to-token trading model, click on the “Select Token” button to designate the specific trading pair you wish to trade against.

To illustrate, if you intend to purchase USDT using MATIC, simply choose the MATIC – USDT trading pair, specify the desired amount, and click on “Swap” or “Trade Now.” Confirm the transaction in your Metamask wallet, and you will be able to view the tokens in your wallet’s asset list.

Trading tokens

Buying And Selling Tokens With Metamask

Metamask extension wallet, connected to the Polygon network, allows users to buy and sell tokens seamlessly. To proceed, ensure that you are connected to the Polygon network and possess MATIC tokens for swapping and covering gas fees.

Then, locate the “Swap” button, as illustrated below. Clicking on it will direct you to the Swap interface within the Metamask wallet.

Metamask Swap

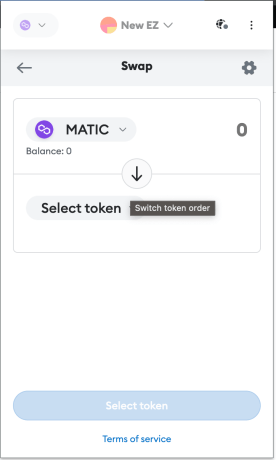
Using the image above as a guide, users can search for tokens by name or contract address, just like on UniSwap. Enter the amount of MATIC you want to swap, make sure you have the correct token, and click on “Swap”. Once the transaction is confirmed, the tokens you bought will be sent to your wallet.

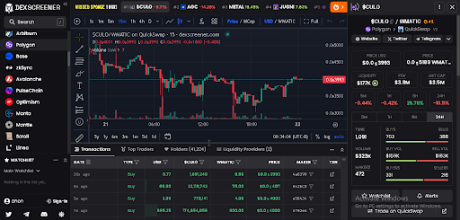
Tracking Token Prices on The Polygon  Network

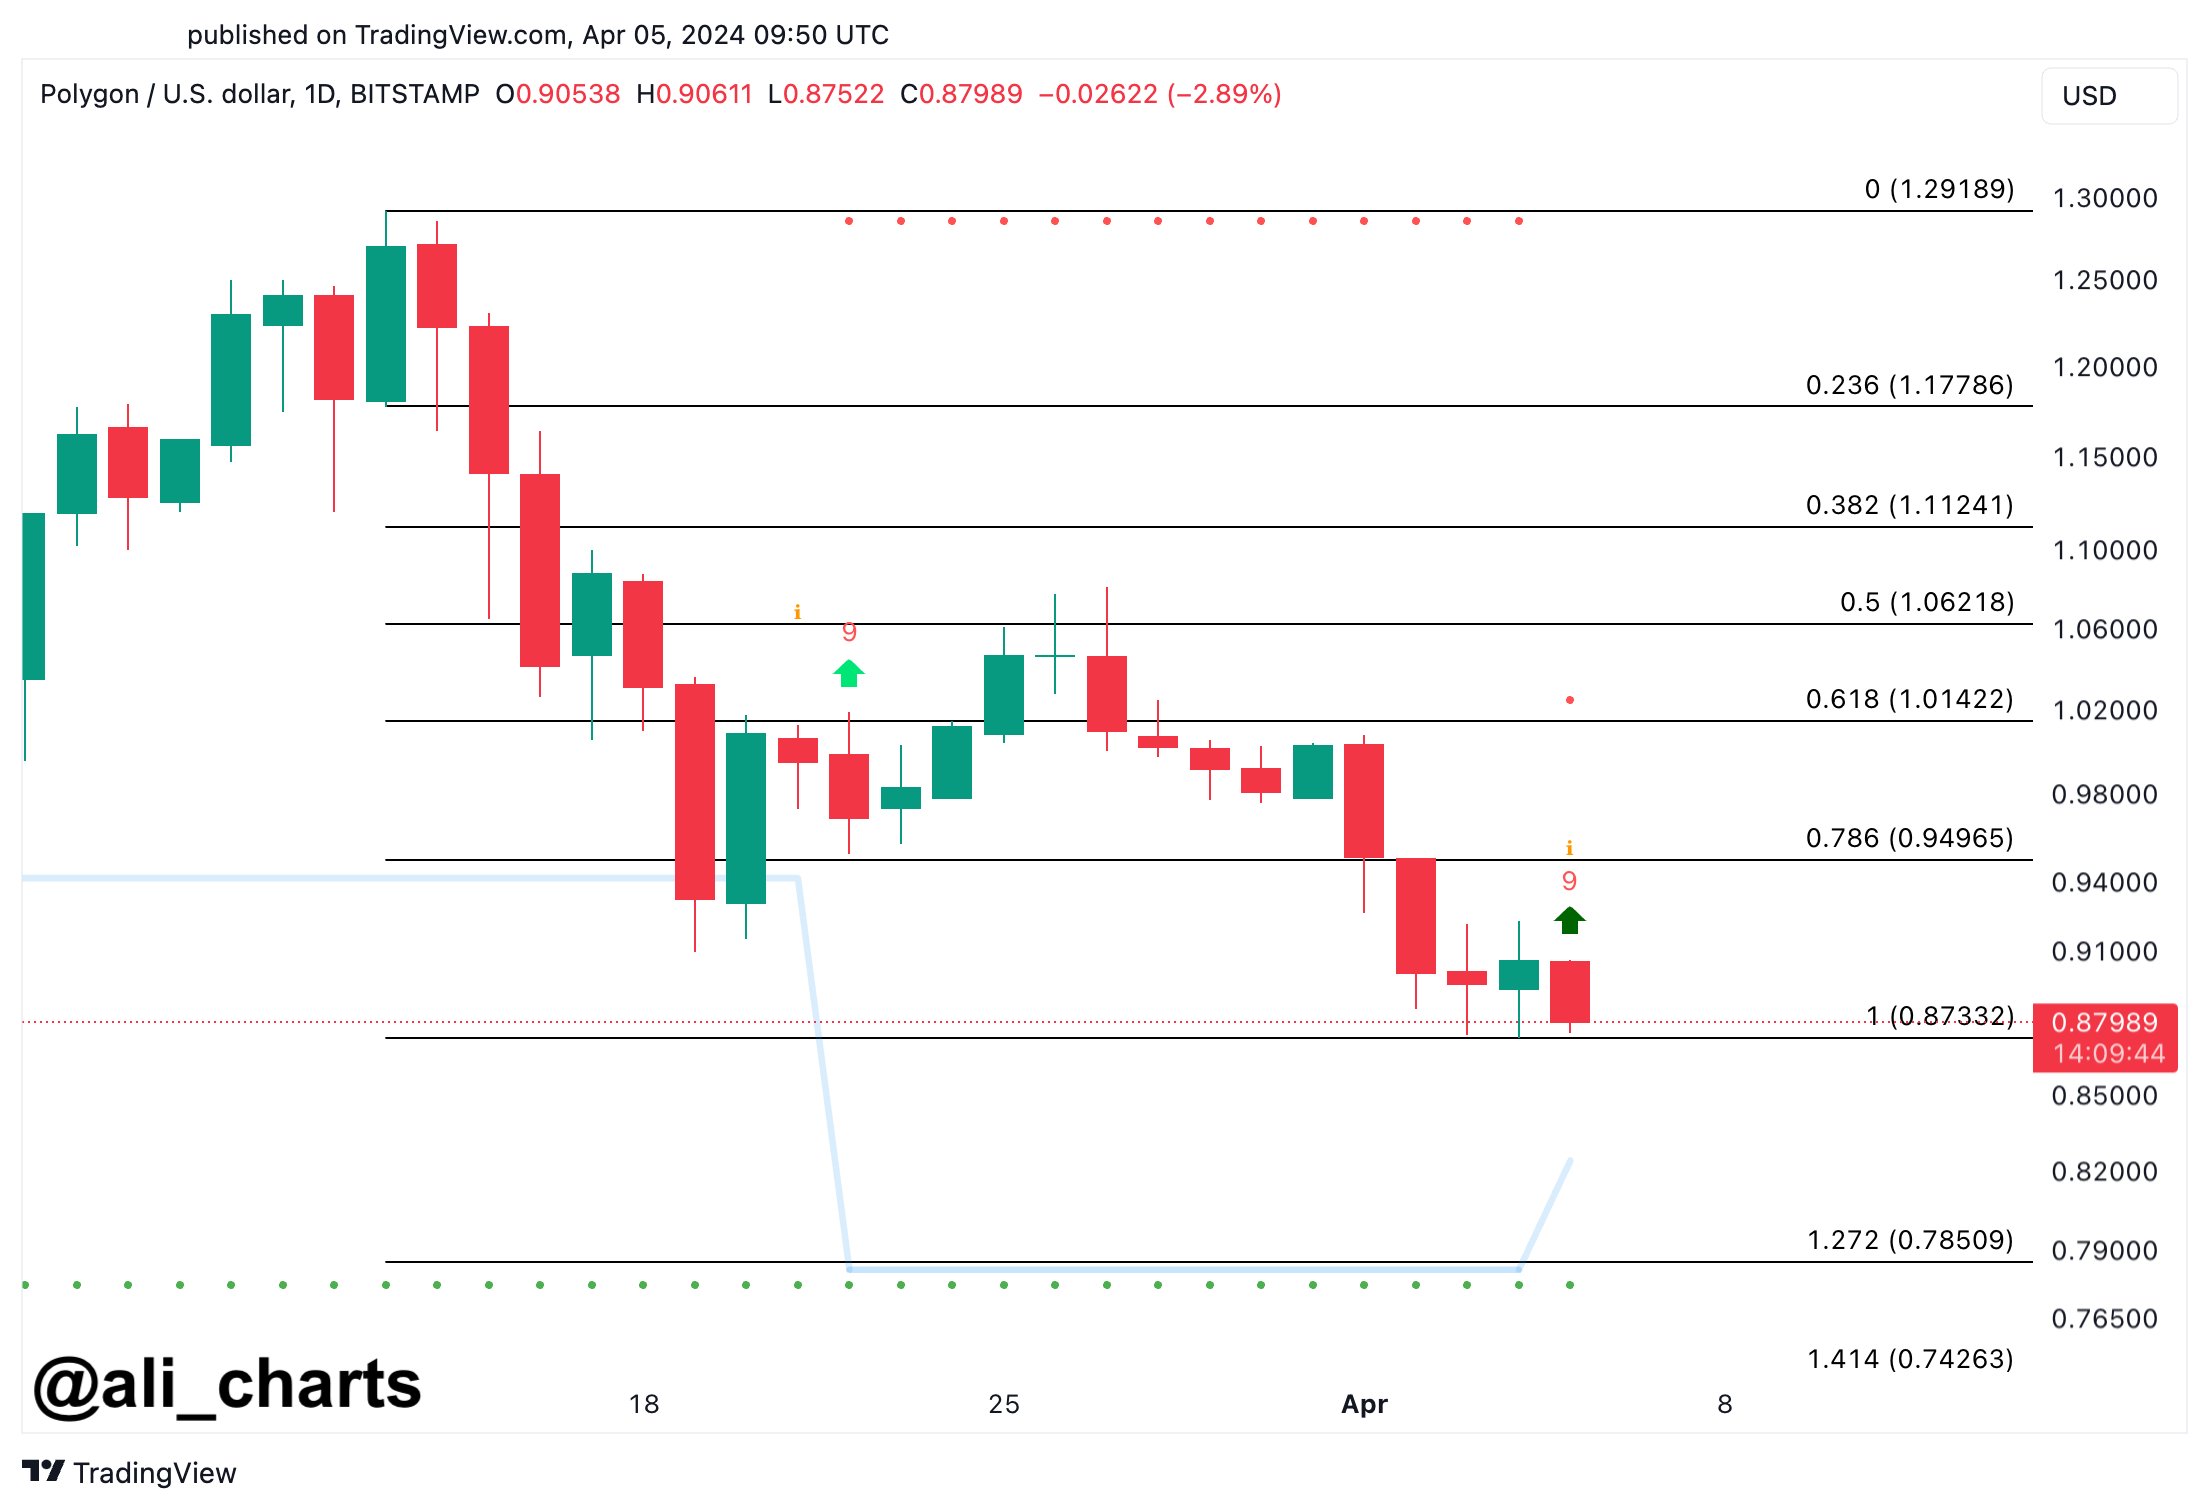
Polygon network users can equip themselves with potential on-chain tools like Dexscreener, which opens up a world of new opportunities for traders. Dexscreener provides users with extensive market insights for specific tokens, ranging from real-time price data to in-depth contract information. It also helps users make well-informed trading decisions based on reliable and up-to-date data.

Stay ahead of the curve on the Polygon network with Dexscreener, keeping track of token metrics and market dynamics. 

Polygon Dexscreener

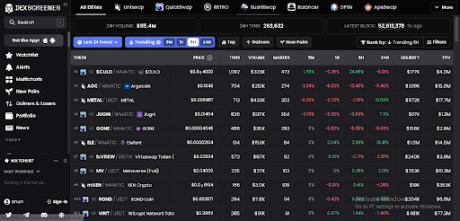
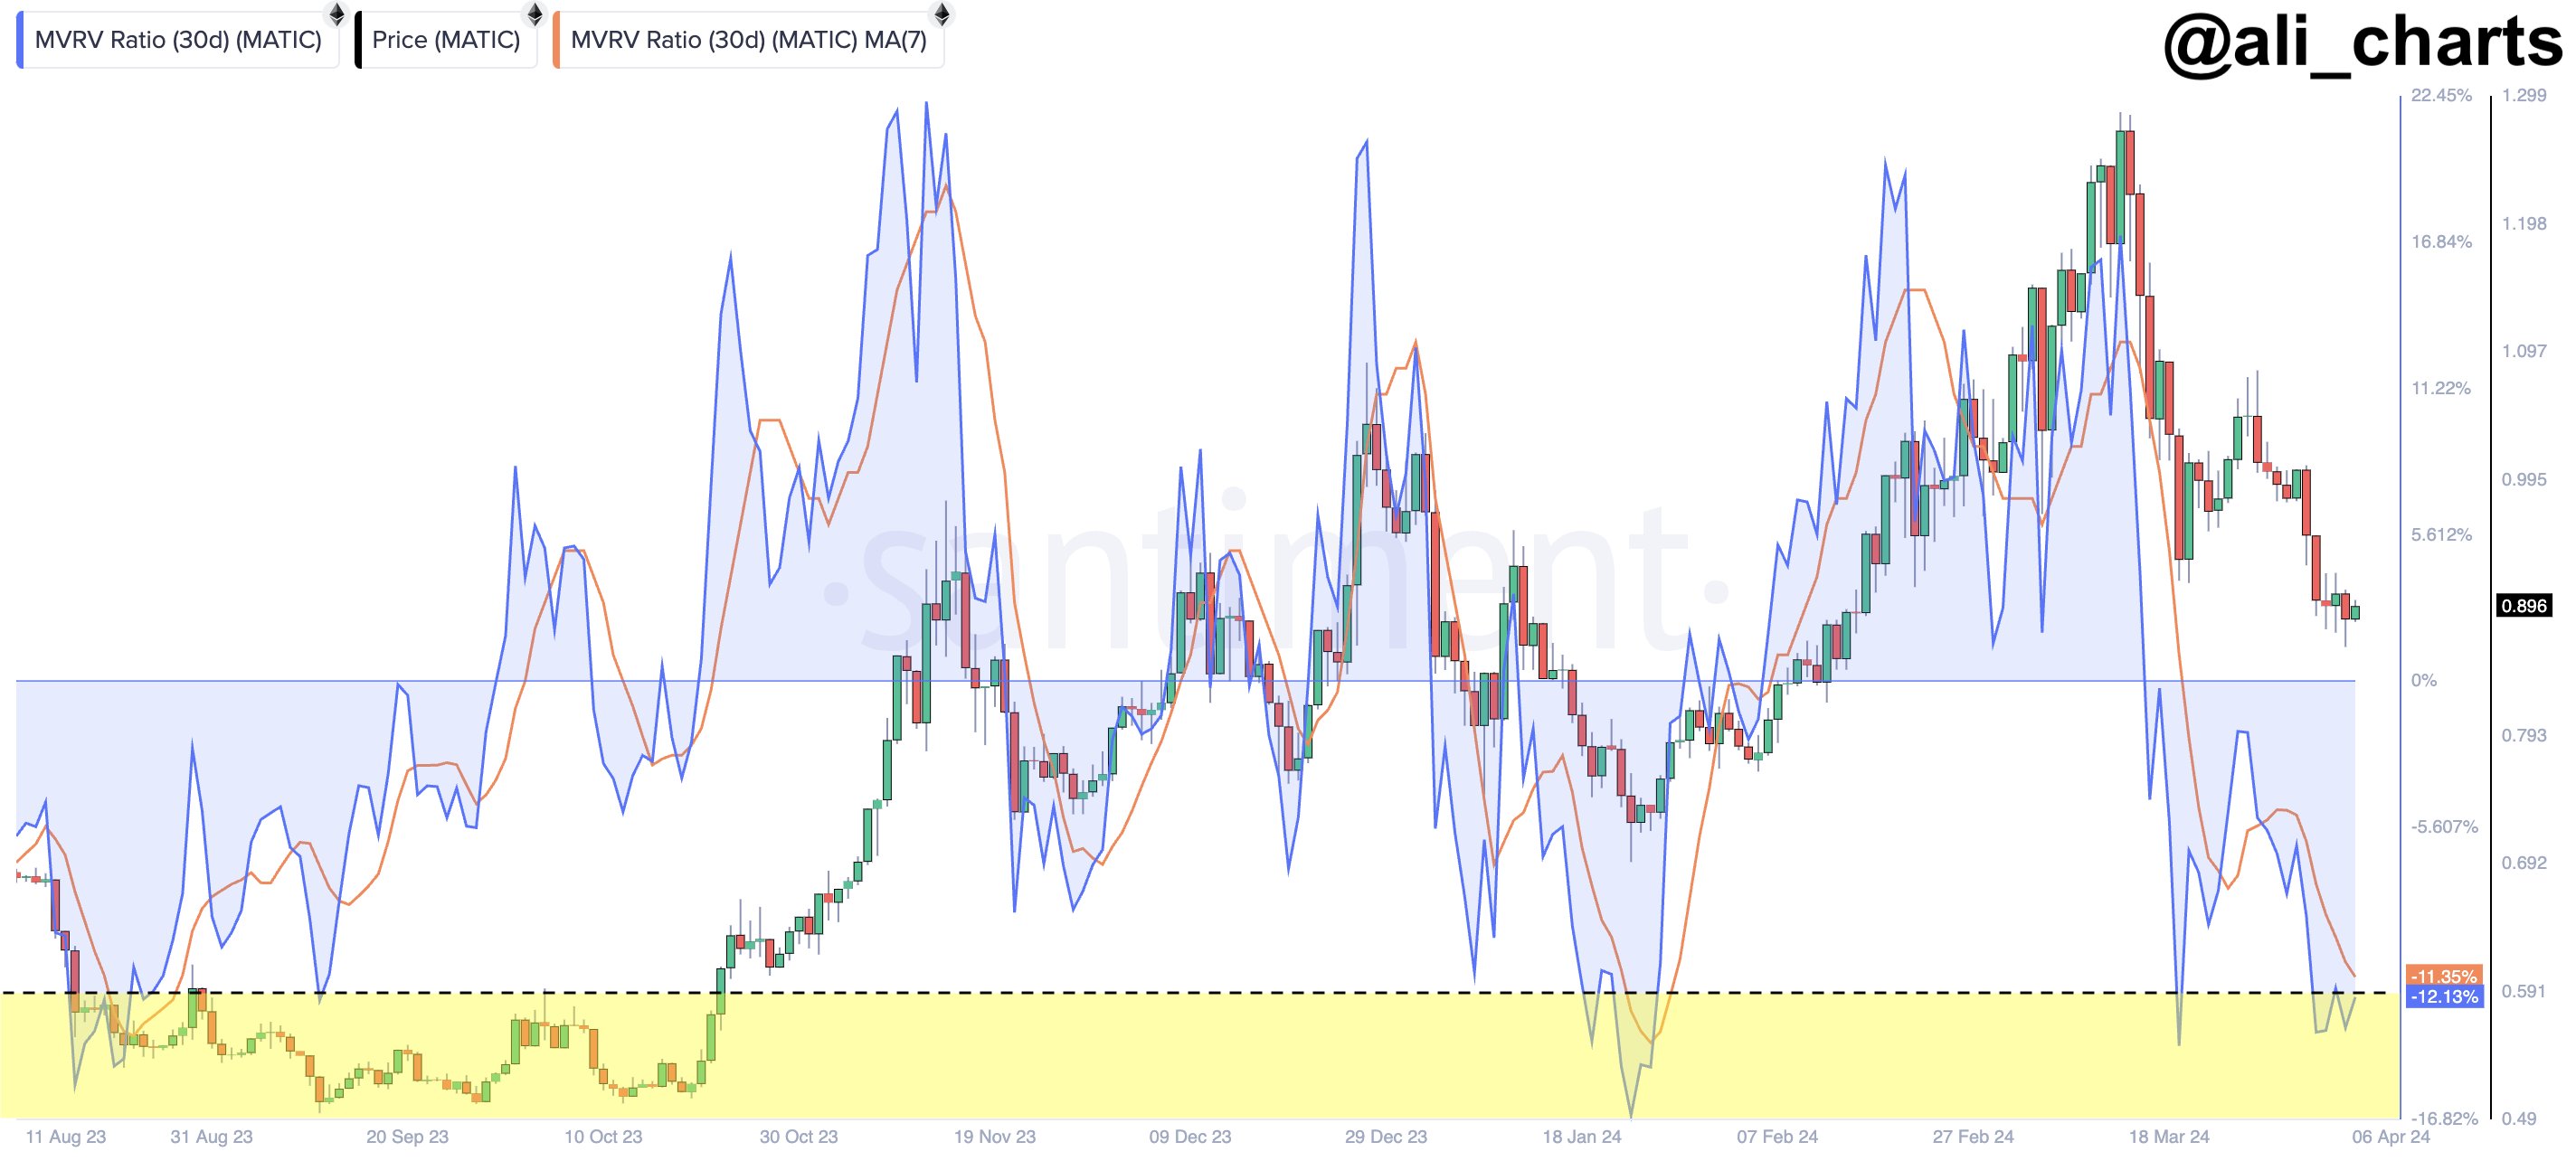
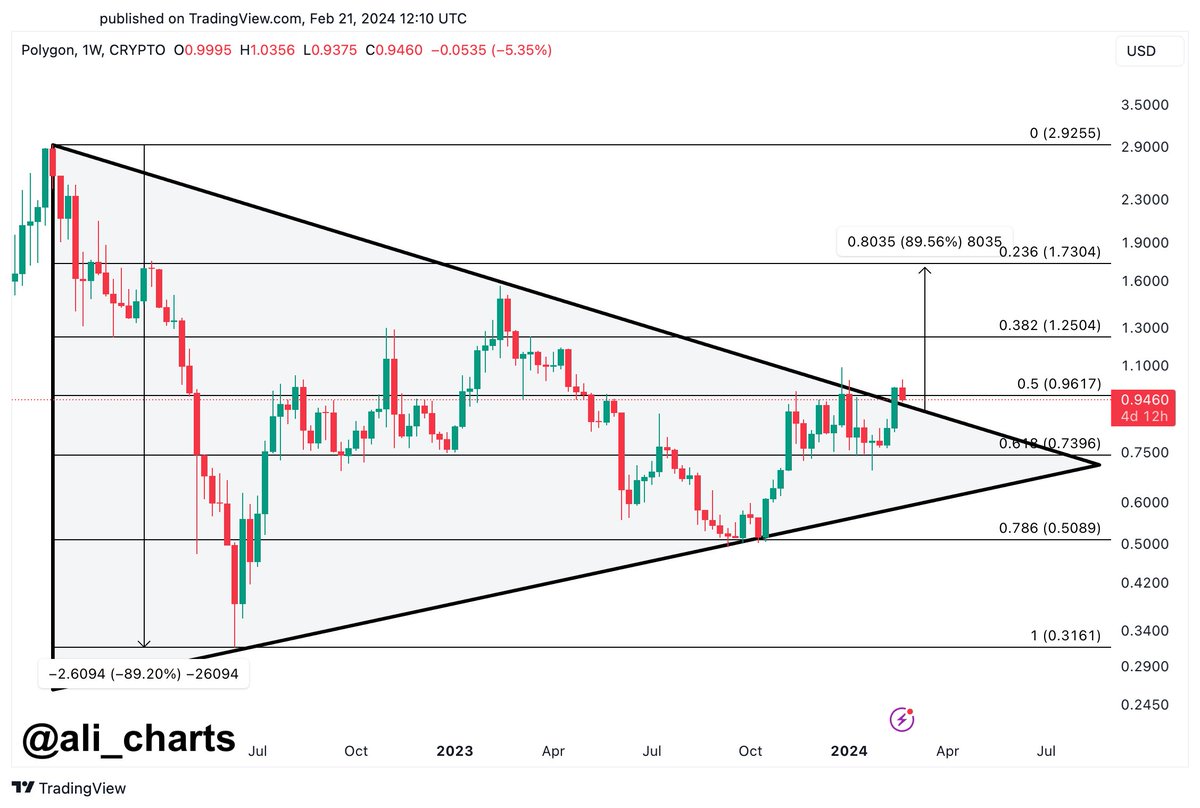
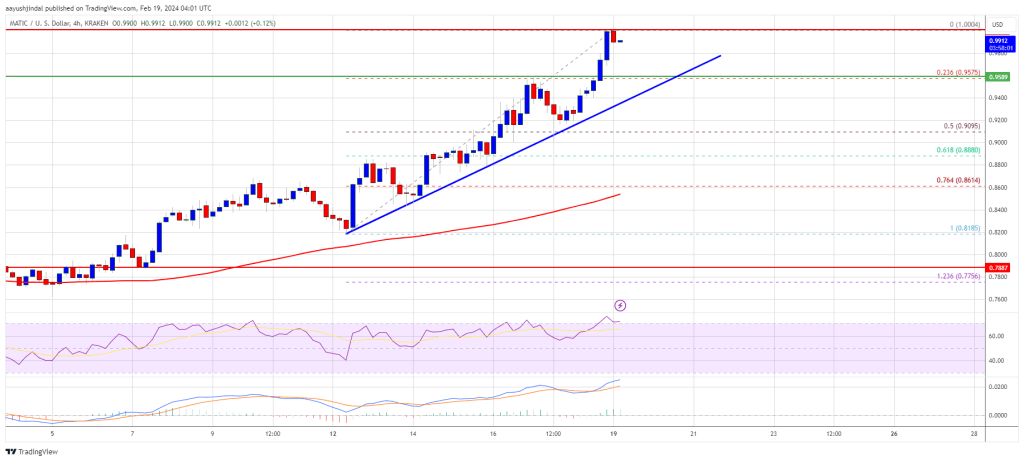
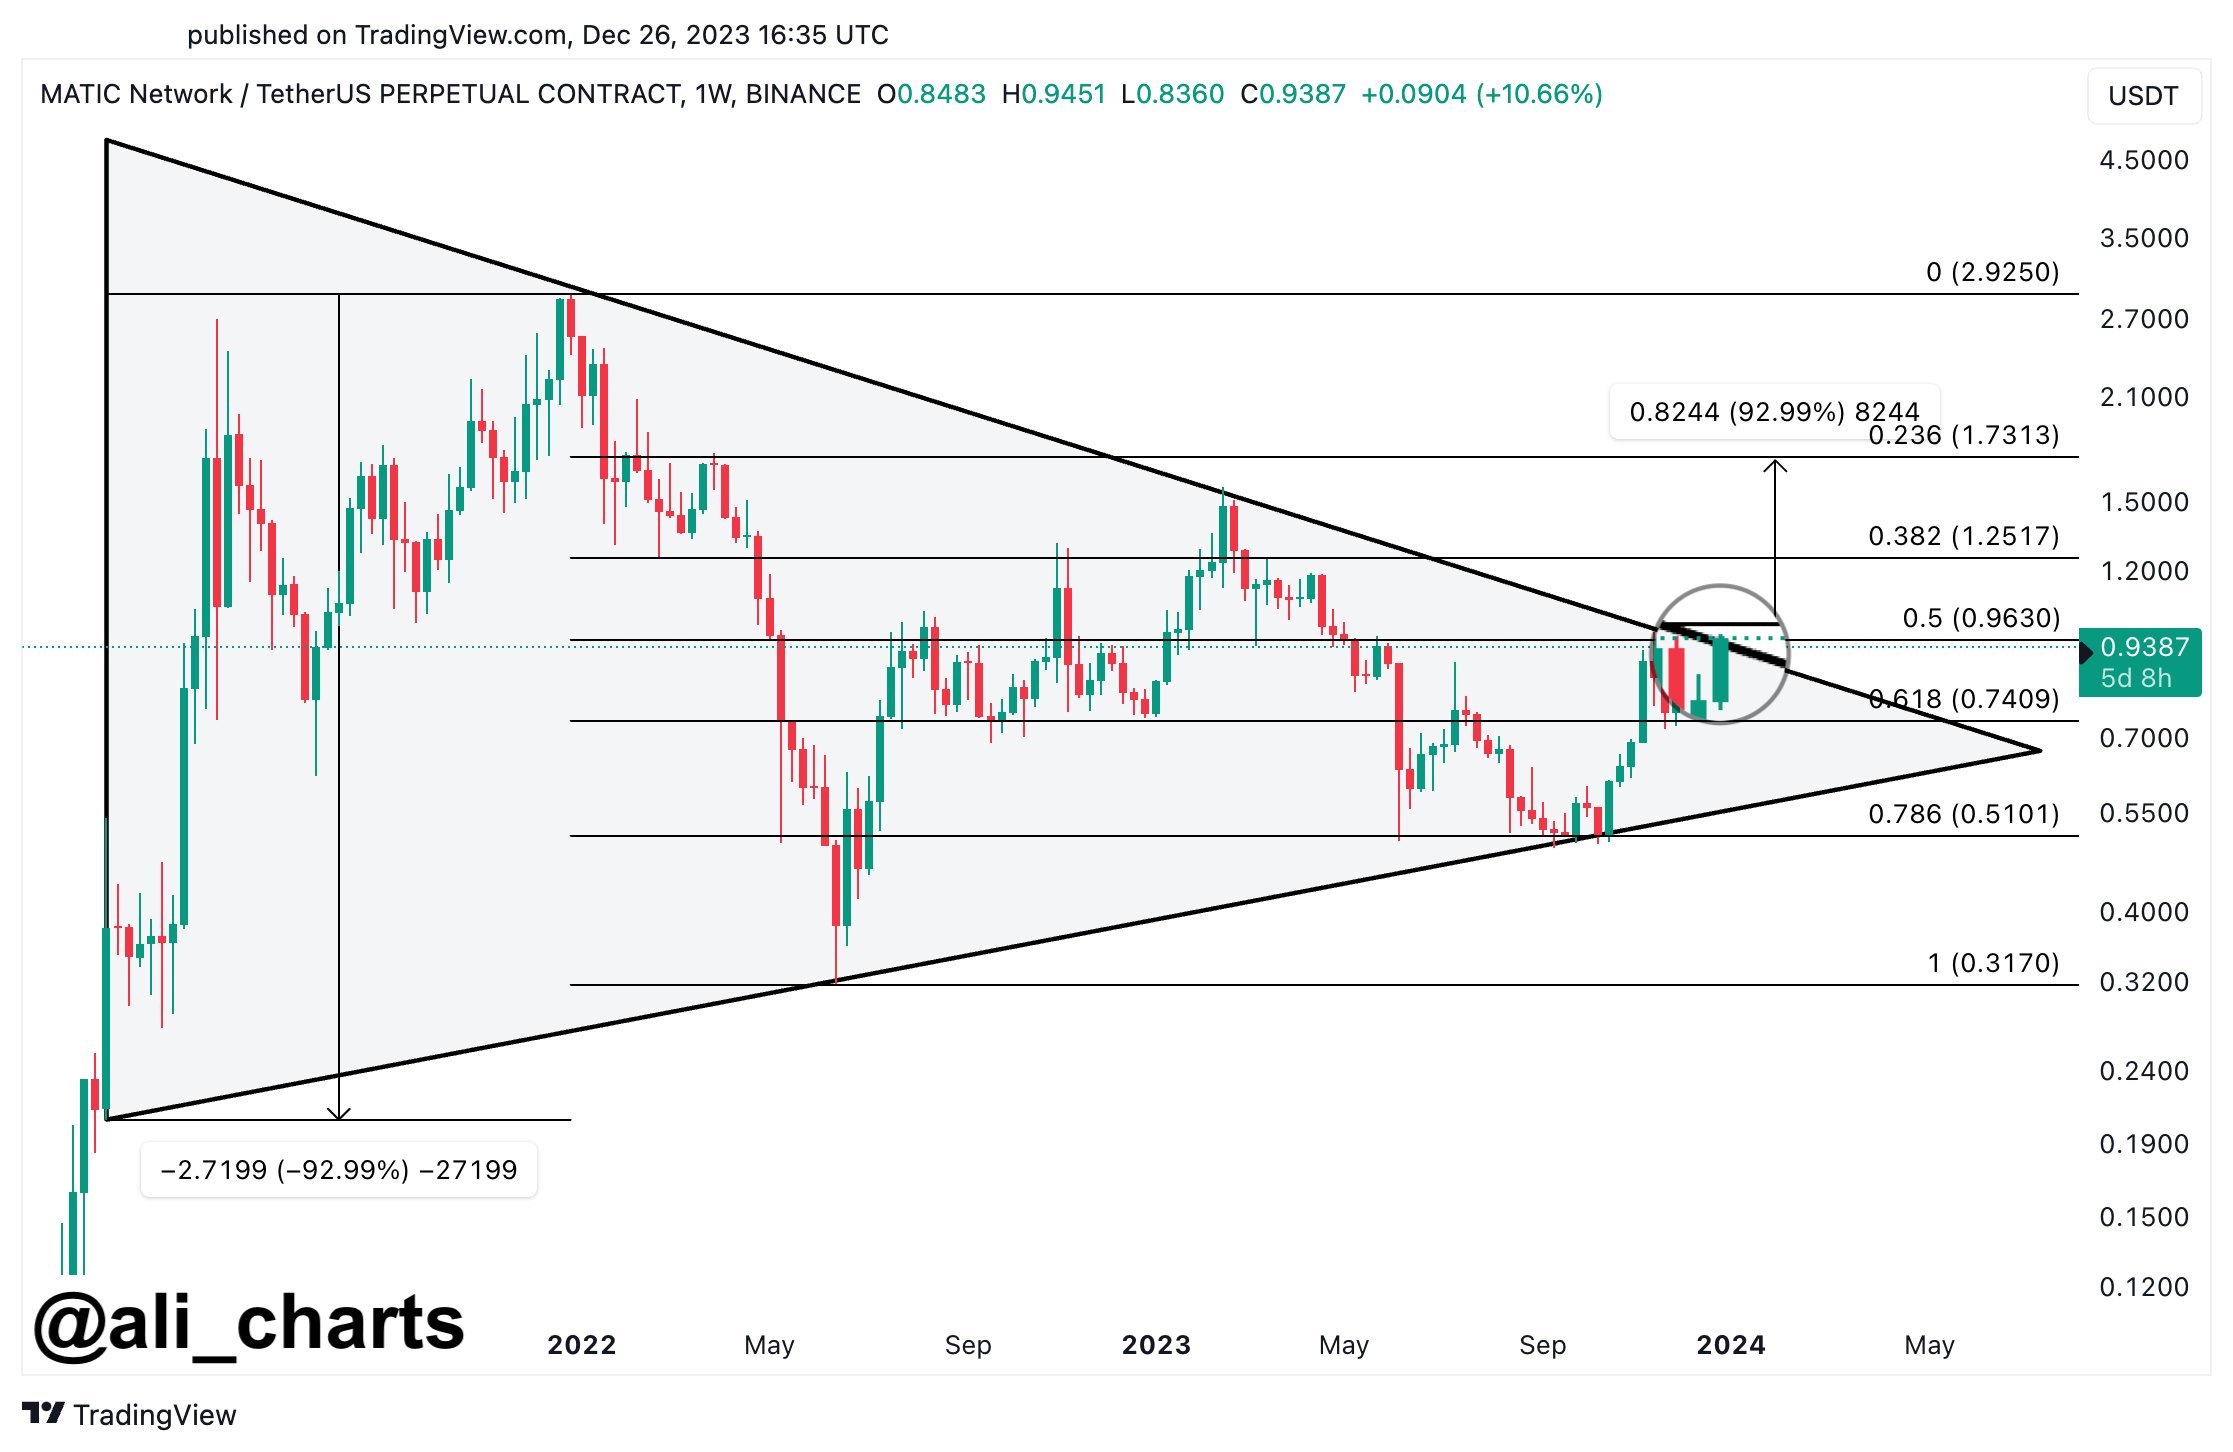
Dexscreener on the Polygon network offers invaluable features tailored to users. One standout feature is its charting functionality, which provides real-time and historical price data for various tokens.

By utilizing these charts, users can gain valuable insights into price trends, trading volumes, and other important metrics.

Check below for a visual representation:

Dexscreener charts

Conclusion

The Polygon network provides a robust and user-friendly environment for traders to thrive. With its innovative features, growing ecosystem, and commitment to scalability, Polygon is poised to play a pivotal role in shaping the future of decentralized finance.

As Polygon continues to experience growth and wider adoption, we anticipate a broader selection of applications and services tailored to meet the diverse requirements of traders. The network’s dedication to scalability, interoperability, and user satisfaction establishes it as a frontrunner in the ever-evolving blockchain industry.

MATIC Blasts Off: 20% Surge As Polygon Trading Volume Hits Records

The global cryptocurrency market value has retraced to over $1.72 trillion, suggesting that the cryptocurrency industry has lost some of its momentum in the last day. Furthermore, MATIC has not seen any tiny losses, in contrast to the majority of prominent digital assets, such as Bitcoin.

As the Polygon protocol’s supporters push for new yearly highs, MATIC is experiencing a seismic change within its ecosystem, which has caused its price to soar by more than 20% in early trading on Thursday.

MATIC Breaches $1 Barrier

Based on the several milestones in its ecosystem, Polygon has been indicating that it is prepared to overcome the critical $0.9 pricing threshold.

Following an initial upward trend, MATIC made an unsuccessful attempt to break out in February 2023. Before the price broke out this week, there were two more failed breakout efforts in November and December.

The $1.07 peak on Wednesday is the highest since April. It is noteworthy that MATIC has failed to close each week above the resistance trend line.

Furthermore, some analysts say that MATIC may soon reach new peaks as it tries to keep a solid footing within – or even past – the $1 territory. Doctor Profit, a user on Twitter, is among those who endorse such theory.

The expert called Polygon’s coin “one of the most undervalued projects” in the market and asserted that traders and investors should view its price below $1 as a “gift.”

Another expert, renowned cryptocurrency researcher Ali Martinez, shows that, based on his evaluation, MATIC is emerging from a symmetrical triangular formation.

Martinez thinks that a strong upward advance that might push MATIC towards the $1.73 price level could occur if Polygon is able to maintain a weekly candlestick close above the $0.96 threshold.

Optimistic Outlook: MATIC’s Promising Trajectory

According to this analysis, Polygon has a bright future ahead of it, especially if some important thresholds are broken.

The X cryptocurrency community is optimistic about the future of the MATIC price trend. After bouncing off a long-term support region, Pentosh1 predicts the price will keep moving upwards.

Meanwhile, Polygon’s trading volume has recently increased dramatically. According to DefiLlama, it crossed the $150 million milestone since the middle of the month and reached around $400 million on December 26.

With its impressive performance, Polygon’s native token MATIC has drawn attention as the protocol’s trading volume reaches a new milestone.

Featured image from Shutterstock

Polygon Breaks Out Of Symmetrical Triangle, Analyst Puts This Target

An analyst has explained how Polygon is starting to break out of a symmetrical triangle pattern. If the breakout is confirmed, a rally to this level could be coming.

Polygon Weekly Price Is On The Verge Of Breaking Out Of A Symmetrical Triangle

In a new post on X, analyst Ali talked about a pattern that has been forming in the weekly price of MATIC. The pattern in question is called the “symmetrical triangle.”

As its name suggests, this technical pattern looks like a triangle. There are two main trendlines in this formation; the upper one is made by connecting a series of tops, while the lower one joins together bottoms. A feature of the pattern is that these two trendlines converge at about the same incline (which is why it has “symmetrical” in its name).

There are other triangle patterns in technical analysis as well, like the ascending and descending triangles. These patterns, for example, differ from the symmetrical triangle in that they have one trendline moving horizontally, while the symmetrical triangle has both of them at a slope.

As is generally the case with patterns like this, the upper trendline in the symmetrical triangle can act as a source of resistance, while the lower one may provide support.

Sustained breaks out of either of these levels can lead to a continuation of the trend in that direction. According to Ali, Polygon’s weekly price has been on the verge of such a breakout recently.

Below is the chart shared by the analyst that highlights this potential break brewing in MATIC:

Image

As displayed in the above graph, Polygon’s weekly price has recently surged toward the upper trendline of a symmetrical triangle pattern and appears to be trying to break out. “A sustained weekly candlestick close above $0.96 could propel MATIC towards $1.73,” explains the analyst.

So far, Polygon seems to be well on its way to confirming this breakout, as its price has shot up more than 19% during the last 24 hours. If the symmetrical triangle break indeed holds up, then MATIC would have to rally another 66% from the current price if the target set by Ali is to be met.

MATIC Has Surpassed The $1 Level For The First Time Since April

Polygon has enjoyed some sharp bullish momentum during the past week as its price has now reclaimed $1, a level that the cryptocurrency hasn’t visited since April.

The below chart shows how the asset has performed during the past month.

Polygon Price Chart

In the past week, the asset is up over 34%. The only cryptocurrency in the market cap top 20 list that has shown better returns is Solana (SOL) with its about 47% profits.

It’s currently unknown whether MATIC can keep up this rally, but if it can, the symmetrical triangle break would be confirmed and more surge would potentially follow.

Polygon Breaks Through $0.85, Is A Move To New Highs Next?

Polygon has seen some sharp uptrend during the past day and has now broken above $0.85. Here’s why this break could pave the way for a further rally.

Polygon Has Risen By More Than 6% During The Past 24 Hours

After topping above the $0.94 mark earlier in the month, MATIC had gone on to register some significant drawdowns. In the last few days, though, the asset appears to have hit a bottom around the $0.75 level, as it hasn’t gone below the mark yet.

Something that could add further evidence for this is the fact that bullish momentum has returned for Polygon in the past day, as its price has shot up over 6%.

The below chart shows how the cryptocurrency has performed during the past month:

Polygon Price Chart

With this sharp surge, the cryptocurrency has recovered back above the $0.85 mark. This break could turn out to be significant for Polygon if on-chain data is anything to refer to.

MATIC Has Broken Past A Major Resistance Zone With The Latest Surge

In a post on X, analyst Ali discussed about how Polygon was about to face a major test of on-chain resistance. When the analyst had made the post, the coin was still trading around the $0.78 mark.

Here is a chart that shows how the on-chain support and resistance levels looked like at the time of the post:

Polygon On-Chain Resistance

In on-chain analysis, the potential of any price range to act as support or resistance depends on the number of coins that the investors purchased inside the particular range.

This is because of the fact that holders are more likely to react whenever the price retests their cost basis or acquisition price, as such a retest can flip their profit-loss condition. The more addresses that have their cost basis inside a particular range, the stronger the market reaction when the price retests said range.

From the chart, it’s visible that Polygon’s price had been trading just under the $0.79 to $0.84 range at the time Ali had made the post. This range carried the cost basis of around 38,570 addresses, which bought 4.24 billion MATIC at it.

Generally, whenever the investors are in a loss (as these holders would have been when MATIC was trading under the range), there is a chance that they sell when the price retests their cost basis since they might get desperate to exit the market and break-even would sound like a good opportunity to do so.

As a result of this, price ranges above the spot price that are dense with investors can provide resistance to the cryptocurrency. This had made the aforementioned thick $0.79 to $0.84 range important for Polygon. “For MATIC to embark on a journey to new heights, it’s crucial to break through this level with conviction,” the analyst noted in the post.

Following the latest surge, MATIC has clearly surged past this major obstacle. And as is visible in the graph, there aren’t any ranges this difficult to break anymore, either. It now remains to be seen how the Polygon price develops from here, given the lower on-chain resistance at the levels above.

Analyst Says Polygon (MATIC) On Brink Of Major Move, Here’s Why

A cryptocurrency analyst has explained that Polygon could be on the brink of a major move due to a pattern in an on-chain indicator.

Polygon Whale Transactions Have Shot Up Recently

In a new post on X, analyst Ali has pointed out how the whales have shown a notable surge in activity on the MATIC network recently. The relevant indicator here is the “whale transaction count,” which keeps track of the total number of Polygon transfers happening on the blockchain that exceed a value of $100,000.

When the value of this metric is high, it means that the a large amount of such transactions are taking place right now. Such a trend is a sign that the whale entities have an active interest in trading the cryptocurrency.

On the other hand, the indicator being low implies the whales are potentially not paying much attention to the asset currently, as they aren’t making too many moves.

Now, here is a chart that shows the trend in the Polygon whale transaction count over the past month:

Polygon Whale Transaction Count

As displayed in the above graph, the Polygon whale transaction count has observed a sharp rise in the last few days and has attained high levels not seen at any point during the past month.

In the chart, Ali has also attached the data for another version of the metric that keeps track of only the MATIC transactions that are carrying a value of at least $1 million.

These massive transactions are the ones more likely to move the market and it would appear that they have also gone up in number recently, implying that the whales haven’t been shy of moving around large stacks.

“Such significant movements often signal impending price changes,” explains the analyst in the post. “So we could be on the brink of a major MATIC price move!”

Any volatility that may arise of this high whale activity, however, could theoretically go in either direction, as the whale transaction count only tells us whether the whales are active or not, and doesn’t contain any info about whether buying or selling is dominant.

Considering that the transactions have spiked after the price has registered a significant drawdown from its recent local top above $0.94, though, it’s possible that the whales are making these moves to buy at the current relatively low prices.

It now remains to be seen how the Polygon price develops in the coming days given the high amount of trading activity that the whales have been participating in.

MATIC Price

Following the recent plunge, Polygon hasn’t been moving much in the last few days as its price has gone rather stale below the $0.80 level. The below chart shows how the cryptocurrency has performed during the last 30 days.

Polygon Price Chart

Polygon (MATIC) Price Faces Crucial Turning Point That Could Trigger 50% Rally, Analyst Says

Polygon (MATIC) is the altcoin in focus this time around as an analyst provides an analysis of the crypto token. Based on this analysis, there is a feeling that things could soon begin to look up for MATIC.

Polygon Could See Significant Rally Soon

In a video shared on the Cheeky Crypto YouTube Channel, crypto analyst JB noted that MATIC has declined following Bitcoin’s pullback. However, this move is unexpected as he believes that the crypto token’s decline to the particular retracement area sets it up nicely for an upward move. Based on his projection, MATIC could rise to between $0.87 and $1.36.

JB also factored in other things that could suggest that an upward move is imminent. He alluded to the stochastic level, which had initially suggested an overbought condition. However, it has sharply corrected indicating that there could be another push to the upside for MATIC. On the other hand, the crypto analyst was also wary of factors that could spell a move to the downside.

One of them happens to be the volumes that are seen across various cryptocurrencies. JB stated the current volumes aren’t great, and this has weakened the prices of these crypto tokens. This could potentially hinder any projection of an upward move. Another is the possibility of MATIC losing the cross above the 200 EMA, as this suggests that a dump is imminent. 

Earlier in the video, JB had also emphasized the 5-wave pattern that was forming on different timeframes on the MATIC chart. The analyst seemed uncertain about whether or not the fifth wave was just forming. He noted that a push above $94.5 would suggest that the last wave is still to come. There is also the possibility that it could just be an A, B, and C pattern. 

Polygon MATIC price chart from Tradingview.com

MATIC To $100 Still Possible

Still analyzing MATIC’s price pattern on the charts, JB mentioned that he was still bullish on the crypto token ahead of the imminent bull market. He had previously mentioned a target of $100 for MATIC in the next bull run, and he is still standing by the projection. In fact, JB noted that a new structure forming on the charts suggests that the crypto token could rise higher than that. 

As part of this prediction, he sees MATIC being a “powerhouse” in the bull run and being one of the standout altcoins. One of the factors that he believes will contribute to MATIC’s dominance is the potential approval of the pending Ethereum Spot ETF applications. He believes that the crypto token could be a huge beneficiary, considering its role in the Ethereum ecosystem. 

At the time of writing, MATIC is trading at around $0.85, down over 1%, according to data from CoinMarketCap.

Polygon Whales Go On 120 Million MATIC Buying Spree, Rally Soon?

On-chain data shows the Polygon whales have loaded up on 120 million MATIC during the past week, a sign that could be bullish for the asset’s price.

Polygon Whales Have Increased Their Holdings Recently

As pointed out by an analyst in a post on X, MATIC whales have made a decent amount of buys during the past week. The relevant indicator here is the “Supply Distribution,” which keeps track of the total amount of Polygon that the different holder groups are carrying in their wallets right now.

In the context of the current topic, the whales are the ones of interest and their group address balance range may be defined as 10 million to 100 million MATIC (which converts to about $7.7 million to $77 million at the current exchange rate).

The whales are the most powerful entities on the network, because of the sheer scale of reserves they hold. As such, their movements can often be worth keeping an eye on, as they may end up having an influence on the asset’s value.

Now, here is a chart that shows the trend in the Polygon Supply Distribution specifically for these humongous holders over the past month:

Polygon Whales

As displayed in the above graph, the indicator’s value for the Polygon whales has registered a notable uplift during the past week. In total, these large investors have scooped up more than 120 million MATIC (approximately $92.5 million) in this window.

These buys from the whales have come while the cryptocurrency’s price has been trading around its lows following a sharp pullback from just under the $1 level.

Naturally, this accumulation could be a positive sign for the asset’s future, as it suggests that the whales believe the current prices are low enough to gamble more on.

While this may be so, though, another signal has also been brewing for Polygon recently and this one’s not quite as optimistic. As another analyst has explained in a CryptoQuant Quicktake post, the MATIC exchange reserve has observed a considerable rise recently, as the below chart shows.

Polygon Exchange Reserve

The “exchange reserve” here is an indicator that keeps track of the total amount of Polygon that’s currently being stored in the wallets of all centralized exchanges.

From the chart, it’s apparent that the metric started rising shortly after the recent rally in the asset took place, implying that investors began making net deposits.

One of the main reasons why investors would transfer their coins to the exchanges is for selling purposes, so it’s likely that these deposits were coming from those looking to cash in on the profit-taking opportunity.

This isn’t particularly egregious behavior, but the worrying fact may be that the exchange reserve has only continued to rise even after the asset has observed a significant downtrend from the top, meaning that the selling pressure isn’t slowing down.

The whale accumulation is a bullish sign for Polygon, but so long as these exchange inflows continue, it’s perhaps unlikely that the price would feel any benefit in the short term.

MATIC Price

Polygon is currently trading above the $0.77 mark, having seen a plunge of over 21% since the top earlier in the month.

Polygon Price Chart

MATIC Price Prediction: Polygon Turned Sell On Rallies In Short-Term

MATIC price is down over 10% after the SEC’s lawsuit against Kraken mentioned MATIC as security. Polygon is under pressure and might struggle to recover.

  • MATIC price started a fresh decline from the $0.98 resistance against the US dollar.
  • The price is trading below $0.80 and the 100 simple moving average (4 hours).
  • There is a key bearish trend line forming with resistance near $0.788 on the 4-hour chart of the MATIC/USD pair (data source from Kraken).
  • The pair could continue to decline if it stays below the $0.800 resistance zone.

Polygon Price Takes Hit

After a decent increase, Polygon’s price struggled to clear the $1.00 resistance. MATIC formed a high near $0.9829 and recently started a steady decline, underperforming Bitcoin and Ethereum.

There was a drop below the $0.920 and $0.850 support levels. The bears even pushed the price below the $0.820 support and the 100 simple moving average (4 hours). Finally, it tested the $0.728 support. A low has formed near $0728 and the price is now consolidating losses.

MATIC is trading below $0.80 and the 100 simple moving average (4 hours). There is also a key bearish trend line forming with resistance near $0.788 on the 4-hour chart of the MATIC/USD pair.

Immediate resistance is near the $0.785 level or the trend line. It is near the 23.6% Fib retracement level of the recent decline from the $0.9829 swing high to the $0.7285 low. The first major resistance is near the $0.800 level. If there is an upside break above the $0.800 resistance level, the price could continue to rise.

MATIC Price Prediction

Source: MATICUSD on TradingView.com

The next major resistance is near $0.855 or the 50% Fib retracement level of the recent decline from the $0.9829 swing high to the $0.7285 low. A clear move above the $0.855 resistance could start a steady increase. In the stated case, the price could even attempt a move toward the $0.920 level or $0.950.

More Losses in MATIC?

If MATIC’s price fails to rise above the $0.800 resistance level, it could continue to move down. Immediate support on the downside is near the $0.7285 level.

The main support is near the $0.700 level. A downside break below the $0.700 level could open the doors for a fresh decline toward $0.650. The next major support is near the $0.618 level.

Technical Indicators

4 hours MACD – The MACD for MATIC/USD is gaining momentum in the bearish zone.

4 hours RSI (Relative Strength Index) – The RSI for MATIC/USD is now below the 50 level.

Major Support Levels – $0.728 and $0.700.

Major Resistance Levels – $0.785, $0.800, and $0.855.

Over 100 Million MATIC Incinerated In POLS Mint, But The Gold Rush Is Far From Over

The POLS mint was arguably the most anticipated event on the Polygon (MATIC) blockchain this year and the stats have corroborated this. On Thursday, the Bitcoin BRC-20-inspired mint took place and the burn figures have been nothing short of impressive. Over 100 million MATIC tokens were incinerated as a result of this event. But data suggests that this rush is far from over.

POLS Mint Triggers Massive MATIC Burns

The POLS token mint saw a massive turnout from the Polygon community as thousands of investors clamored to mint their tokens. As a result, the fees on the network skyrocketed and the ensuing token burn crossed 100 million MATIC.

According to reports, the fees on the Polygon network skyrocketed by over 13,000% sending fees as high as 4,005 gwei at the peak. Polygon founder Sandeep Nailwal acknowledged this increase in network activity, posting a chart that showed that the network had processed over 6 million transactions in a 24-hour period, amounting to a 170 transactions per second (TPS) rate.

EVM data shows that the POLS mint saw over 100 million MATIC burned which translated to over $80 million in fees alone. The NFT collection is rising in popularity and by Friday, a total of 10.32% of the collection has been minted.

Why Polygon Is Just Starting

One of the major drivers of the POLS popularity is its similarity to the BRC-20 standard that allowed for minting NFTs on the Bitcoin network which has been incredibly successful so far. Given the success of the BRC-20 tokens, this bullishness has translated to the PRC-20 tokens.

With only 18,480 owners of the POLS tokens and over 400,000 daily users on the Polygon network, there is still a lot of room for the new Polygon standard to catch on. When this happens, the expectation is that more investors will get into the tokens.

Polygon users are also actively awaiting the rebranding of the MATIC tokens into the new POL token. This rebranding is expected to give the token a sort of ‘fresh start’ that could propel the price upward. Users will have to convert their MATIC tokens to POL. However, the team has said that holders will have up to four years to do this.

The MATIC price initially benefitted from this surge in user activity by rising above the $0.94 level on Thursday. However, the altcoin has managed to lose some of those gains after falling 6.61% on Friday, according to data from Coinmarketcap. It is currently trading at $0.8626, albeit with a 2.67% gain on the weekly chart.

MATIC price chart from Tradingview.com (POLS Polygon)