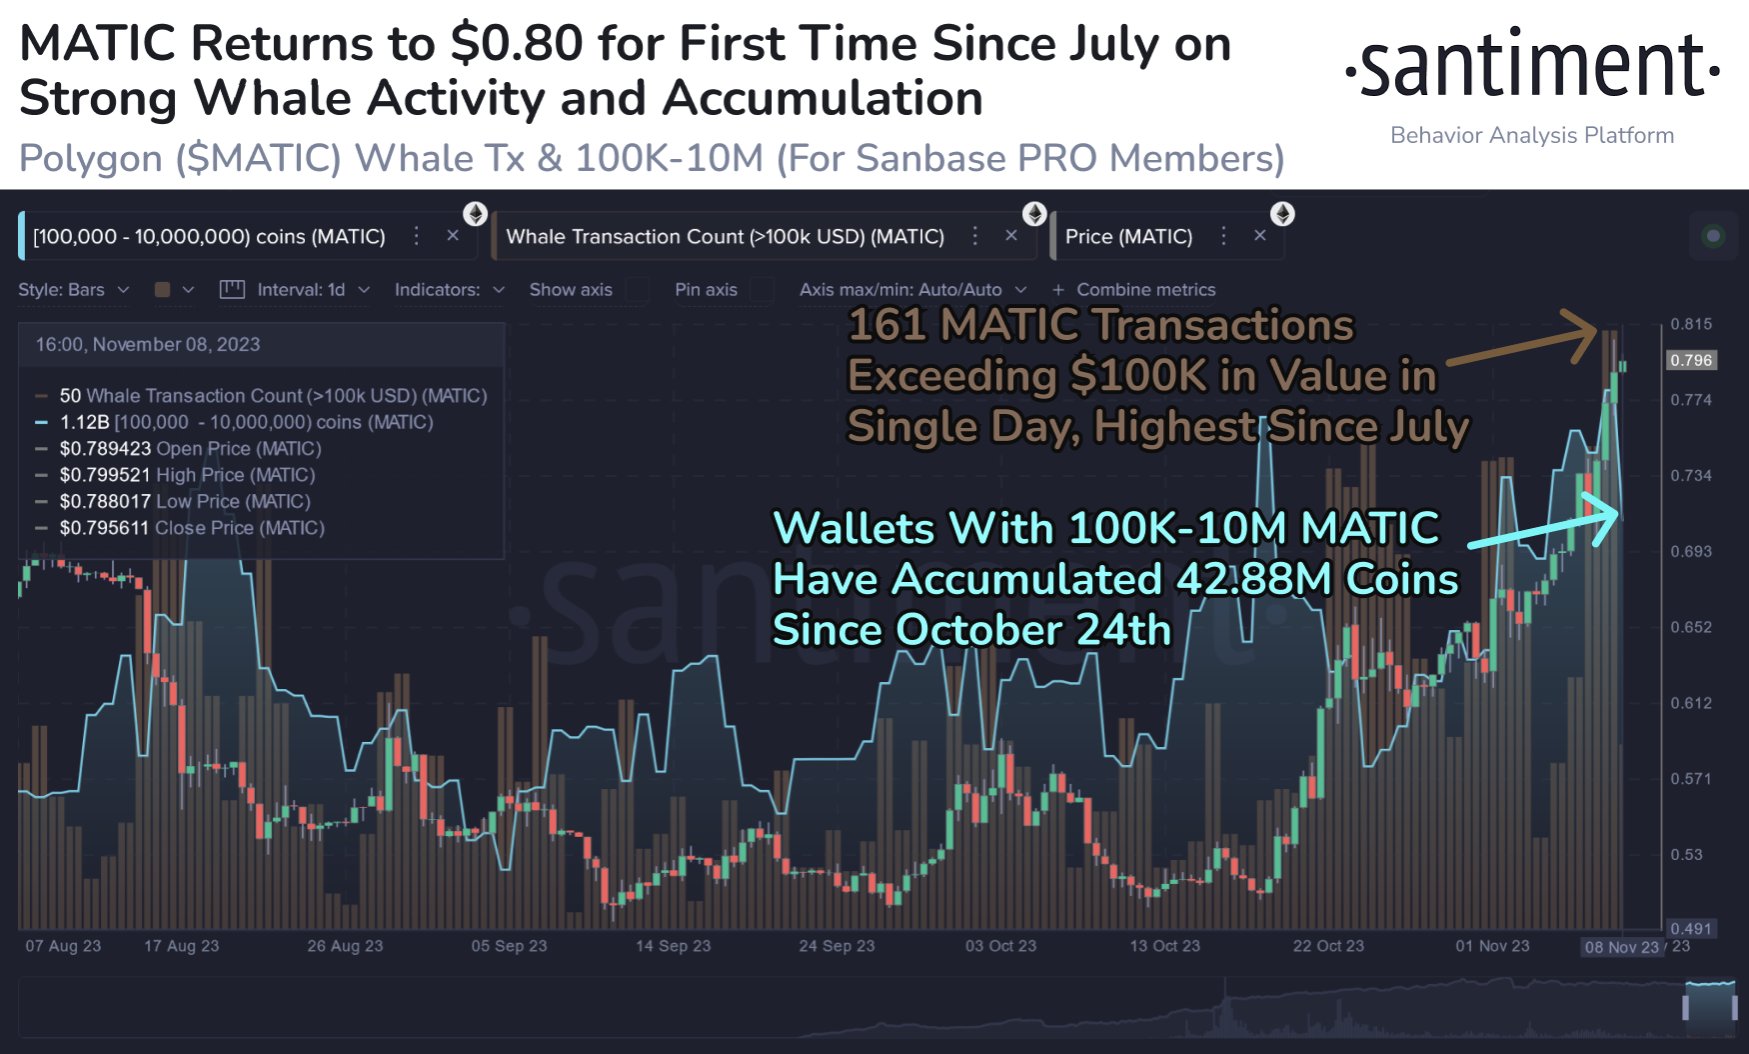
On-chain data shows the Polygon whales have loaded up on 120 million MATIC during the past week, a sign that could be bullish for the asset’s price.
Polygon Whales Have Increased Their Holdings Recently
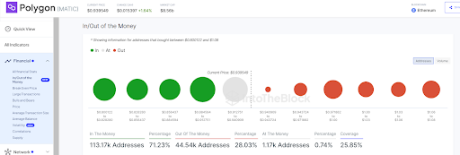
As pointed out by an analyst in a post on X, MATIC whales have made a decent amount of buys during the past week. The relevant indicator here is the “Supply Distribution,” which keeps track of the total amount of Polygon that the different holder groups are carrying in their wallets right now.
In the context of the current topic, the whales are the ones of interest and their group address balance range may be defined as 10 million to 100 million MATIC (which converts to about $7.7 million to $77 million at the current exchange rate).
The whales are the most powerful entities on the network, because of the sheer scale of reserves they hold. As such, their movements can often be worth keeping an eye on, as they may end up having an influence on the asset’s value.
Now, here is a chart that shows the trend in the Polygon Supply Distribution specifically for these humongous holders over the past month:
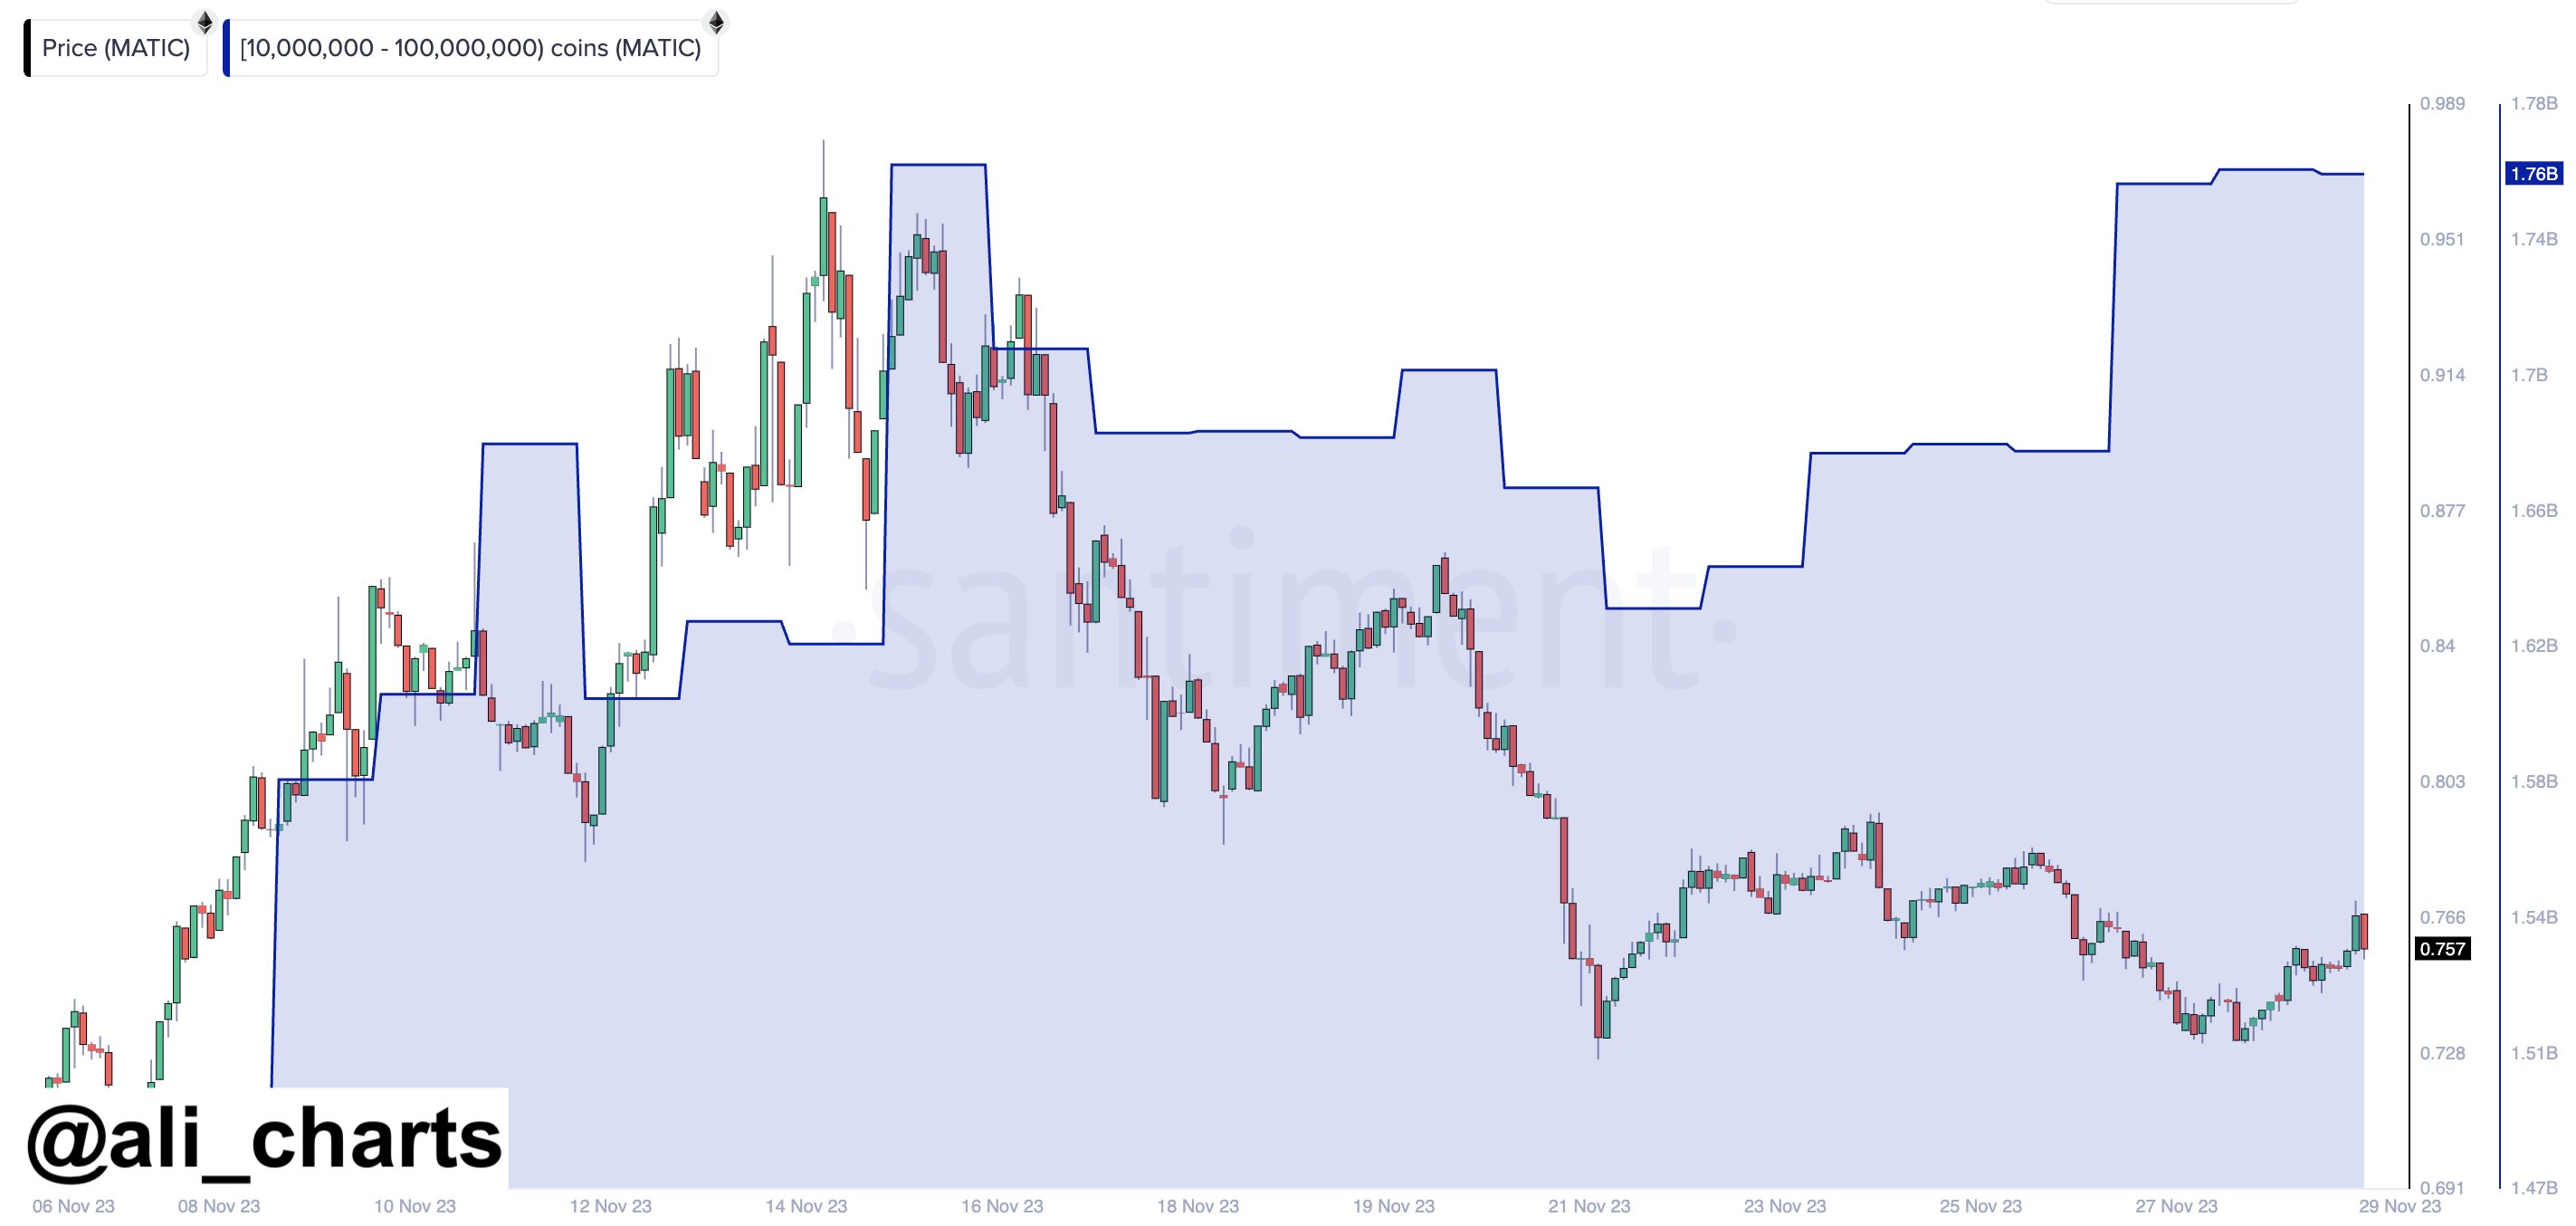
As displayed in the above graph, the indicator’s value for the Polygon whales has registered a notable uplift during the past week. In total, these large investors have scooped up more than 120 million MATIC (approximately $92.5 million) in this window.
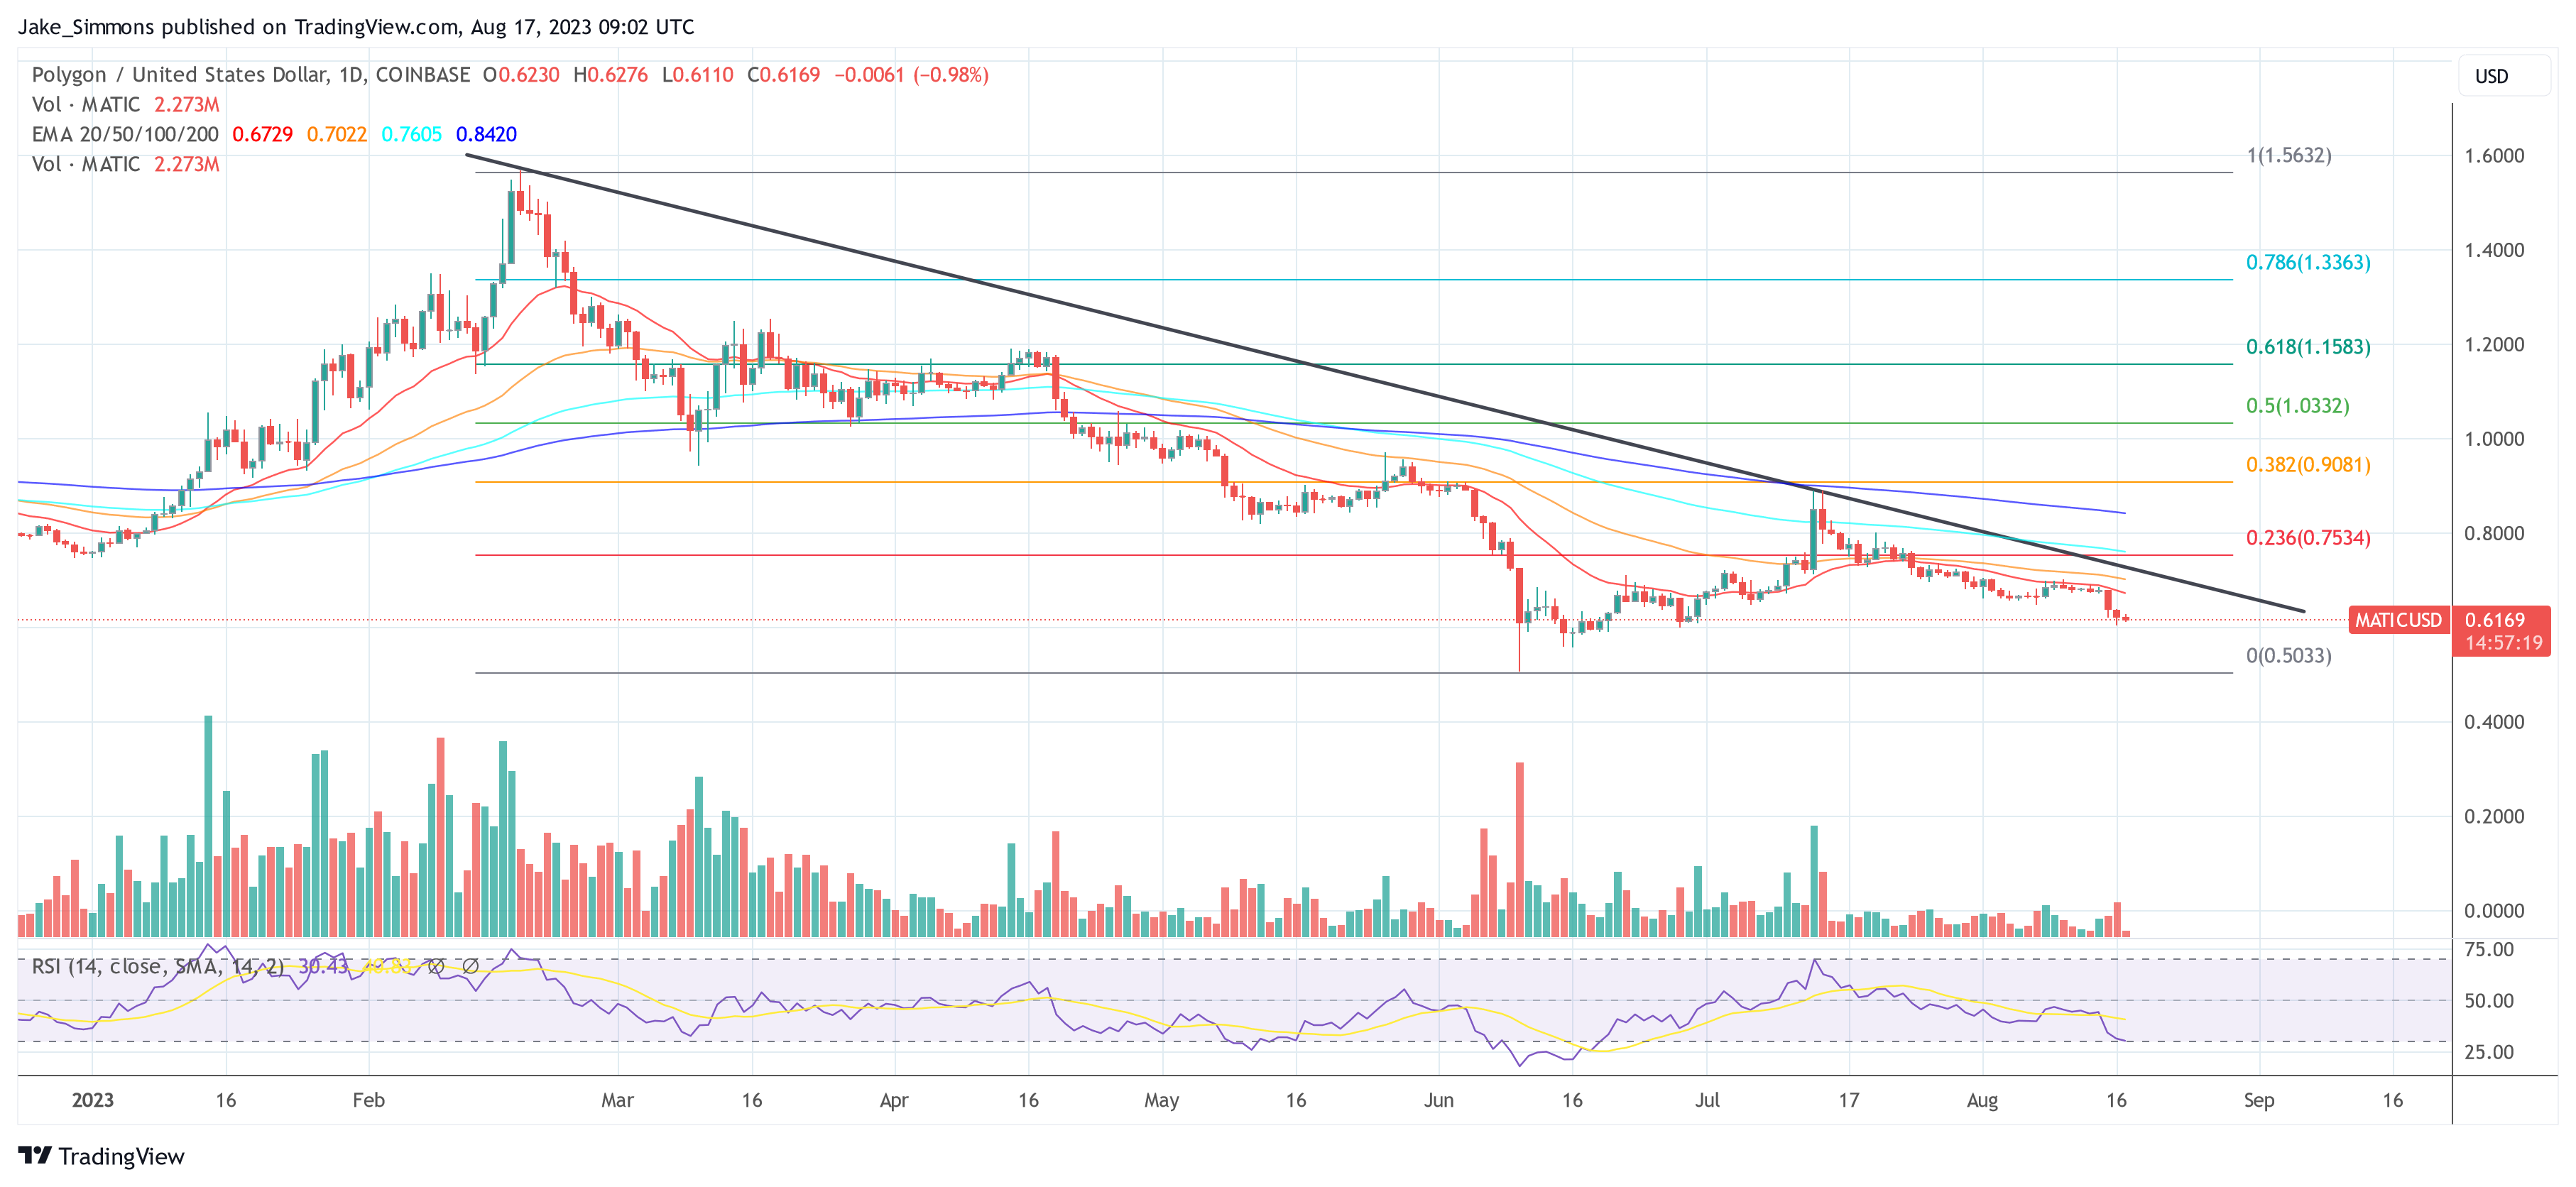
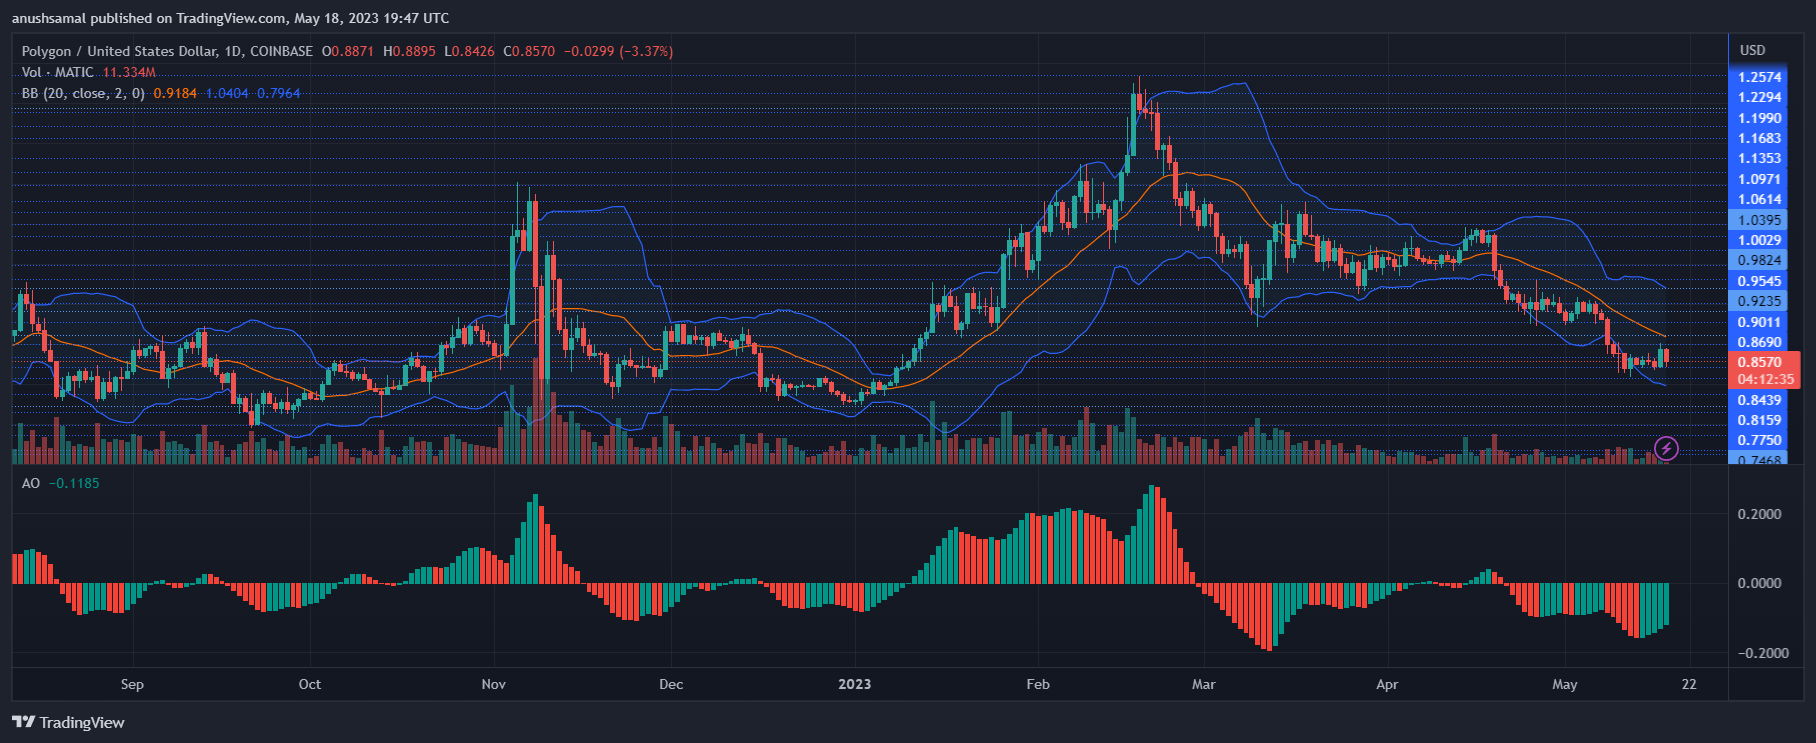
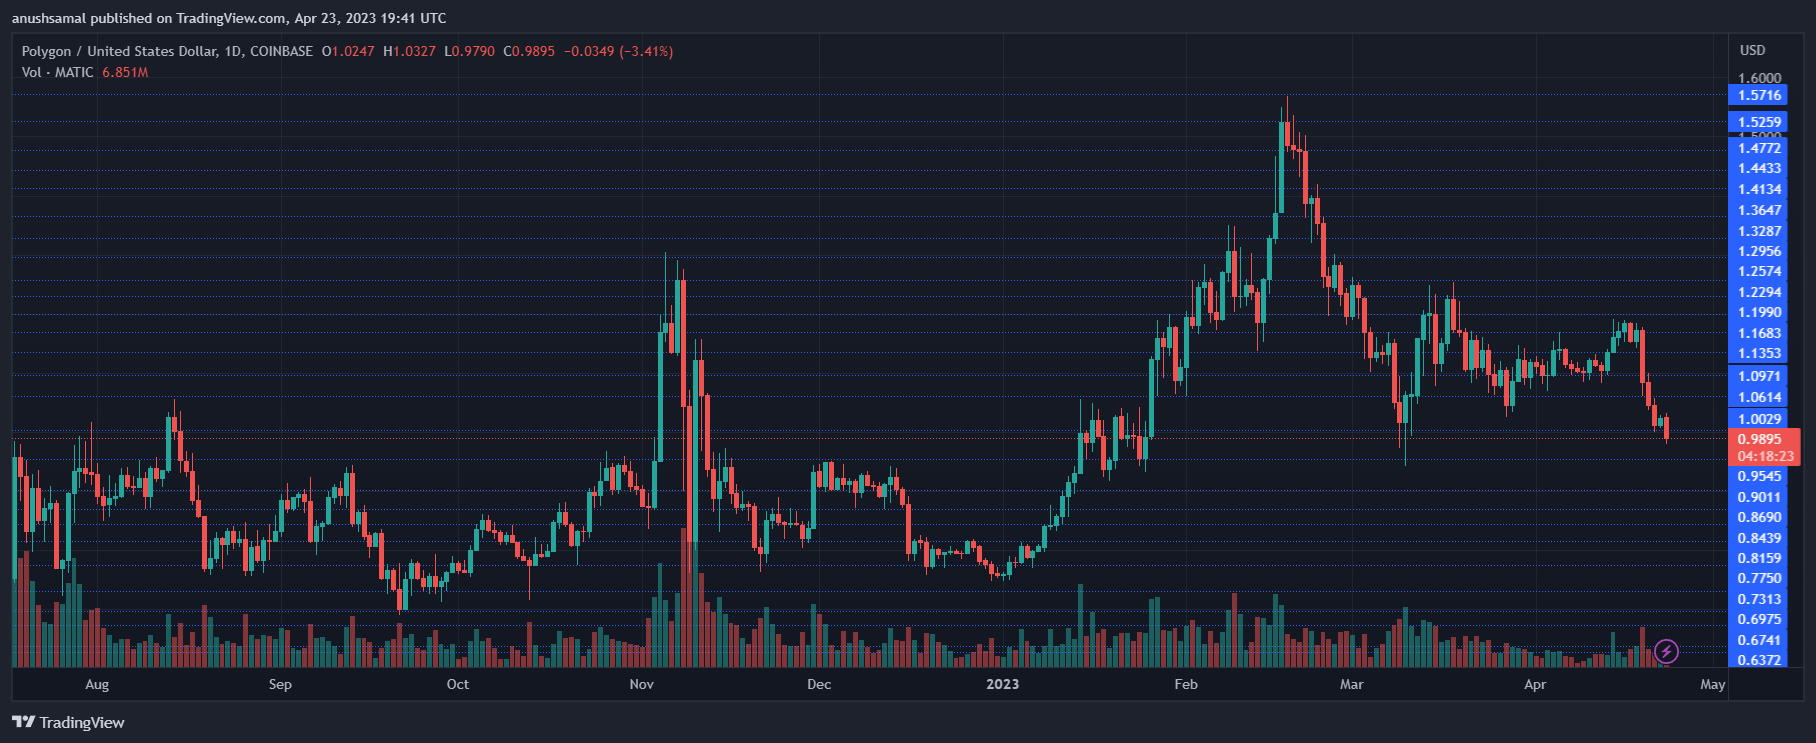
These buys from the whales have come while the cryptocurrency’s price has been trading around its lows following a sharp pullback from just under the $1 level.
Naturally, this accumulation could be a positive sign for the asset’s future, as it suggests that the whales believe the current prices are low enough to gamble more on.
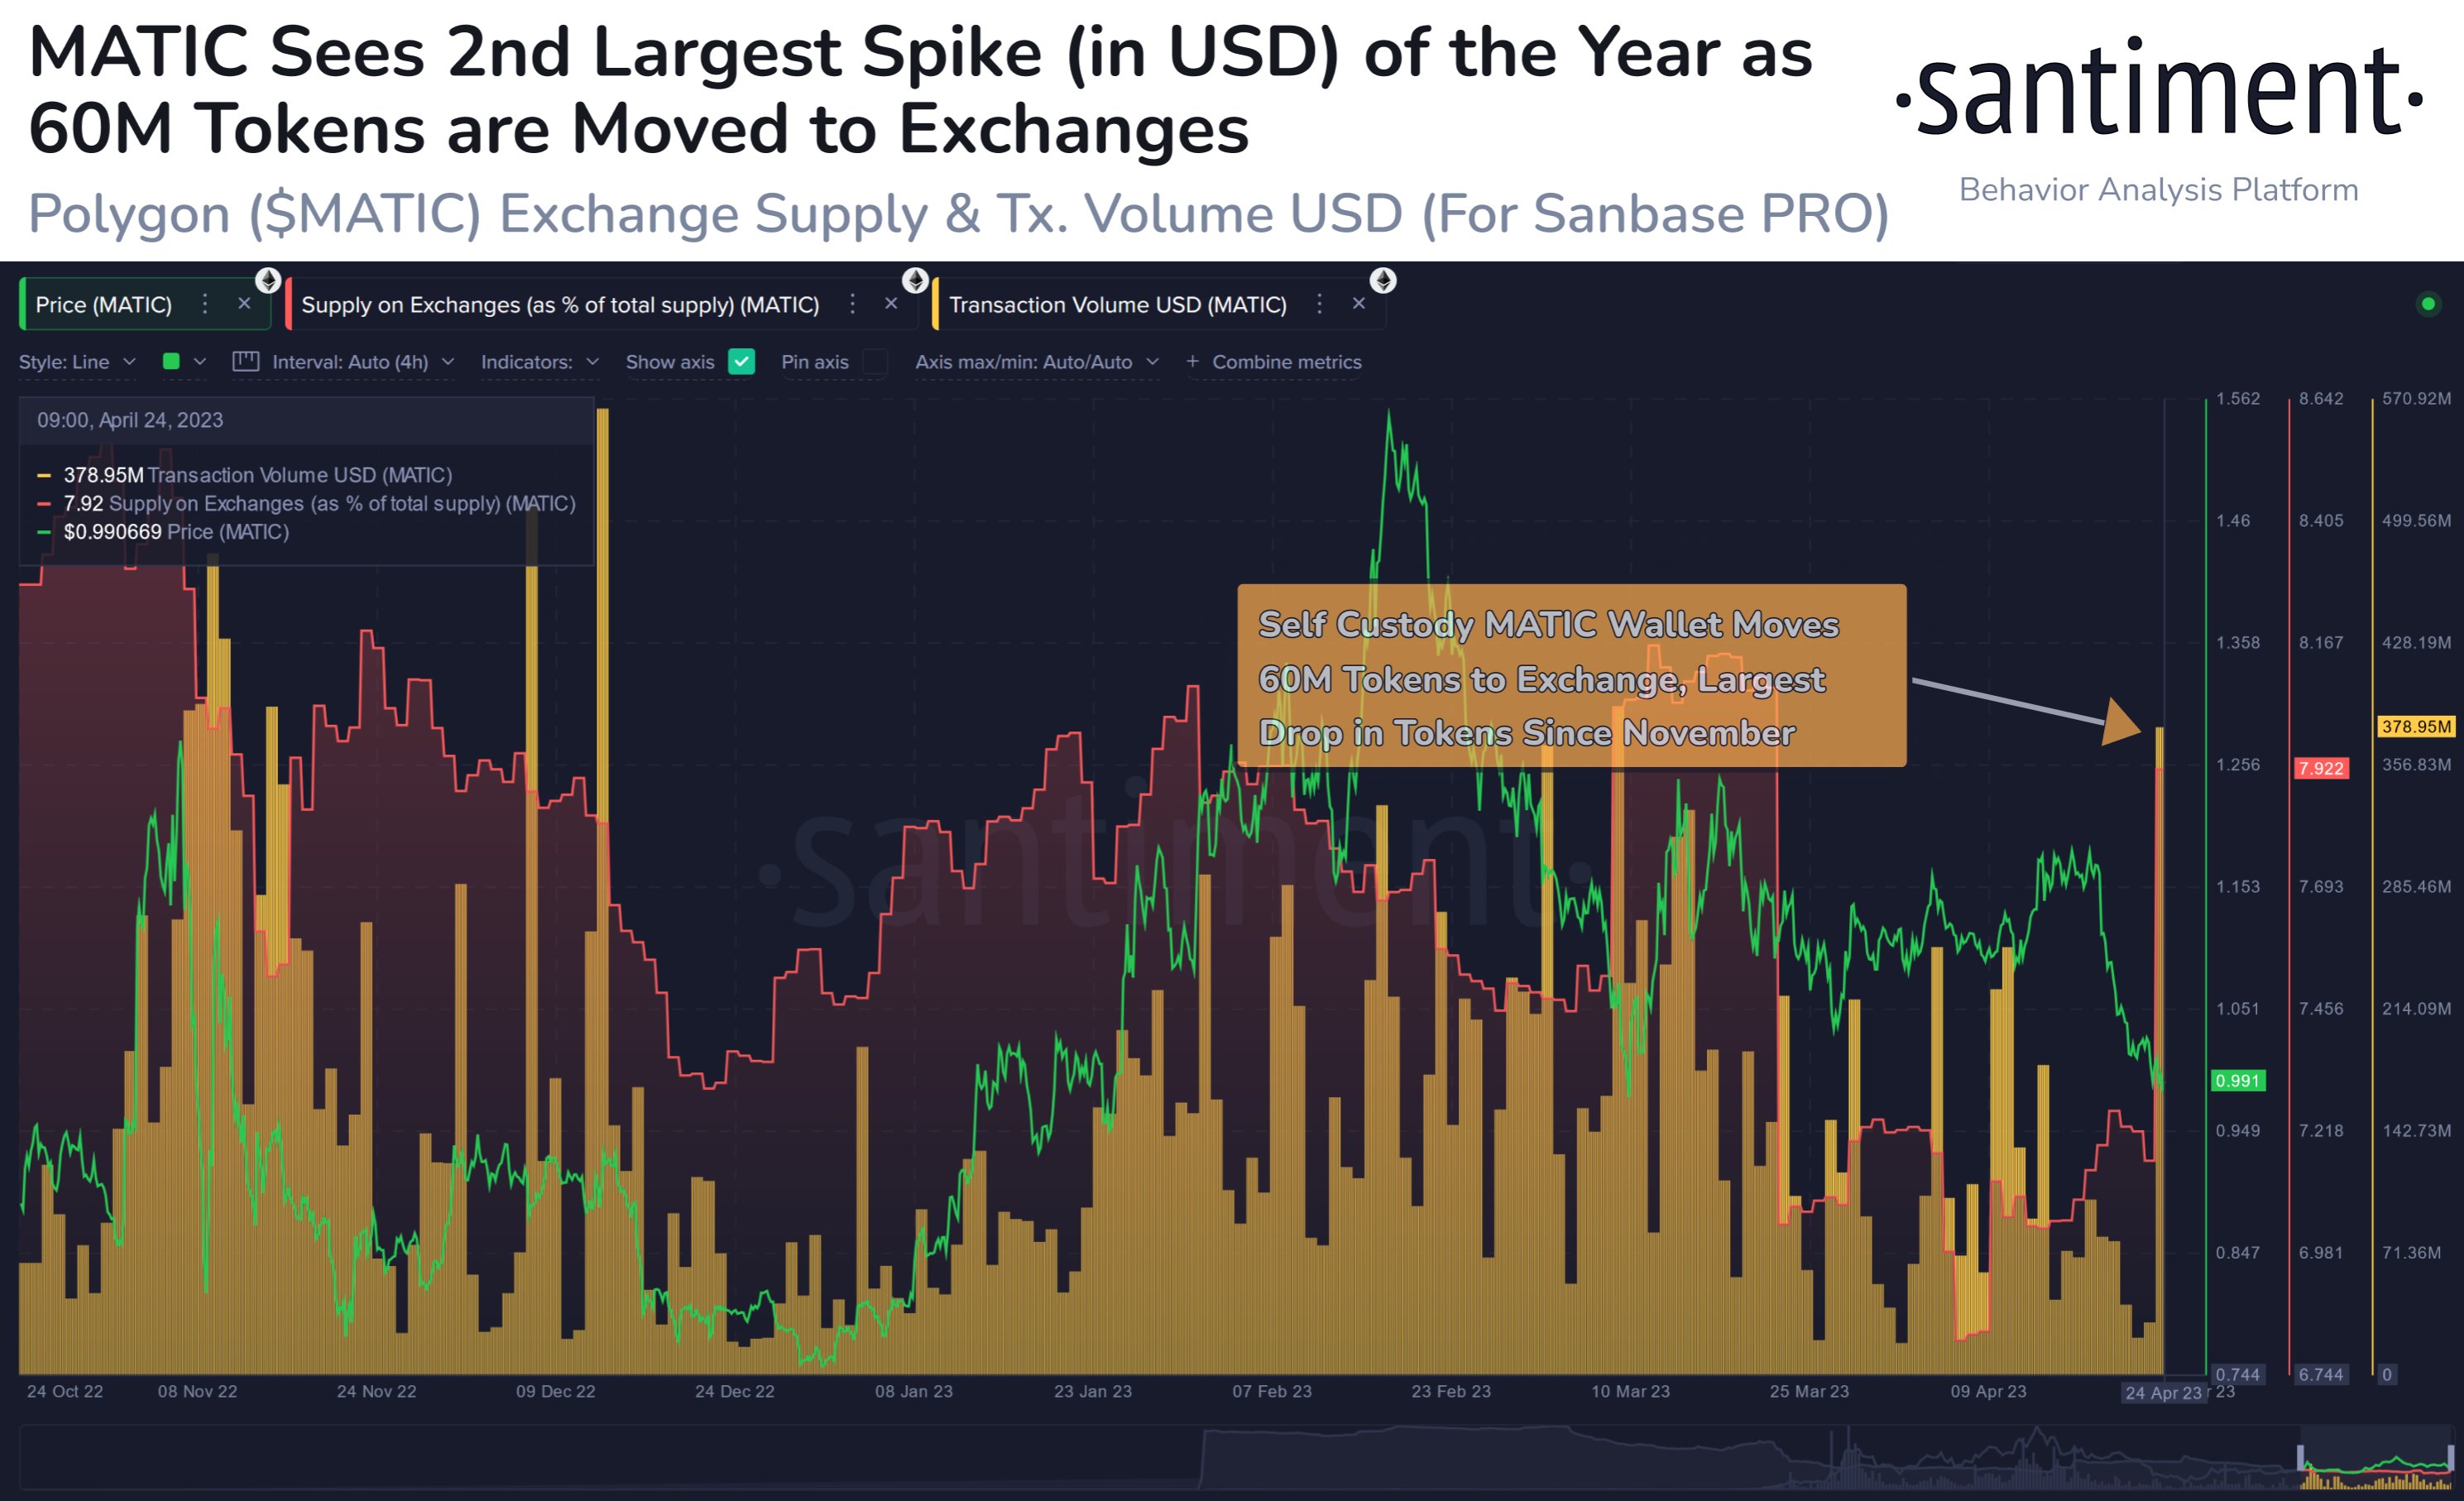
While this may be so, though, another signal has also been brewing for Polygon recently and this one’s not quite as optimistic. As another analyst has explained in a CryptoQuant Quicktake post, the MATIC exchange reserve has observed a considerable rise recently, as the below chart shows.

The “exchange reserve” here is an indicator that keeps track of the total amount of Polygon that’s currently being stored in the wallets of all centralized exchanges.
From the chart, it’s apparent that the metric started rising shortly after the recent rally in the asset took place, implying that investors began making net deposits.
One of the main reasons why investors would transfer their coins to the exchanges is for selling purposes, so it’s likely that these deposits were coming from those looking to cash in on the profit-taking opportunity.
This isn’t particularly egregious behavior, but the worrying fact may be that the exchange reserve has only continued to rise even after the asset has observed a significant downtrend from the top, meaning that the selling pressure isn’t slowing down.
The whale accumulation is a bullish sign for Polygon, but so long as these exchange inflows continue, it’s perhaps unlikely that the price would feel any benefit in the short term.
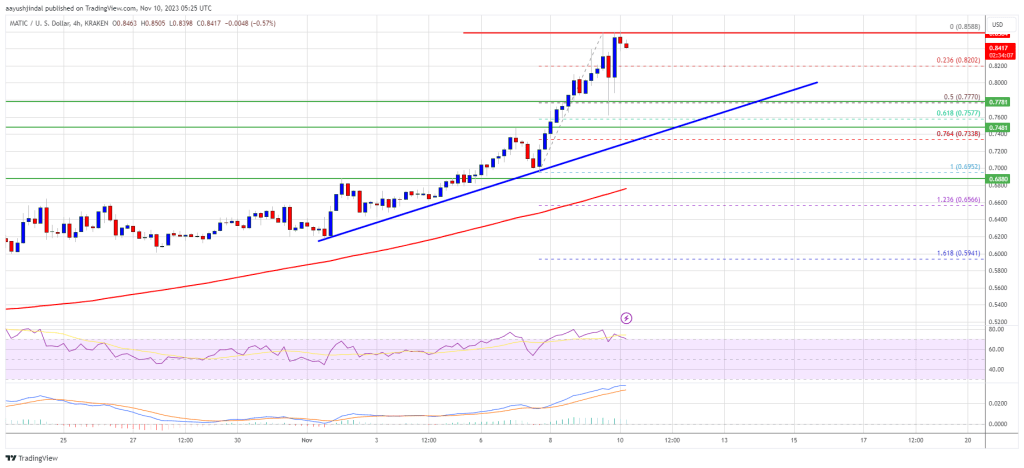
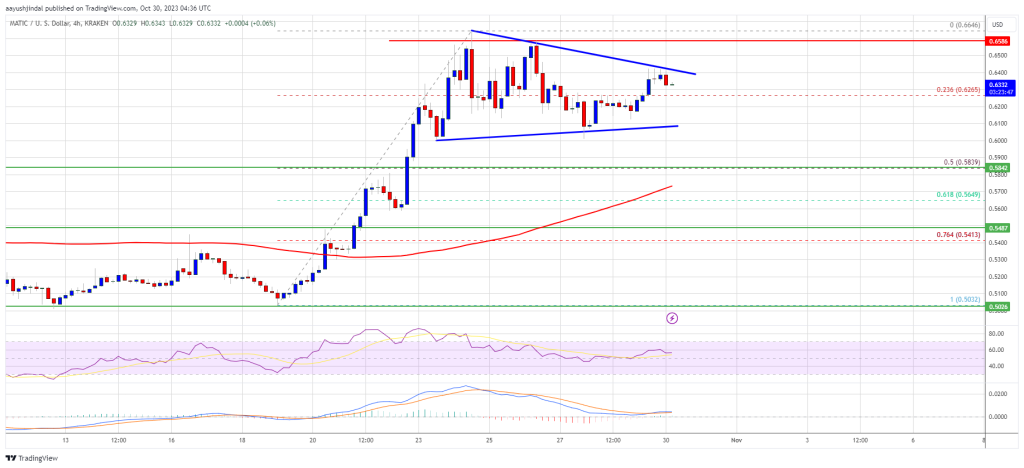
MATIC Price
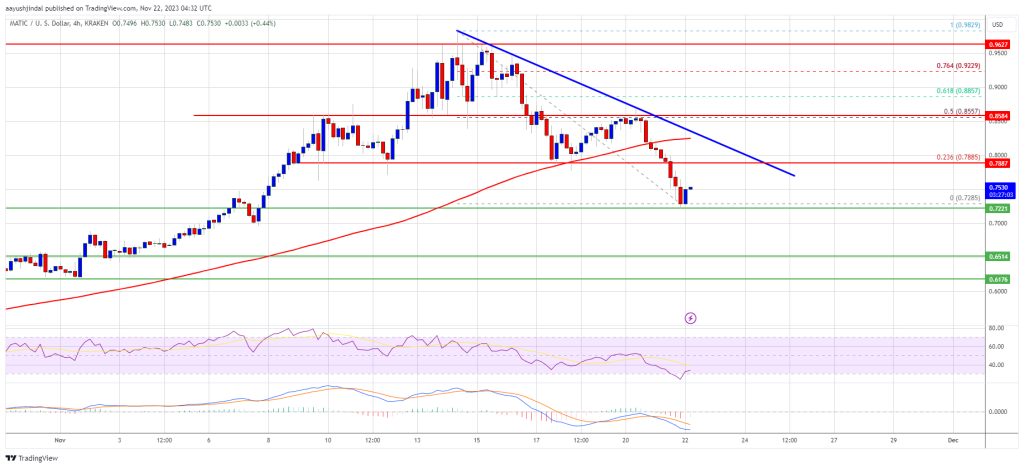
Polygon is currently trading above the $0.77 mark, having seen a plunge of over 21% since the top earlier in the month.
 (@sandeepnailwal)
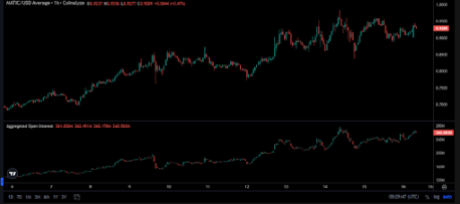
 15,826,267