
The service will reportedly be the exchange operator’s first major venture into the crypto industry.
Cryptocurrency Financial News
The service will reportedly be the exchange operator’s first major venture into the crypto industry.
Nasdaq announced its intentions last September as it looked to respond to the demand from institutional crypto investors.

Analyst, who correctly predicted the late 2020 bull run, said 2023 could be a surprisingly good year for both crypto and equities.


The bullish rise of Bitcoin and other altcoins in January helped the Nasdaq Crypto Index to register its third-highest monthly gain.

Strong corporate earnings and investors’ anticipation of a Federal Reserve pivot are helping to cement the case for risk assets like Bitcoin.


LTC price could drop alongside riskier assets as macro analysts sound a bull trap alarm over this potential “head fake” recovery.


Bitcoin price continues to press higher this week as demand for stablecoins and a key BTC price metric suggests bulls have a “healthy appetite.”


Bitcoin mining firm Argo regained compliance with Nasdaq’s listing rule, which requires a company to maintain its common stock’s minimum bid price of $1 for 30 consecutive trading days.


Bitcoin nearly broke its record for the longest streak of daily green price candles this month, but many believe its recent surge could be short-lived.


The surge in crypto mining stocks was a relief for the industry after a crippling year, where public crypto miners incurred $4 billion in liabilities.
Data shows Bitcoin has been more stable than gold, DXY, Nasdaq, and S&P 500 recently, here’s what history says could follow next.
According to the latest weekly report from Arcane Research, BTC has been more stable than these assets for a record duration already this year. The “volatility” is an indicator that measures the deviation of daily returns from the average for Bitcoin.
When the value of this metric is high, it means the crypto has been registering a higher amount of returns compared to the mean, suggesting that the coin has involved a higher trading risk recently. On the other hand, low values imply there haven’t been any significant fluctuations in the price in recent days, showing that the market has been stale.
Now, here is a chart that shows the trend in the 30-day volatility for Bitcoin over the course of its entire history:
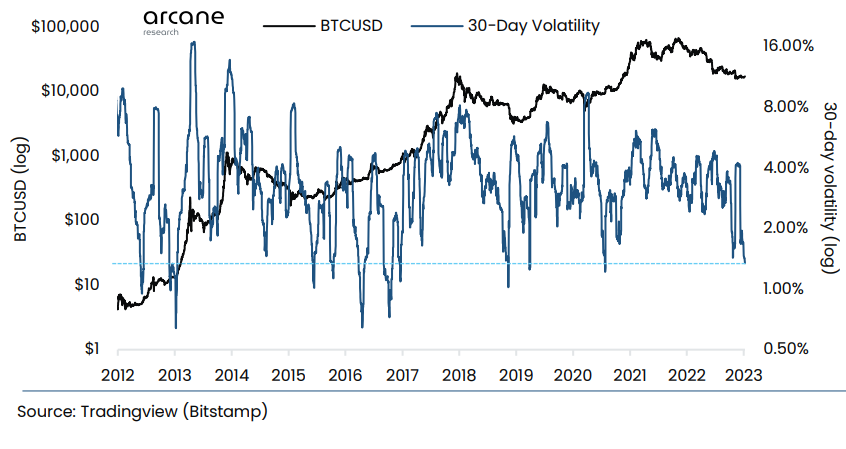
As shown in the above graph, the Bitcoin 30-day volatility is at very low levels currently as the price has been trading mostly sideways in recent weeks. The current values of the indicator are the lowest since 2020, but they are still higher than some of the lows during previous bear markets.
One consequence of this recent flat movement has been that BTC has become more stable than assets like gold, DXY, Nasdaq, and S&P 500. To compare these assets’ volatilities against each other, the report has made use of the 5-day volatility (and not the 30-day or 7-day one).
The below table highlights the periods in BTC’s lifetime when the crypto’s 5-day volatility has been simultaneously lower than all these traditional assets.

As the table displays, there have only ever been a handful of instances where the Bitcoin 5-day volatility has been lower than that of gold, DXY, Nasdaq, and S&P 500 at the same time. The report labels such occurrences as “relative volatility compression” periods.
It seems like, before the latest streak, the highest duration of this trend was just 2 consecutive days. This means that the current relative volatility compression period is already the longest ever in the coin’s history.
Another interesting fact in the table is the total returns in Bitcoin that were observed in the 30-day period following the first date of the volatility compression in each of these instances. Besides one occurrence (September 29, 2022), all other volatility compression periods were succeeded by the price becoming highly volatile and registering large returns.
It now remains to be seen whether a similar pattern will follow this time as well, with Bitcoin experiencing a wild next 30 days after this seriously flat price action.
At the time of writing, Bitcoin is trading around $17,400, up 3% in the last week.


Bitcoin’s yearly losses are similar to high-profile stocks like Tesla and Meta, with BTC investors down 70% in 2022.


CoinShares’ stock was previously listed on the Nasdaq First North Growth Market, an alternative stock exchange for small and medium-sized companies.


Bitfarms has an initial period of 180 calendar days to have its shares trading above $1 for at least 10 days before June 12, 2023.
A quant has explained why the recent retest of a critical support level by Nasdaq may help Bitcoin reverse its own trend.
As pointed out by an analyst in a CryptoQuant post, Nasdaq-100 is currently above a support line that has historically been important.
Nasdaq-100 (NDX) is a stock market index that includes 102 equity securities issued by 101 of the largest non-financial companies (based on their market caps) listed on the Nasdaq stock exchange.
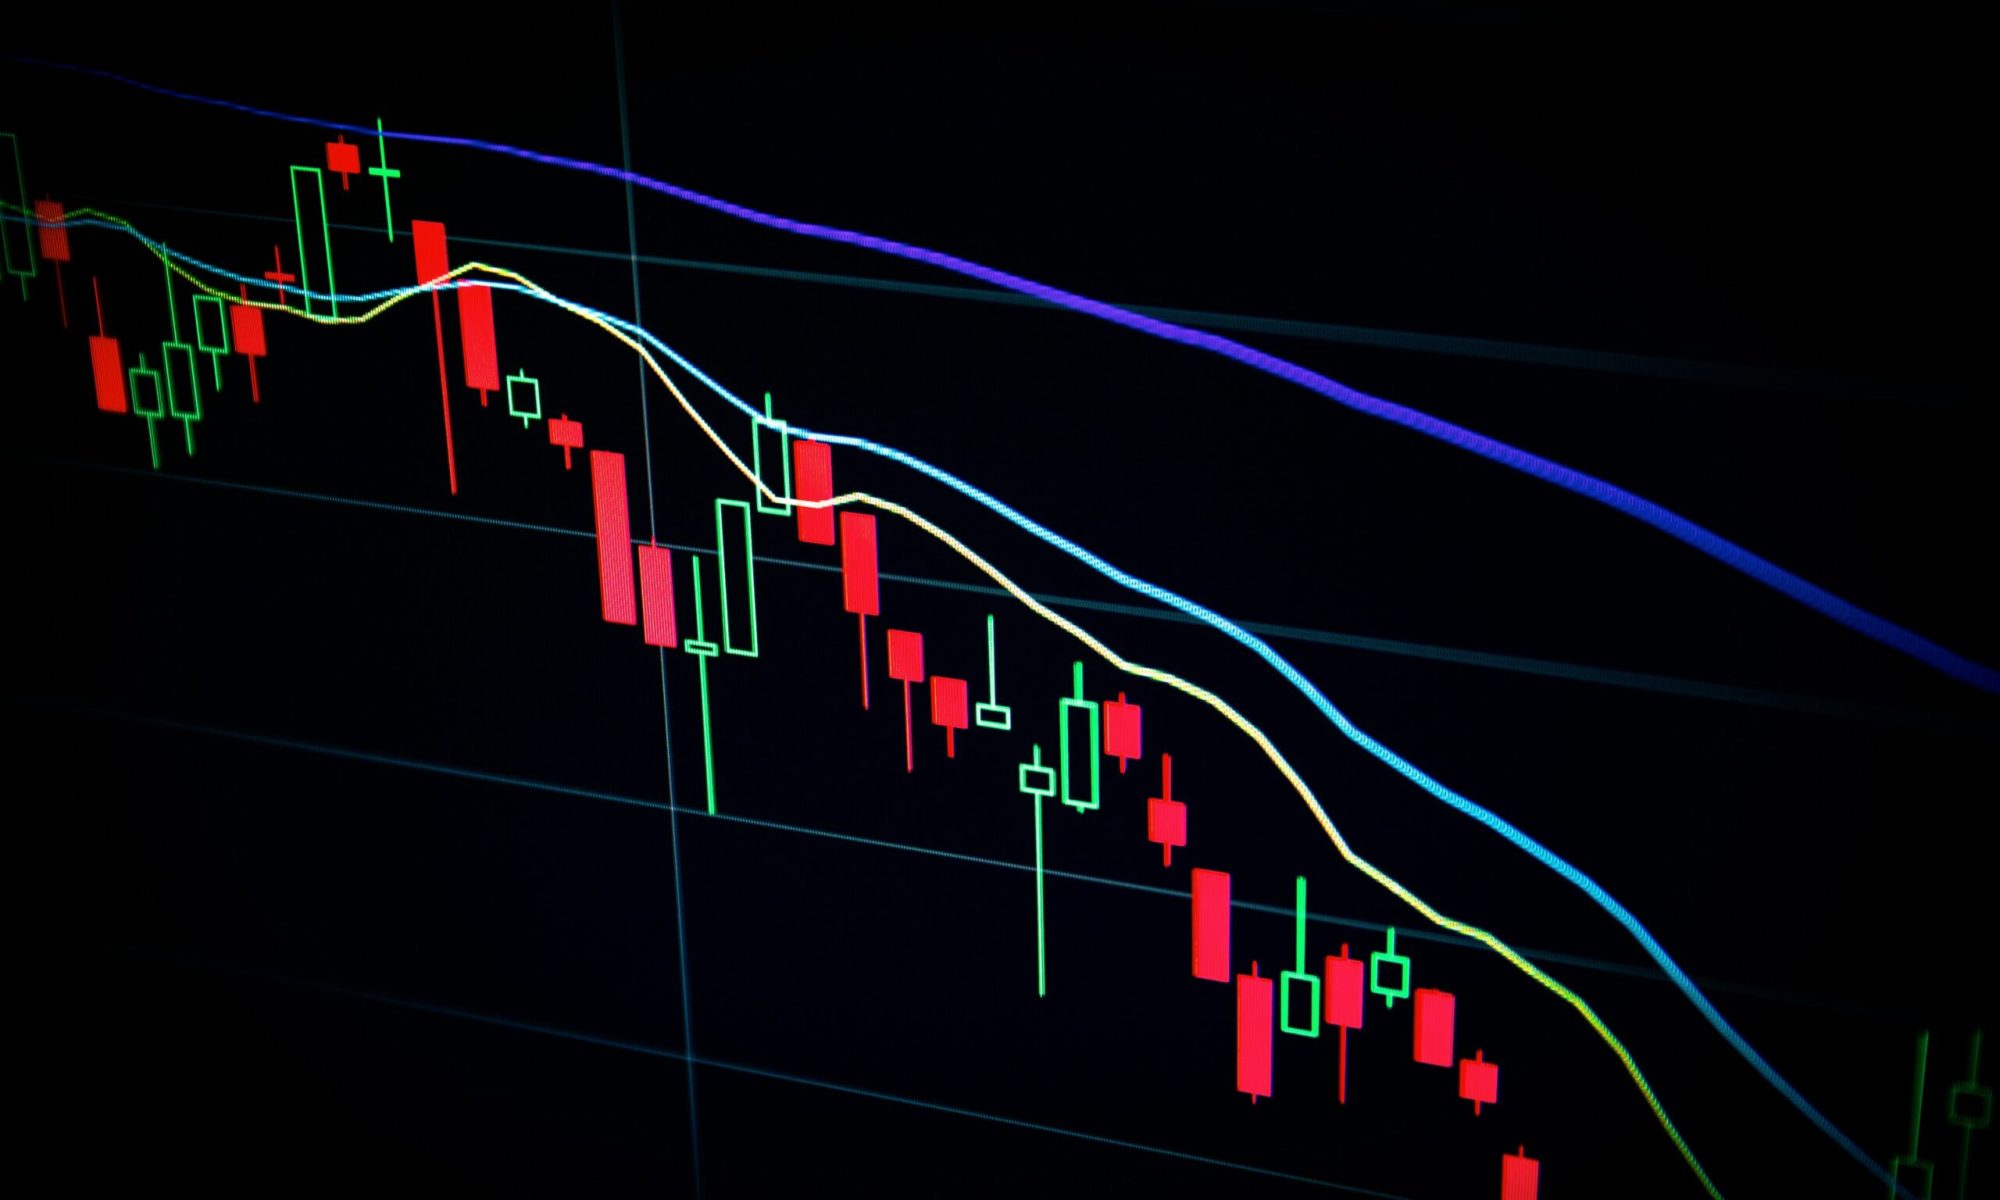
Here is a chart that shows how this trendline has acted as a bounce in the index’s price over the past decade:
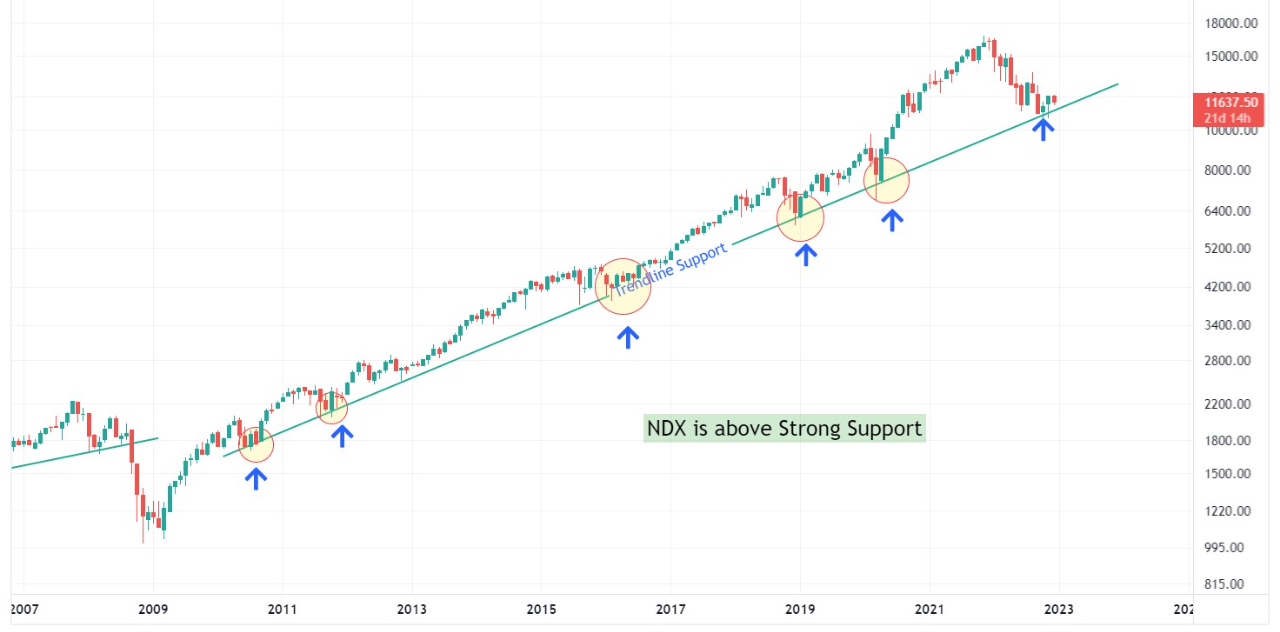
As you can see in the above graph, the price of NDX has been supported five times by this trendline since the year 2010. In each of these instances, the line has put a check on the decline in the index, and has consequently reversed it back up.
Recently, the Nasdaq-100 index has once again made a touch of this trendline, and has so far managed to stay above it.
The quant notes that this retest could have been the end of the latest downwards trend, and might have also been the point of return of a bullish trend.
However, if the trendline is lost instead, it would show the extreme strength of the downtrend, and would suggest that there is more drawdown ahead for the market.
At the same time, Bitcoin has also been testing a support line, as the analyst has highlighted in the chart:
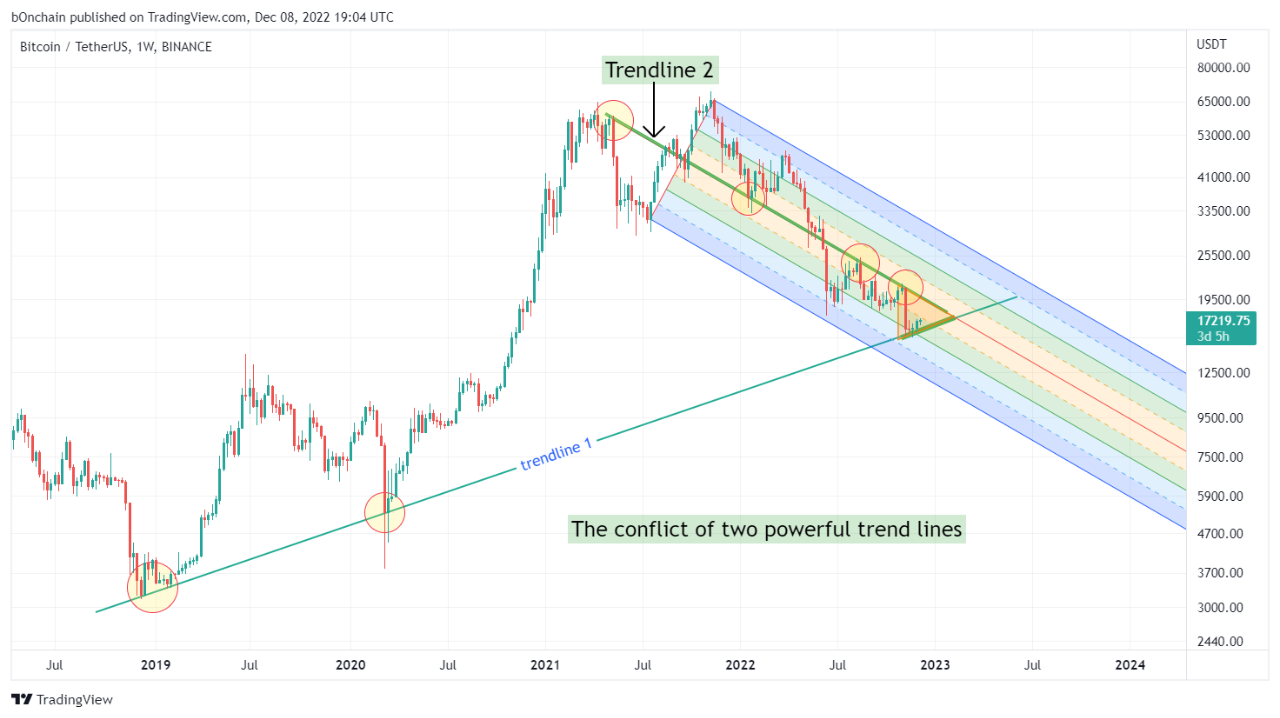
In the past year or so, Bitcoin has shown to be highly correlated with the stock market. The reason behind this correlation has been the rise of institutional investors in the crypto who treat it like a risk asset.
The quant believes that if the current support retest in the stock market proves to be successful, then BTC could also be expected to see a reversal of its own due to its correlation with the stocks.
At the time of writing, Bitcoin’s price floats around $17.2k, up 1% in the last week. Over the past month, the crypto has lost 7% in value.
Below is a chart that shows the trend in the price of the coin over the last five days.

Data shows while Bitcoin has been correlated with the US stock market for some time now, the two haven’t moved in tandem recently.
As pointed out by an analyst in a CryptoQuant post, BTC has gone down in the past week while stocks have made some gains.
A “correlation” between two assets (or markets) exists when both their prices follow the same general trend over a period of time.
For Bitcoin, there has been a strong correlation with the US stock market during the last couple of years or so. The reason behind the markets becoming so tied is the rise of institutional investors in the crypto.
Such investors view BTC as a risk asset and pull out of the coin as soon as there is macro uncertainty looming over the market (hence driving the crypto’s price down along with the stocks).
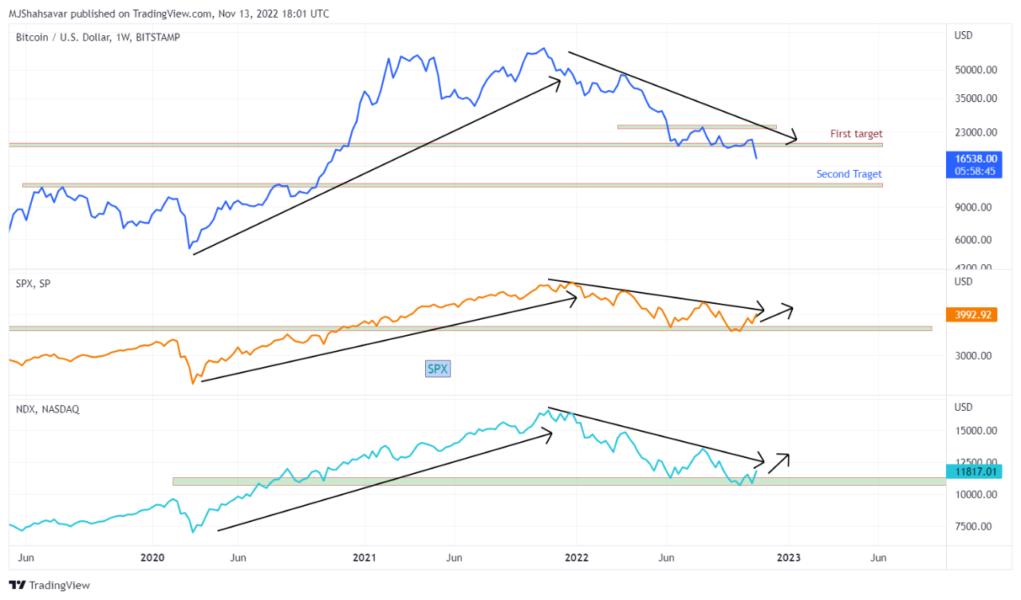
Here is a chart that shows the prices of Bitcoin, S&P 500, and NASDAQ over the last few years:

Looks like the assets have followed similar trends in recent times | Source: CryptoQuant
As you can see in the above graph, Bitcoin wasn’t correlated with the stock market in 2019 and early 2020, but it all changed when COVID struck.
After the black swan crash that occurred in March 2020, the price of BTC started following S&P 500 and NASDAQ.
Though, while BTC showed a same general long-term trend, the crypto continued to be much more highly volatile than the stocks.
The correlation has continued through the bear market, but the last week or so has turned out different.
While the US stock market has seen some uplift in the past 7 days, Bitcoin has instead taken a sharp plummet.
These markets showing different behavior recently could suggest the correlation between them may be reducing.
With the latest plunge, BTC has also lost the support line of the previous all-time high, something that has never happened in the previous cycles.
The quant in the post notes that this recent trend is a sign of weakness in the crypto market, which could lead to further downtrend in the near future.
At the time of writing, Bitcoin’s price floats around $16.5k, down 20% in the last week. Over the past month, the crypto has lost 15% in value.
The below chart shows the trend in the price of the coin over the last five days.

The value of the crypto seems to have remained below $17k in recent days | Source: BTCUSD on TradingView
Featured image from André François McKenzie on Unsplash.com, charts from TradingView.com, CryptoQuant.com

The world is upside down. Is bitcoin stable now? Or is everything else extremely volatile all of a sudden? As the planet descends into chaos, bitcoin remains in a weird limbo that’s uncharacteristic of the asset and doesn’t seem to end. That’s both what it feels like and what the stats say. In the latest ARK Invest’s The Bitcoin Monthly report, they put it like this, “bitcoin finds itself in a tug of war between oversold on-chain conditions and a chaotic macro environment.”
What about the numbers, though? The stats support the thesis, “for the third month in a row, bitcoin continues to trade between support at its investor cost basis ($18,814) and resistance at its 200- week moving average ($23,460).” Three months in that range seems like too much. Something’s got to give. However, that’s what everyone’s been thinking for the last few months and we’re still here.
Bitcoin has been less-volatile than usual, sure, but the main factor here is that the whole world is falling to pieces. Every company is in the red, especially techy ones, and all of the world’s currencies except the dollar fell off a cliff. Are we seeing “the dollar milkshake theory” playing out in front of our own eyes? It sure feels that way. Global central banks have been printing bills like there’s no tomorrow, and that extra liquidity is there for the stronger currency to take.
According to professional investor Darren Winter, the “dollar milkshake theory views central bank liquidity as the milkshake and when Fed’s policy transitions from easing to tightening they are exchanging a metaphoric syringe for a big straw sucking liquidity from global markets.” If that’s what we’re seeing, what happens next? Back to The Bitcoin Monthly, ARK says:
“As macro uncertainty and USD strength have increased, foreign currency pairs have been impacted negatively while bitcoin has been relatively stable. Bitcoin’s 30-day realized volatility is nearly equivalent to that of the GBP and EUR for the first time since October 2016”

BTC price chart for 11/07/2022 on Bitstamp | Source: BTC/USD on TradingView.com
The macro-environment has been so bad lately, that there’s the perception that bitcoin has been doing better than stocks. The facts are that, for the first time since 2020, “bitcoin’s 30-day volatility is on par with the Nasdaq’s and the S&P 500’s.” And, we know past performance doesn’t guarantee future results, but “the last time bitcoin’s volatility declined and equaled the rising volatility of equitiy indices was in late 2018 and early 2019, preceding bullish moves in the BTC price.”
However, let’s not kid ourselves, bitcoin has not been doing good. The thing is, not much is prospering out there. Especially in the tech sector. “The price drawdowns from alltime high in Meta (-75.87%) and Netflix (-76.38) have exceeded that of bitcoin’s (-74.46%). To a lesser extent, Amazon also suggests a correction proportional to that of BTC’s “usual” volatility (-48.05%).”
According to The Bitcoin Monthly, the situation “suggests the severity of the macroeconomic environment and bitcoin’s resilience against it.”
The only constant is change, however. Bitcoin’s stability suggests a violent breakout, either up or down. The entire world can’t remain the red forever, something or someone has got to rise above the crowd and show everyone how it’s done. We’ve been waiting for a resolution for what feels like ages, and we’ll probably have to wait some more. There will be a movement, though. When we least expect it, probably.
Featured Image: Bitcoin 3D logo from The Bitcoin Monthly | Charts by TradingView


The company’s financial statements showed a decline in operating revenue and income due to the crypto bear market.


Despite delisting VBB, Valkyrie still continues to manage the Bitcoin Strategy ETF and its Bitcoin futures ETF and the Valkyrie Bitcoin Miners ETF.

The Middle East, one of the world’s fastest-growing crypto markets, now offers a new opportunity for direct investment in Bitcoin through the 21Shares Bitcoin ETP.


