
Google’s BigQuery added 11 new public datasets for blockchain networks, allowing users to obtain a variety of data from these networks.
Cryptocurrency Financial News
Google’s BigQuery added 11 new public datasets for blockchain networks, allowing users to obtain a variety of data from these networks.
Google’s cloud-computing business has stored historical data on Bitcoin since 2018, claiming the service provides faster access than can be obtained directly from the blockchain.

Bitcoin and the major altcoins are down from their weekly highs, but the bulls are trying to form a higher bottom, indicating buying on dips.
Polkadot’s DOT is recovering higher from the $3.92 support against the US Dollar. The price could gain pace if it clears the $4.20 and $4.35 resistance levels.
After a sharp decline, DOT price found support near the $3.90 zone. A low is formed near $3.91 and the price is now attempting a fresh increase, like Bitcoin and Ethereum.
There was a break above the $4.00 and $4.05 resistance levels. The price surpassed the 23.6% Fib retracement level of the downward move from the $4.80 swing high to the $3.91 low. DOT is now trading just above the $4.15 zone and the 100 simple moving average (4 hours).
Immediate resistance is near the $4.20 level. There is also a key bearish trend line forming with resistance near $4.175 on the 4-hour chart of the DOT/USD pair.
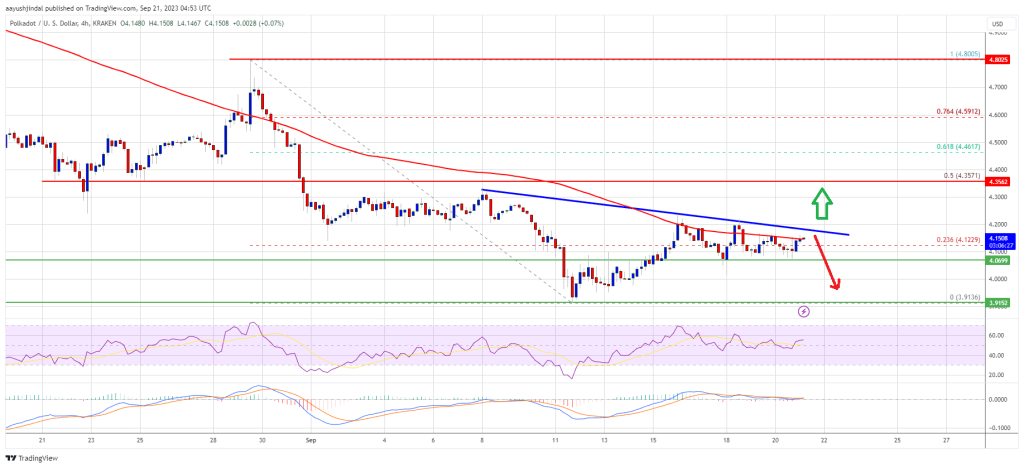
Source: DOTUSD on TradingView.com
The next major resistance is near $4.35. It is near the 50% Fib retracement level of the downward move from the $4.80 swing high to the $3.91 low. A successful break above $4.35 could start a strong rally. In the stated case, the price could easily rally toward $4.80 in the coming days. The next major resistance is seen near the $5.0 zone.
If DOT price fails to continue higher above $4.20 or $4.35, it could start another decline. The first key support is near the $4.05 level.
The next major support is near the $3.90 level and the last low, below which the price might decline to $3.75. Any more losses may perhaps open the doors for a move toward the $3.50 support zone.
Technical Indicators
4-Hours MACD – The MACD for DOT/USD is now gaining momentum in the bullish zone.
4-Hours RSI (Relative Strength Index) – The RSI for DOT/USD is now above the 50 level.
Major Support Levels – $4.05, $3.90 and $3.75.
Major Resistance Levels – $4.20, $4.35, and $4.80.

Bitcoin and other cryptocurrencies are likely to witness a pick up in volatility following the Fed’s rate decision on Sep. 20.

Polkadot USDC users should not deposit XCM-transferred USDC from non-Polkadot Asset Hub parachains, Circle has warned.

The recovery in Bitcoin and altcoins is facing selling at higher levels, indicating that the overall sentiment remains negative.
The company plans to provide custody for the Polkadot ecosystem, offering digital asset storage services for financial institutions

Bitcoin remains stuck in a range, but certain altcoins are showing signs of breaking down in the near term.

Polkadot 2.0 will bring a range of new features and is set to change how the Polkadot network works.

Bitcoin and several major altcoins continue to show weakness, but a few data points do favor bulls in the short-term.

Bitcoin and most altcoins gave back the entirety of their gains shortly after the SEC decided to delay issuing a decision on all of the recently filed spot Bitcoin ETF applications.
Polkadot (DOT), the innovative cryptocurrency known for its interoperability-focused blockchain platform, displayed a surge in buying pressure, indicating a potential short-term bullish trend. Despite this optimism, cautious conditions still prevail for prospective buyers in the volatile crypto landscape.
While DOT faced a 2.1% slump in the past 24 hours and a marginal 0.2% decline over the past week, its overall outlook remains influenced by both market dynamics and broader technological advancements.
Undoubtedly, Polkadot’s performance in the crypto market has been buoyed by widespread innovation and increased adoption. Currently priced at $4.50 according to CoinGecko, the coin’s value reflects not just its market position but also its underlying technological progress.
Santiment, a reputable on-chain data firm, recently unveiled that the Polkadot project has exhibited robust development activity throughout 2023. Impressively, it secured a place among the top three projects with the highest GitHub submissions, signaling a thriving developer community and continuous improvements.
Throughout 2023, #Polkadot & #Kusama shared the honors for most #github development in #crypto according to our calculations for notable activity. However, #Cardano has finally outpaced them. Read more about how @santimentfeed tracks dev. activity here: https://t.co/vWQCE4a1nv pic.twitter.com/6KBUNf0BIt
— Santiment (@santimentfeed) August 21, 2023
The Polkadot Deep Dive report emphasized pivotal advancements in its staking mechanism. Features like the fast unstake mechanism have bolstered adoption rates, streamlining the user experience and increasing engagement. This progress showcases Polkadot’s dedication to refining its ecosystem and addressing user concerns.
A detailed analysis of the 1-day chart unveils crucial support and resistance zones. The $4.5 region emerges as a bullish order block, instilling optimism for potential price gains. Conversely, the $5.5 area stands out as a bearish order block, suggesting a level where selling pressure might intensify as August ends.
These distinct zones imply a potential trading range for DOT in the coming weeks, presenting both opportunities and challenges for traders and investors alike.
Zooming into lower timeframe charts provides further insights. A notable market structure break occurred on Monday, as DOT managed to surpass the recent lower high at $4.56.
Notably, this break coincided with the higher timeframe order block, enhancing the likelihood of bullish momentum driving prices upwards.
Yes, $DOT it has broken a very strong volume resistance and has also risen with vulumen to see if it holds and if it does not lose the broken resistance is a very good sign of continued rise pic.twitter.com/hNn9alSC87
— Tony ₿itcoin
(@Toni_Bitcoin) August 28, 2023
Esteemed crypto trader Toni Bitcoin also weighed in on the situation, highlighting DOT’s breach of a significant volume resistance barrier. The key now lies in the coin’s ability to maintain the $4.57 price level.
Should this support hold, a strong bullish continuation could unfold in the ensuing days, potentially reshaping the short-term trajectory for Polkadot.
Navigating Volatility With Caution And Optimism
The recent surge in buying pressure and the ongoing development activity signify a potential short-term bullish trend for DOT. However, the inherent risks within the crypto sphere remind us that market dynamics can swiftly shift, underscoring the importance of informed decision-making and risk management strategies.
(This site’s content should not be construed as investment advice. Investing involves risk. When you invest, your capital is subject to risk).
Featured image from Marine Corps Times

Bitcoin and altcoins are struggling to hold the gains accrued earlier this week, a potential sign that the price breakout was just a response to Grayscale’s victory over the SEC.

The S&P 500 is attempting a recovery, but Bitcoin and select altcoins are struggling to break above their respective resistance levels.

Bitcoin and altcoins lose more ground after comments from the Federal Reserve suggest that the regime of interest rate hikes could continue into 2024.

Bitcoin and altcoins perked up today, but is this rally nothing more than an oversold bounce?

Bitcoin and select altcoins are starting to recover, but selling at the top of each price breakout suggests that bears remain in control.

Bitcoin and most major altcoins are reeling under intense selling and charts suggest that the market sell-off is not complete.

Markets continue to slump, giving advantage to the bears and hinting at a trend change to the downside.


