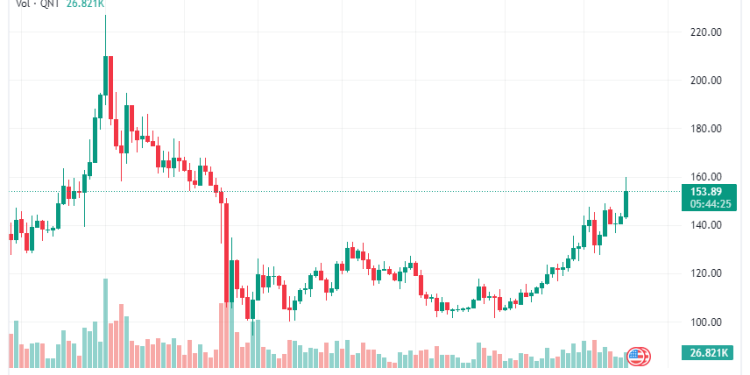
Like most cryptocurrencies, Quant (QNT) has witnessed a considerable price rally over the past weeks. The token has added more than 8.24% over the past 24 hours.
Even the broader cryptocurrency market has recently seen tremendous improvement in its prices. Reports revealed that the cryptocurrency market outperformed the traditional equity market.
QNT saw a 14-day gain of 26.8% and a 7-day price surge of 7.58%. These performances could be credited to improving economic conditions and recent improvements on the Quant Network.
What Factors Could Be Driving Quant Price Up?
Quant Network is an interoperability-enabling platform launched to connect several blockchains effectively. The Quant token price often moves in response to changes in the U.S. economy.
For example, the Consumer Price Index (CPI) for December at 6.5% showed a value in line with market expectations. CPI is a metric in the United States that measures inflation. A higher CPI signifies high inflation, while a lower value indicates a reduction. The crypto market had positive sentiments before the CPI release, which boosted the sector, including QNT.
Over the past weeks, Quant showed signs of a breakout from the descending channel. A movement above the descending channel often indicates a potential breakout, which drives the price upwards. This trend could also be one of the factors influencing Quant’s rally.
Data indicates that Quant might have seen a double-bottom on the daily time frame while the cryptocurrency broke out of a channel that pushed the price action upwards.
Also, Quant oscillators and the 7-day Moving Average is currently showing a strong buy. It could be among the factors driving QNT’s price upwards. Also, the fear and greed index is showing neutral.
Latest developments on the Quant Network could also be among the factors driving the asset price upwards. The Quant Network designs secure bridges for asset transfer. Bridges are networks used for asset transfer from one network to another. But it is common knowledge that bridges are usually susceptible to hack attacks.

Quant Price Predictions, will it Continue Soaring?
QNT is currently trading at $154.91. The coin is above its 50-day and 200-day Simple Moving Average (SMA). The formation of a golden cross in the coming weeks is likely if the 50-day SMA crosses over the 200-day SMA.
Quant’s support levels are $137.30, $139.09, and $141.27. It has broken its resistance levels at $145.24, $147.02, and $149.21. The token is currently under bullish pressure. A new resistance will form at the $164.67 level, with the old resistance levels turning to support. The formation of a long green candle today shows the bulls have controlled most of the trading activity.
Quant’s Relative Strength Index (RSI) reading is 72.97, which is in the overbought region. That is also a bullish signal. The MACD (Moving Average Convergence/Divergence) is now above the signal line showing positive readings. Expect the positive trend to sustain for a few more weeks. Although the token might record a slight price correction, it will remain bullish for the short term.
Please note that altcoins are relatively volatile and might deviate from a predicted trend. Also, an altcoin that loses half its value must recover 100% to return to its original price. However, they provide opportunities for traders who love volatile markets to profit with proper risk management techniques.


