Crypto Analyst Optimistic About A Shiba Inu Short-Term Surge To $0.000066

Shiba Inu (SHIB) has displayed immense momentum lately standing out as one of the best-performing meme coins in light of the general optimism that took over the cryptocurrency market in the last week.

Shiba Inu To $0.000066 Could Be Possible In A Short Time

With the price of Shiba Inu rallying in the past few days, the crypto asset has garnered significant attention from investors as several experts predict a rise to new yearly highs.

In the same vein, cryptocurrency analyst and investor Rekt Capital has shared his optimistic prediction for Shiba Inu with the crypto community on the social media platform X (formerly Twitter), fueling hope of notable gains in the short term.

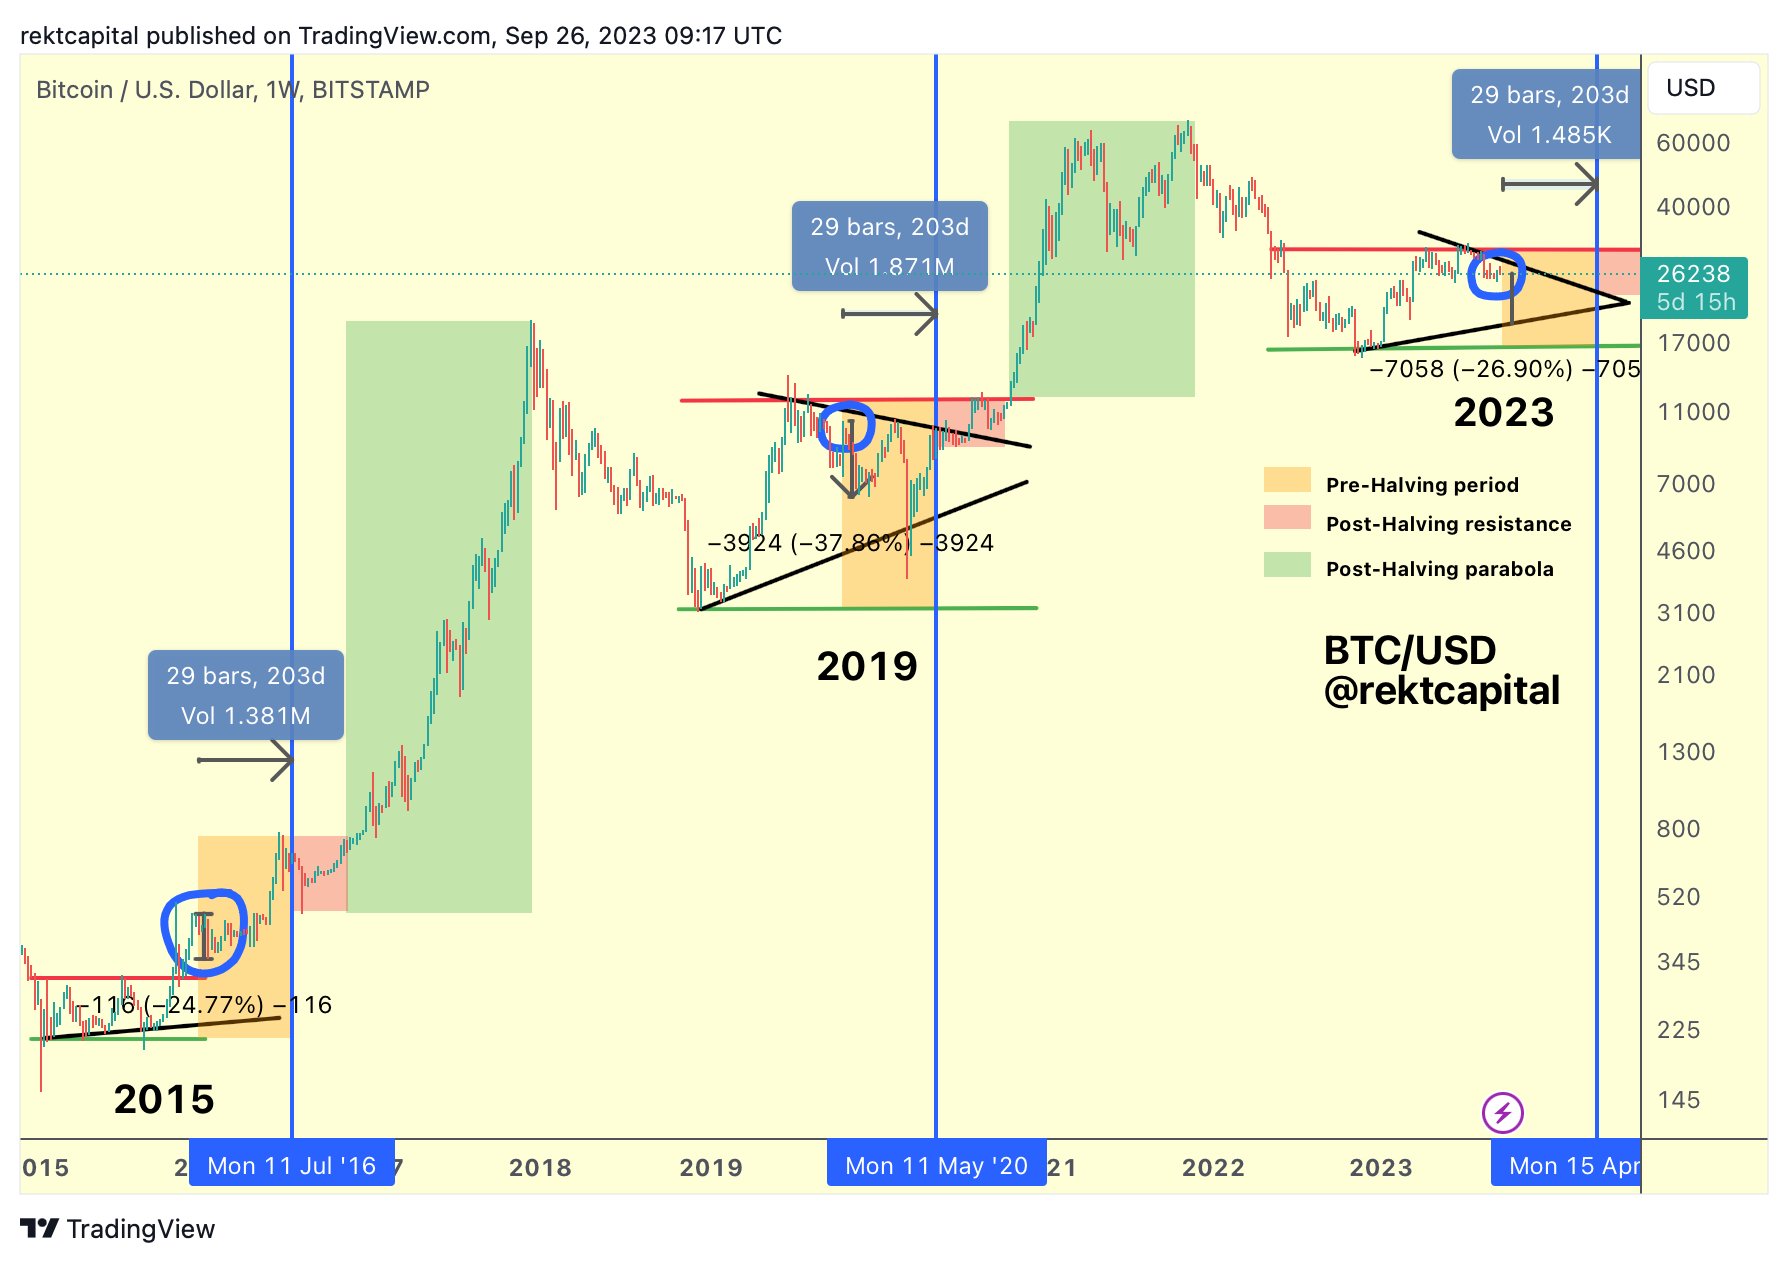
Rekt Capital’s analysis underlines the digital asset’s potential to soar higher to a level not seen for more than 2 years. The crypto analyst pointed out that SHIB arrived at a resistance he dubbed “Black Resistance,” which it previously rejected.

Shiba Inu

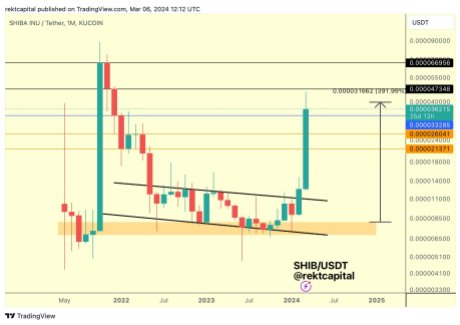
As a result, the meme coin must now “maintain the blue level” indicated in his chart as fresh support in order to create a “new Re-Accumulation Range at the highs possibly.” Due to this, the expert expects Shiba Inu to rise to the $0.000066 price level shortly.

The post read:

Shiba Inu Reached the black resistance which SHIB rejected from. Now SHIB needs to hold this blue level as new support to potentially develop a new Re-Accumulation Range at the highs.

Rekt Capital also highlighted another of his earlier forecasts, in which he projected the coin to reach the aforementioned price mark. At first, Rekt Capital noted that the asset had reached the blue resistance point.

Furthermore, he asserted that SHIB has increased by over 300%, since the initial post from November last year. In the post, the analyst claimed that SHIB regained the Orange area’s top as a support.

Consequently, SHIB ought to be able to return to the pinnacle of its “black market structure over time.” However, he presently anticipates Shiba Inu to undergo a rally after it concludes its “Macro U-shaped reversal.” 

SHIB Anticipated For A Potential Rebound

Amid the recent bearish sentiment around the market, Santiment – a crypto analytics platform, has identified SHIB as one of the leading assets that is poised for a potential recovery.

Data from Santiment shows that SHIB and dogwifhat (WIF) are the major coins expected by traders to undergo a rebound. This comes after the wild day that saw Bitcoin reach a new peak before markets went into a “reset mode.”

Santiment has also underscored a “speculative bullishness” for Solana (SOL) lately. This is a result of the speculation surrounding Solana’s potential to reach the $1,000 threshold.

SHIB at the time of writing was trading at $0.00003155, indicating a drop of 13% in the past day. Meanwhile, its market cap and trading volume are both down by 13% and 62% respectively.

Shiba Inu

Crypto Analyst Predicts Potential Trend For Bitcoin As Price Slips

Rekt Capital, a well-known cryptocurrency analyst and enthusiast, has revealed the potential directions that the price of Bitcoin could take in light of the upcoming fourth BTC Halving.

Potential Retracement For Bitcoin

With the halving event approaching, analysts are debating what steps Bitcoin should take after its recent breach from the macro downtrend. One of those is Rekt Capital, who has weighed in on the particular issue and made a comparison to past trends.

The crypto analyst shared his latest projections during one of his YouTube predictions videos for Bitcoin. In the video, Rekt Capital delves in on the “next possible steps” that BTC is anticipated to take while highlighting “a breakout from its macro downtrend.”

Bitcoin

His analysis focuses mainly on the reaccumulation range that formed prior to the halving event in 2015-1016 period. He further drew a comparison between 2023-2024 and 2015-2016, while noting similarities between the two periods.

According to him, the trend that formed within that period has resurfaced in the current 2023-2024 period. “One of the things that contributes to that similarity is the reaccumulation that formed a few months before the halving,” he stated.

Rekt Capital pointed out the possibility of a retracement around the Bitcoin halving event. This is due to a scenario proposed by the crypto analyst in which a reaccumulation range break triggers a retreat.

An analogy to the cycle of 2015–2016 indicates a comparable rejection from a resistance level prior to the halving, which may have contributed to a possible retreat.

Furthermore, he has highlighted that such retracements are indicated by historical data but stresses that they are often brief. However, he asserted that after the retrace, which is the “last opportunity,” we would see a price increase for Bitcoin.

This surge will “turn the $46,000 price level into a new support level, and move to touch its old all-time high.” Rekt Capital also anticipates the price going beyond this level putting Bitcoin on a path to a new all-time high.

Factors The Buttress BTC Value, ETFs Not Included

Samson Mow, the Chief Executive Officer (CEO) of Pixelmatic, has revealed several factors that boost Bitcoin’s value. Mow took to X (formerly Twitter) to underscore these factors with the crypto community.

According to him, the value of Bitcoin is amplified by “scarcity, utility, and the failure of fiat.” Mow further insisted that BTC Spot Exchange-Traded Funds (ETFs) do not contribute to the token’s value.

His X post came in response to CNBC’s “Mad Money” host Jim Cramer’s post over his comments on BTC’s current action. Cramer asserted that “no one showed up” after the approval of BTC ETFs, which led to a decline in price.

Mow was displeased by Cramer’s claims, and he stated that many people were present while noting the net inflow. “A lot of people showed up. Just look at the net inflow and how much BlackRock, Fidelity, and others accumulated,” he stated.

Bitcoin

Dogecoin Poised For A Deep Pullback After Failing To Hold Key Resistance, Analyst

Following a futile fight to break the $0.07 resistance, Dogecoin (DOGE) appears poised for a big drop. This was a warning in an October 31 X post by prominent crypto analyst Rekt Capital to his nearly 400,000 followers.

According to the analyst, despite its notable rally last week, DOGE failed to break its diagonal resistance, which resisted its ascent for several months. As a result of this failure, DogeCoin’s price might decline significantly soon.

Rekt Capital Analysis: DogeCoin’s Complex Weekly Close Below Resistance

From Rekt Capital’s analytic chart, Dogecoin (DOGE) has had a tricky week. It recorded notable upswings but closed below a significant resistance level at the price channel top. The analyst marked the meme coin’s closing price with a circle, as seen on the chart below. 

This setup suggests that DOGE’s anticipated big upswing might encounter delays, the analyst said in the Twitter post. He added that, in the past, when this has happened, DogeCoin’s price declined significantly.

This means that the DOGE breakout is postponed. Previous weekly closes like this -> downside, Rekt Capital remarked.

However, despite the high likelihood of a decline, the analyst believes there’s hope for DOGE. Rekt said, “If DOGE can hold the highs and reclaim the channel top as support – there may still be a chance.”

Based on Rekt’s chart, to confirm a bullish trend, the DOGE $0.07 resistance needs to change to a support level on the weekly timeframe.

Rekt's chart

Ali Martinez’s Bullish Analysis: Dogecoin’s Promising Breakout

Recently, another crypto expert, Ali Martinez, made an optimistic prediction about Dogecoin. The analyst shared a chart on the X platform showing that the meme coin has broken out of a long-term pattern. According to Martinez, this happened when the overall cryptocurrency market trend shifted upwards.

@ali_charts

Also, Martinez highlighted that a special TD Sequential indicator gives a BUY signal on DOGE. According to the analyst, this signal strengthens the positive outlook for the cryptocurrency. In context, this indicator helps traders figure out if an asset’s price might change direction.

Meanwhile, Dogecoin has formed two consecutive bullish higher-high candles on the weekly chart. The setup confirms that DOGE indeed broke free from the previous pattern. 

In line with Rekt’s analysis, if the market keeps up this pace, the price could increase significantly. As of the time of writing, DOGE is trading at $0.0665; the coin is down by almost 4% in the past 24 hours. However, over the last seven days, Dogecoin has gained more than 1%, with a 12% 14-day increase.

Bitcoin Price Trend At Stake: How September’s Close Could Change Everything

Renowned crypto analyst Rekt Capital has recently highlighted the pivotal nature of the Bitcoin price’s imminent monthly candle close. In a statement via X (formerly Twitter), he detailed that Bitcoin has tagged the $27,000 monthly level from the underside, meaning it is acting as resistance for the time being.

He explained that “the upcoming monthly candle close is just around the corner. Bitcoin needs to monthly close above $27,091 for this to be a fake-breakdown. Otherwise, the breakdown will be technically confirmed.”

To give this statement some historical context, the preceding month – August – saw a significant development for the flagship cryptocurrency. BTC registered a bearish monthly candle close, finishing below approximately $27,150. This data point, according to Rekt Capital, effectively confirmed it as lost support.

Reflecting on this development at the time, the analyst had conveyed that it is possible BTC could surge to $27,150, “maybe even upside wick beyond it this September. But that would likely be a relief rally to confirm $27150 as new resistance before dropping into the ~$23000 region. $23000 is the next major Monthly support now that ~$27150 has been lost.”

Bitcoin price analysis

Is Bitcoin Following Historical Patterns?

Rekt Capital’s observations about Bitcoin aren’t made in isolation but are deeply rooted in Bitcoin’s historical price and cycle behaviors. Drawing parallels to previous patterns, he had previously shed light on Bitcoin’s tendencies around 200 days before a halving event.

“At this same point in the cycle (~200 days before the halving): In 2015, Bitcoin retraced -24% within a re-accumulation range, but price consolidated for months going into the halving. In 2019, Bitcoin retraced -37% as part of a downtrend that continued for months going into the halving.”

These historical retracements at a similar juncture have given rise to two essential insights, as stated by Rekt Capital. First, an immediate retracement has occurred at this same point in the cycle. Second, a repeated retrace of between -24% to -37% in 2023 would lead Bitcoin to retest its macro higher low, possibly pushing its price under the $20,000 threshold.

Bitcoin historical pattern

The analyst didn’t stop there. Accentuating the ideal accumulation phases for investors, he noted, “The best time to accumulate Bitcoin was in late 2022 near the bear market bottom. The second best time to accumulate Bitcoin is upon a deeper retracement in the pre-halving period.”

Shifting the focus to potential future outcomes, Rekt Capital made an intriguing speculation about the potential of BTC’s price movement post-halving: “If ~$31000 was the top for 2023. Then the next time we see these prices will be months from now, just after the halving. Only difference between now and then? In this pre-halving period, BTC could still retrace from here. But after the halving, BTC would break out much higher from current prices.”

To summarize, the upcoming monthly candle close for Bitcoin could have profound implications for the asset’s short-to-mid-term trajectory. All eyes will now be on whether BTC manages to close above or below the critical $27,150 mark – an indicator that could either confirm a technical breakdown or prevail over a historically untypical price rally.

At press time, BTC stood at $26,687.

Bitcoin price

Chainlink: Analyst’s Vision Of A 20% Rally And How It Could Happen

Chainlink (LINK) has caught the attention of crypto analyst Rekt Capital, who has offered an optimistic outlook for LINK. In a new price prediction, he suggested that the decentralized oracle network is on the verge of a significant recovery.

Rekt Capital, a prominent figure in the crypto community, took to the social media platform X to share insights on Chainlink’s recent performance. According to the analyst, LINK has shown resilience by respecting its range-high resistance, a crucial milestone following its notable surge in price back in July. This achievement has ignited hopes of a sustained upward trajectory.

Despite its promising trajectory, LINK has experienced some fluctuations in recent weeks. The cryptocurrency dropped to a recent low of $5.76, a level that Rekt Capital points out as being close to the asset’s range-low support. 

However, Chainlink seems to be regaining its footing, with its current price sitting at $6.81 according to CoinGecko, marking a 1.2% increase in the last 24 hours and an impressive seven-day rally of 15.5%. These positive indicators have fueled anticipation within the crypto community.

A Bullish Prediction For Chainlink

Rekt Capital’s analysis doesn’t stop at the current price trends. The crypto analyst predicts that Chainlink “should be able to revisit the range-high resistance,” which is situated at around $8.186. If this prediction holds true, it would represent an additional 20.5% increase from the current price, promising further gains for LINK holders.

This price surge coincides with a notable uptick in Chainlink’s Relative Strength Index (RSI), which, as of the latest analysis, stands above 60. An RSI above 60 indicates a robust bullish trend in the market. 

Moreover, Chainlink’s price has climbed above the short-term Moving Average, previously acting as a resistance level. It is also approaching a position where it may surpass the long-term Moving Average, signaling potential for sustained upward movement.

Mysterious Wallet Activity

Intriguingly, recent wallet activity has garnered significant attention in the Chainlink ecosystem. Data from Lookonchain reveals that over 35 new LINK addresses were established just three days ago. These newly created addresses have started withdrawing LINK tokens from Binance (BNB), with a cumulative withdrawal exceeding 755,000 LINK tokens, valued at over $5 million.

The motive behind these substantial withdrawals remains undisclosed as of now, leaving room for speculation within the crypto community. Some analysts suggest that this activity might indicate a significant accumulation move by a whale investor, potentially adding another layer of intrigue to Chainlink’s evolving narrative.

As Chainlink continues to make strides in the crypto space, investors and enthusiasts will undoubtedly be closely monitoring its progress, hoping that Rekt Capital’s bullish predictions come to fruition. In the ever-volatile world of cryptocurrencies, the only certainty is that surprises are never far behind.

(This site’s content should not be construed as investment advice. Investing involves risk. When you invest, your capital is subject to risk).

Featured image from Vecteezy

Bitcoin May Hit $250,000, This Analyst Predicts An Incredible Price Surge

Because of its volatility, the Bitcoin market is a new market every day. The outcome is always surprising, no matter how well one predicts the future. This time, though, the situation appears to be a little different, since Bitcoin may have just verified top analysts’ notion. BTC’s price increased on the 4-hour chart, and it also performed well on other time frames.

The Wolf of All Streets Speaks

These were the thoughts of Scott Melker, called “The Wolf of All Streets”. He picked up the monthly chart in his most recent analysis video and brought up some fascinating observations. BTC first broke through the EQ line, or mid-line, on the monthly chart. From June 2019 to November 2020, the king coin had held its candles under the line for nearly 17 months. In December 2020, the currency broke over the line, and it is currently re-testing the line for support. Melker made a prediction about where the coin would go from here. Melker said:

“Even if it went next month to the top of the channel (the upper trend line), that’d be $158,000, a month later 168, 176 you see it takes a few months…That gets us to those 230, 250, 280 thousand targets”

Bitcoin monthly chart | Source: Scott Melker, TradingView

On the daily chart, BTC was breaking the mid-line of the descending channel. The coin has been actively pushing up and it managed to flip it into support. Moving forward resistance will be the 50 MA or the top of the channel as well.

Bitcoin daily chart | Source: Scott Melker, TradingView

The 4-hour chart, last but not least, showed a likely Wyckoff accumulation rise. The spring appears to be in place, and $36k should hold as support. As this appears to be a sweep of the lows at the present, such a movement may even drive Bitcoin up to $42,000.

Bitcoin 4-hour chart | Source: Scott Melker, TradingView

Related article | Plan B: The Next 6 Months Will Make Or Break Famed Bitcoin Model

Rekt Capital Supports Melker’s Prediction

Popular analyst Rekt Capital too supported this prediction. Recently he tweeted about Bitcoin’s movement keeping 50 WEMA in mind and how it could create a potential bull market as well.

With all of these potential protests, Congressman Bill Foster’s latest statement is concerning. He recently claimed that ransomware assaults, which are becoming more common, pose a danger to Bitcoin’s legal position. Foster added in a virtual event,

“I’m not there yet, but there’s significant sentiment in congress that if you’re participating in an anonymous crypto transaction that you are a de facto participant in a criminal conspiracy,”

Related article | Bull Signal From Bitcoin Bottom Is Best Hope Yet For Continuation