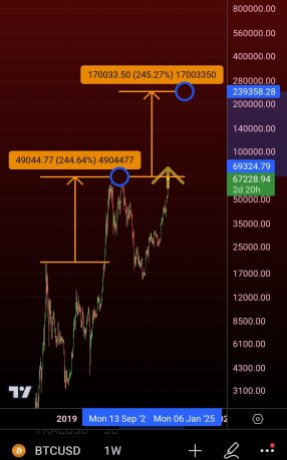
Bitcoin Propped For Major Breakout By September, Analyst Explains Why

Following the Bitcoin halving in April, analysts and investors remain on the edge of their seats in anticipation of a major price breakout by the maiden cryptocurrency. While Bitcoin did rise to $71,443 in the past week, the token soon suffered a retracement falling as low as $66,936.  Interestingly, renowned analyst with X handle Rekt Capital has provided an interesting insight into this recent price movement and also predicted the period BTC may finally embark on a highly-anticipated bullish run. 

Bitcoin To Consolidate For A Long Time – Analyst

In a series of X posts on May 24, Rekt Capital noted that after the halving event, Bitcoin entered the “post-halving danger zone”, a period during which the token lost about 11% of its value. Following this phase, the most-priced cryptocurrency attempted a breakout which encountered a rejection at the range high zone ($71,500) of the macro re-accumulation range.

For context, this range represents a long-term consolidation phase where Bitcoin accumulates value before potentially breaking out to new highs. Rekt Capital states that Bitcoin being rejected at the $71,500 price region is quite expected as BTC never breaks through the high side of the re-accumulation range on the first attempt after halving. 

Based on historical price data, Rekt Capital anticipates Bitcoin will now remain in consolidation for multiple weeks until 160 days after halving before finally experiencing its major price breakout in September. During this time, the premier cryptocurrency is expected to trade between $60,000 and $70,000 which will result in variations in the portfolio valuation for long-term investors. 

However, this price consolidation can also present opportunities for these investors to buy Bitcoin near the lower boundary of the range thus consistently accumulating at relatively stable prices. Meanwhile, short-term traders such as swing traders or day traders are likely to capitalize on these expected price fluctuations between an established support and resistance which could result in significant profit.

BTC Price Overview 

Bitcoin is currently trading at $68,720, marking a 2.27% gain in the last day, a 2.31% gain over the past week, and a 6.90% increase in the last month. Despite these gains, its daily trading volume has dropped by 45.68%, now valued at $24 billion. BTC is also 6.94% below its all-time high of $73,750. The recent price rise amid declining trading volume suggests cautious investor sentiment, with Bitcoin consolidating within a narrow range as the crypto market leader once again approaches significant resistance levels.

Bitcoin

Featured image from The Economic Times, chart from Tradingview

Analyst Narrows Down Timeline For Bitcoin Peak This Bull Cycle

Rekt Capital a popular cryptocurrency expert has set aside the potential timeline that Bitcoin, the largest crypto asset is expected to peak in the ongoing bull cycle, citing historical price trends. Rekt Capital’s analysis examines the current price action of Bitcoin and how it aligns with previous bull cycle peaks following the Bitcoin Halving event.

Bitcoin Peak On The Horizon

Today, May 9, BTC’s price witnessed a drop below the $61,000 price level, demonstrating a potential move on the downside. However, Rekt Capital is unshaken by this move as he believes the more Bitcoin consolidates between current price levels and $70,000 following the Halving, this cycle will slow down and resynchronize with its regular historically recurrent Halving cycle. As a result, given the price movements of past trends, he expects BTC to see a bull market top between the middle of September and October next year.

Furthermore, he noted that due to Bitcoin’s current two-month consolidation period, the present rate of cycle acceleration has dropped from 260 days to 210 days.

Bitcoin

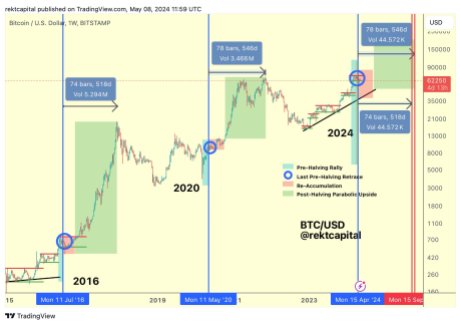
The analyst highlighted that about 518 days after the Halving in the 2015-2017 cycle, BTC reached its market peak. Meanwhile, in the 2019-2021 bull cycle, it took the digital asset approximately 546 days after the Halving to top out.

Thus, in the event that BTC reiterates these trends and the next bull market top takes place between 518 and 546 days post-Halving event, Bitcoin’s peak this cycle might occur during the aforementioned timeframes. This is the reason why the expert is confident that the more time Bitcoin takes to stabilize, the better off it will be for bringing this cycle back in alignment with the customary Halving cycle.

Possible Retracement Before An Uptrend

While the analyst anticipates BTC to experience a retrace large enough to persuade investors that the bull market is over, he urges investors not to be shaken out as it will turn around eventually to resume its upward movement. According to Rekt Capital, fortunate investors understand that there are moments to panic and moments to accumulate and that the two often go hand in hand.

Currently, the price of Bitcoin is moving on the downside after a slight recovery on Wednesday. BTC’s price has now fallen close to $60,700 as it was unable to break above $65,500 once more.

Related Reading: Bitcoin Peak Pre-Halving Doesn’t Guarantee Further Gains: Analyst

At the time of writing, the digital asset in the weekly timeframe is demonstrating a positive momentum, while in the daily timeframe, it is trending on the downside. In the past week, BTC has increased by over 4% and has decreased by about 2.29% in the past day, trading at $60,860.

Both the trading volume and market cap are also down by 2.45% and 2.20% respectively in the last 24 hours.

Bitcoin

Bitcoin Repeating Bull Cycle Trend From 8 Years Back: Analyst

Well-known cryptocurrency analyst and trader Rekt Capital has revealed an intriguing finding regarding Bitcoin’s price trend in a recent analysis. His ground-breaking prognosis reveals that the crypto asset is mirroring historical price action that took place during a bull cycle eight years ago.

Similar Historical Price Tendency In Bitcoin

Rekt Capital asserted that the way Bitcoin is reiterating a past price trend from a cycle 8 years ago is amazing. Given the magnitude of the 2016 bull cycle, BTC could be poised for significant growth in the upcoming months. During the 2016 bull cycle, BTC witnessed a notable growth of nearly 3,000%, following the conclusion of the Bitcoin Halving event

Moving on, Rekt Capital drew attention to his previous post regarding Bitcoin’s post-Halving movement, which he dubbed the Post-Halving Danger Zone. According to the analyst, the digital asset is currently caught up in this zone.

Bitcoin

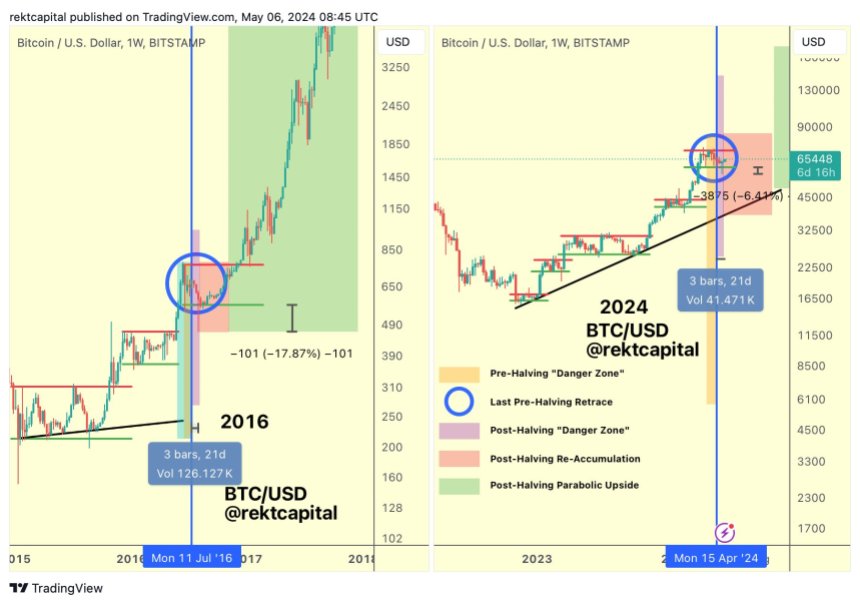
He further noted that Bitcoin has veered to the negative below the current Re-Accumulation Range Low, repeating the pattern that began in 2016. In 2016, the move below the re-accumulation range was about 17%. However, this divergence in 2024 is down by 6%.

Rekt Capital previously affirms in 2016, about 21 days after the Halving, Bitcoin saw a lengthy -11% decline before transitioning toward the upside.

Thus, if there should be downside volatility in this cycle around the Re-Accumulation Range Low, 2016 data indicates that BTC could turn to the upside in the next 10 days, considering the post time.

Even though the Post-Halving “Danger Zone” ends in the upcoming days, particularly four days from now, Rekt Capital stated that 2016 data proves that there may be some negative volatility at the $60,600 Range Low in the interim. 

Pre-Halving Danger Zone For BTC

Notably, the expert also identified a Danger Zone before the event, where previous Pre-Halving retraces have always started. According to Rekt Capital, pre-Halving retracements have historically been seen in Bitcoin between 14 and 28 days before the event, and this cycle hasn’t been any different thus far.

He stated that Bitcoin saw its first pre-Halving retrace of -18% about 30 days before the Halving, while in 2016, the pre-Halving retrace started 28 days before the event, suggesting BTC could move in the same direction as that of 2016. Due to this, Rekt Capital is confident that a potential danger zone could occur after Halving.

However, the retracement from the current all-time high has now proven to be deeper and longer than past retracements, spanning several weeks. Consequently, the expert predicted a high probability that Bitcoin prices may have reached a bottom.

At the time of writing, the price of Bitcoin was seeing a positive sentiment, rising by 0.43% to $64,126 in the past day. Both its market cap and trading volume have increased by 0.50% and 24.43%, respectively, in the last 24 hours.

Bitcoin

Bitcoin Déjà Vu: Analyst Identifies Trends Reflecting 2016 Cycle

Cryptocurrency analyst Rekt Capital has come up with an intriguing narrative pointing to several trends in the current price action of Bitcoin that are similar to the price trends seen in the 2016 bull cycle, even as market sentiments continue to dwindle. 

Bitcoin Trends Reiterating 2016 Pattern

According to Rekt Capital, more than a month after the initial analysis, Bitcoin keeps demonstrating how much it closely resembles the cycle of 2016. Similar to 2016, Bitcoin has experienced further declines over the past three weeks following the Halving below the Range Low of its Re-Accumulation Range also known as the Post-Halving Danger Zone

The post read:

Over a month later Bitcoin continues to prove how it is more similar to the 2016 cycle. Just like in 2016, Bitcoin in this cycle is seeing additional downside below the Range Low of its Re-Accumulation Range in the three-week window after the Halving (i.e. Post-Halving “Danger Zone”).

Given that Rekt Capital already addressed the concept of the Post-Halving Danger Zone, the analyst is not shocked by this current price decrease. During the 2016 cycle, about 21 days after the Halving event, BTC saw a lengthy decline of 11% before transitioning toward an upward direction.

Bitcoin

It is worth noting that Rekt Capital noted that if downside volatility around the Re-Accumulation Range Low is going to happen in this cycle, 2016 history indicates it may happen during the 15 days following the Halving. Since the recent event was concluded about 12 days ago, the expert’s prediction could be realized in the upcoming days.

Related Reading: Bitcoin Enters ‘Danger Zone’ Post-Halving, Analyst Warns Of Potential Downside

While the Post-Halving “Danger Zone” ends in 15 days, 2016 data suggests that there may be some negative volatility in the interim, possibly reaching the $60600 Range Low.

Drawing attention to previous patterns, Rekt Capital highlighted a similar pattern between the 2016 and 2024 pre-Halving re-accumulation range. After a breakout from the re-accumulation range this year, BTC witnessed a Pre-Halving rally, as was observed in 2016.

Pre-Halving Retrace Movement

Just like in 2016, once the pre-Halving rally peaked, Bitcoin started its Pre-Halving retrace. Specifically, this occurred roughly 28 days prior to the Halving event in both 2016 and 2024.

A negative wick on the weekly candle indicates a significant reaction in the first week of the pre-Halving Retrace in 2016. However, this reaction was fleeting and came before an extended price decline.

This cycle likewise saw a strong early reaction from Bitcoin via a downward wick, but there are indications that this reaction might not have lasted long. Thus, to avoid a fate similar to that of 2016, Rekt Capital believes that BTC will need to maintain highs around $60,000 and beyond.

Bitcoin

Bitcoin Long-Term Outlook: Analyst Foresees Peak In Late 2025

Following the fourth Bitcoin Halving, Rekt Capital, a popular cryptocurrency trader and expert, has offered a compelling narrative on the future trajectory of Bitcoin, predicting that the crypto asset could peak this bull cycle in the following year. Rekt Capital’s analysis emphasizes on the possibility that this current cycle could reiterate past Halving cycle trends, positioning BTC for significant gains in the coming months.

Bitcoin Could Mirror Past Halving Cycle

According to the analyst, Bitcoin reached its all-time high within 518 days following the Halving in the 2015–2017 cycle. Meanwhile, after the event in the 2019-2021 bull cycle, the digital asset topped out within 546 days. This suggests that the event has always catalyzed massive growth for the leading cryptocurrency asset.

Should the past trend hold, the next bull market top might happen between 518 and 546 days following the recently concluded fourth Halving, particularly around the middle of September or middle of October in 2025, according to Rekt Capital.

The analyst noted that in this cycle Bitcoin is accelerating by about 220 days currently. Thus, the longer time BTC consolidates after this Halving, it will be better for resynchronizing this current cycle with the previous events cycle.

Bitcoin

Rekt Capital also noted that Bitcoin has experienced further declines in the three weeks after the Halving, according to historical data from 2016. He has labeled the period as the Post-Halving “Danger Zone,” this is where there is a chance of downside volatility at the range low of the Re-accumulation Range.

In 2016, approximately 21 days after the occurrence, Bitcoin saw a lengthy -11% decline before gaining momentum toward the upside. However, data for 2016 indicates that if there will be downside volatility in this cycle around the Re-Accumulation Range Low, it may happen during the following 15 days.

Although the post-Halving danger zone ends in 15 days, the 2016 data indicates that there may be some negative volatility in the interim, possibly reaching the $60,600 Range Low.

Parabolic Phase For BTC

It is worth noting that Rekt Capital anticipates a parabolic phase after the re-accumulation phase is concluded. During this stage, Bitcoin usually sees massive growth leading all the way up to a new all-time high.

In the previous Halvings, Bitcoin would historically consolidate in this Re-Accumulation Range for up to 150 days before ultimately entering a parabolic phase. Once BTC breaks out of this re-accumulation stage, Rekt Capital expects BTC to see a parabolic upside by September this year if it consolidates within the aforementioned timeframe.

At the time of writing, BTC was down by over 5% in the past 7 days and was trading at $62,504. Presently, its market cap is down by 1.53%, while its trading volume has increased by over 22% in the last 24 hours.

Bitcoin

Bitcoin Enters ‘Danger Zone’ Post-Halving, Analyst Warns Of Potential Downside

Following the halving event on April 19, the price of Bitcoin has displayed a puzzling performance. BTC initially gained nearly 10% to trade as high as $67,020 on April 24. However, in the last two days,  the digital asset’s price has declined by 6.49%, falling below the $63,000 price mark. 

As expected, such negative performance has drawn attention from investors and market speculators. In particular, renowned analyst with X handle Rekt Capital has provided a theory on Bitcoin’s price fall and perhaps an insight into the future price movements of the crypto market leader.

BTC Potential Price Decline Ahead?

In an X post on April 26, Rekt Capital stated that Bitcoin has now entered the Post-Halving “Danger Zone.” The analyst described this phenomenon as a period during which Bitcoin has historically experienced price corrections after the halving event. Rekt Capital noted that in 2016, Bitcoin recorded these price retraces in the three weeks following the Halving event. During this time, the token’s price declined by 11%. 

The analyst postulates that Bitcoin is now in the Post-Halving “Danger Zone” of the current bull cycle following its price fall over the last two days. It is worth stating that if Bitcoin mirrors past price movement in this phase, the token could be heading for $60,000. However, Rekt Capital states that if the crypto market leader experiences such a fate, it will be within the next two weeks. 

At the time of writing, Bitcoin trades around $62,672 with a decline of 2.44% in the last day. This price fall underscores BTC’s negative performance in the last month in which it has lost 11.16% of its market value. 

BitcoinBTC trades at $63,023 on the daily chart | Source: BTCUSD chart on Tradingview.com

Bitcoin ETFs Record Minor Inflow; Net Outflows Hit $217 Million

According to data from SoSoValue, the Bitcoin Spot ETF market recorded net outflows to the tune of $217 million on April 25. Unsurprisingly, Grayscale’s GBTC accounted for $138 million of these figures as its total outflows now approach $17 billion.

Notably, for the first time ever, Fidelity’s FBTC and Valkyrie’s BRRR  produced net outflows estimated at $22 million and $20 million, respectively. Meanwhile, ARK Invest’s ARKB and Bitwise’s BITB also experienced a loss in investment on Thursday.

Interestingly, all other Bitcoin Spot ETFs recorded zero net flows except Franklin Tempton’s EZBC, which saw a net inflow of $1.87 million. At the time of writing, the BTC spot ETFs have a combined value of $128 billion, reflecting a remarkable growth since their trading debut on January 11.

Bitcoin Halving RoadMap: Analyst Outlines 3 Phases For Market Dynamics

Bitcoin is now hovering around the $70,000 threshold after a notable recovery it witnessed a few days ago. Due to the recent momentum, crypto enthusiasts are becoming less pessimistic about the digital asset’s growth prior to the halving event. With the fast approaching much-anticipated Bitcoin Halving, Rekt Capital, a well-recognized cryptocurrency analyst and aficionado, has offered his market insights mapping out three distinct stages of the event for investors.

3 Distinct Aspects Of The Bitcoin Halving

Rekt Capital’s analysis delves into Bitcoin‘s movement before and after the halving takes place, which is expected to happen this month. In the seven days leading up to the occurrence, the crypto analyst underscored three stages to observe for a successful outcome.

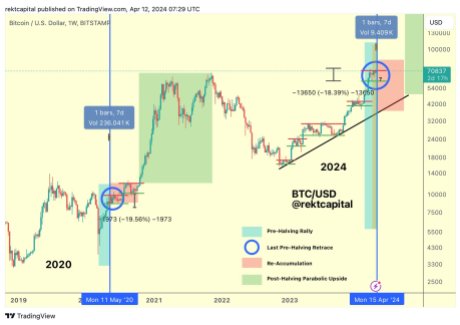
These three phases include the final pre-halving retrace, the re-accumulation phase, and the parabolic uptrend phase. Emphasizing on the first aspect, Rekt Capital noted that the pre-halving retrace is documented in the books and has already manifested.

Bitcoin

During this period, Bitcoin experienced an 18% pullback compared to 2016 and 2020’s retracement of 38% and 19%, respectively. The expert believes that the concluded pre-halving Retrace was the last chance to purchase a deal during the pre-halving phase.

Following the conclusion of the retrace, Rekt Capital has confirmed the development has laid the groundwork for the Re-accumulation range. It is important to note that the aforementioned range occurs a few weeks ahead of the halving, and it ends with a breakout from it a few weeks later.

Specifically, the period could last for several weeks and up to 150 days or five months. Given the manifestation of the range, sideways movement through the halving and beyond is the major purpose of BTC.

Thus, the analyst has stressed the need to be patient around this phase, as many investors get frustrated, bored, and disappointed here because their Bitcoin investments lack significant returns. As a result, they lose confidence and get shaken out of the market before the event.

BTC’s Post-Halving Rally Might Mirror Previous Trend

As for the parabolic uptrend, Rekt Capital claims the phase will begin when Bitcoin breaks out from the re-accumulation range. He further stated that the price of BTC tends to grow more quickly and enters a parabolic upsurge during this stage.

According to the expert, this area has typically lasted about a year or a little more, particularly around 385 days in the past. However, with the possible accelerated cycle that is currently in development, the period could be halved within this bull market cycle.

Rekt Capital’s key perspectives came amidst Bitcoin demonstrating strength to revisit its current all-time high of $73,000. BTC has managed to amass gains of more than 6% in the past few days.

It recovered to the $70,000 level after plunging as low as $67,000 on Wednesday and is getting close to $71,000. At the time of writing, BTC was trading at $70,854, indicating over 6% increase in the past week.

Its market capitalization is up by 1% and its trading volume has plummeted by more than 21% over the past day. Given the current trend in the coin market, BTC could be in a position to see even bigger gains in the months to come.

Bitcoin

Bitcoin Weekly Range Breakout Signals Potential Upsurge: Analyst

Popular cryptocurrency analyst and enthusiast Rekt Capital has delved into the recent performance of Bitcoin (BTC) citing the beginning of a breakout process from a weekly range that could possibly lead to an upswing.

Bitcoin Begins The Breakout Process

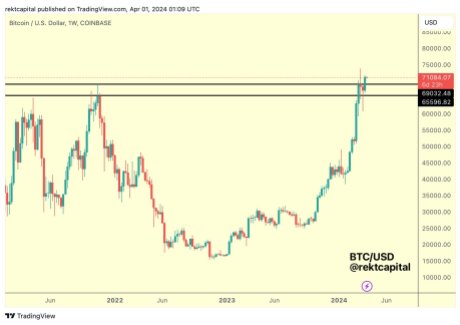
Rekt Capital previously highlighted that Bitcoin has been wedged within a weekly range he dubbed Black-Black, ever since it witnessed about 18% correction. The candle-bodied peak from 2021 and the upside-wicking peak from 2021 basically created this weekly range.

He then claimed that regaining the $69,200 Range High for Bitcoin could indicate that the cryptocurrency is prepared to break out of the weekly range. Additionally, it might also signal the conclusion of the aforementioned pullback period.

It appears the analyst’s forecast has come to pass as BTC has surpassed the $69,200 level, triggering a breakout activity. According to Rekt Capital, the first phase in the breakout process that Bitcoin has initiated is a Weekly Close above the Range High.

However, before moving higher, BTC might need to dive into the range high in order to properly retest it as new support. As a result, it would be the second phase to validate the break out from the week range properly.

Bitcoin

The crypto expert’s analysis coincides with a recent drop in the price of Bitcoin today, raising speculations about its next movement. Bitcoin opened the day around the $71,000 threshold; a few hours later, the crypto asset fell to $69,200 level.

As of the time of writing, Bitcoin was trading at $69,500, indicating a decline of about 1.29% in the past day. BTC’s market cap has also decreased in the last 24 hours by the same percentage, while its daily trading volume has increased by over 52%.

A Bullish Month For BTC

This suggests that investors are still bullish toward the digital asset despite the retrace witnessed today. Investors are even more optimistic as Bitcoin’s halving event approaches because of the possible impact on BTC.

Even though BTC began the day with a decline, several analysts still believe it might perform robustly in April. This is due to the fact that Bitcoin has mostly experienced significant growth in April over the past years.

Zia Ul Haque, the Founder of Open4Profit claims that in the past April has been superior to March while providing a comparison of the monthly increases in the price of Bitcoin from 2013 until 2024. According to data shared by Haque, April has witnessed an average 14.2% increase in price. 

Haque anticipates a better performance this time since the much-awaited Bitcoin halving event will take place this month. “Halving is just at the end of this month – April 20th, pre-halving narrative can bring lots of attention to this market,” he stated.

Bitcoin

Dogecoin Enters New Trend Set To Drive Price To $0.3: Analyst

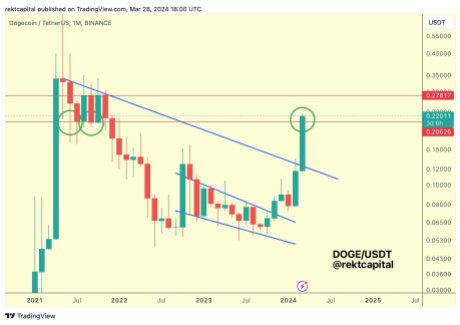
Amid the recent momentum displayed by the meme-inspired cryptocurrency Dogecoin (DOGE), Rekt Capital, a crypto trader and analyst, has identified a new trend that could propel DOGE’s price to the $0.3 price mark in the short term.

Dogecoin (DOGE) Inititate New Macro Uptrend

Over the past few weeks, Dogecoin has been performing fairly well, triggering optimism and expectations for more price growth. Due to this, the top meme currency in the world in terms of overall market valuation has always generated discussion within the sector.

DOGE’s recent spike in price resulted in the conclusion of its Macro Downtrend, according to Rekt Capital. However, the breakout has triggered DOGE into a new Macro Uptrend on the upside.

Dogecoin

Additionally, DOGE Monthly would recapture historical support if it closed above the red $0.20 price level. As a result, it would provide more momentum for a move towards the $0.30 range and even further.

The post read:

Dogecoin has ended its Macro Downtrend and begun a new Macro Uptrend. And if DOGE Monthly Closes above the red ~$0.20 level, it would reclaim historical support that could offer further fuel for a move towards the $0.30+ area.

It is worth noting that it took Dogecoin less than two weeks to break out from the macro downtrend after entering the area. Rekt Capital pointed out that the crypto asset successfully retested its support after breaking its macro downtrend two weeks ago.

During this period, the analyst underscored DOGE was still in the retest phase because the coin was still declining. Furthermore, the meme coin was moving sideways within a new macro range he dubbed black-red, around $0.12 and $0.20.

Prior to the breakout, Rekt Capital stated that DOGE is taking all the appropriate steps to validate its new macro uptrend. Given that the token has broken through strong resistances, it could be headed for a new peak in this cycle.

Potential Catalyst For The DOGE’s Performance

Rekt Capital’s forecast came in light of DOGE witnessing a significant increase to $0.22, its highest level in the past 2 years. It is believed that the upswing was triggered by rumors that the asset could be incorporated into Elon Musk‘s X platform very soon.

Ever since the rumors developed, Dogecoin’s price has doubled in less than a month, suggesting interest growth from investors. Dogecoin is currently the eighth-largest crypto asset by market value, with a market cap of $31.087 billion, following its remarkable price explosion.

Presently, Dogecoin is trading at about $0.21, with a notable $5.157 billion trading volume in the past day. Despite the recent price development, DOGE is still more than 50% down from its all-time high of $0.74.

The resurgence of Dogecoin in the rapidly evolving cryptocurrency space is indicative of the dynamics of the market. This huge increase also reflects the general state of the market, showing investors’ ongoing interest in meme coins today.

Dogecoin

Analyst Warns Of Bitcoin Pre-Halving Retrace Echoing Troubling 2020 Trend

Rekt Capital, a cryptocurrency expert and enthusiast, has identified a similar pattern between the recent Bitcoin pre-halving retrace and the one that took place in 2020 before the crypto asset witnessed an upsurge to its previous all-time high.

Bitcoin Pullback Is Almost Identical With 2020 Pre-Halving Retrace

Bitcoin, the largest cryptocurrency asset, is presently demonstrating momentum, rising over $70,000 and recovering from a recent downward trend. Following the recovery, Rekt Capital believes that the pullback might be over, citing a similarity to the 2020 pre-halving retrace.

Given the uncertainty of the crypto market, the analyst is not sure if the recent upsurge marks the end of the pre-halving retrace. However, if that is the case, then Bitcoin would have nearly matched the pre-halving correction from 2020.

Bitcoin

According to the analyst, the digital asset has recorded a pullback of over 18% in this cycle. Meanwhile, in the 2020 cycle, it retraced by over 19%, suggesting the potential of the asset mirroring the 2020 movement this cycle.

A further dive into the correction made by the analyst reveals that Bitcoin has been trapped inside the Weekly range (black-black) ever since it retraced by over 18%. Both the upside-wicking 2021 peak and the candle-bodied 2021 peak combine to create the weekly range that Rekt Capital has indicated.

Thus, he claims that BTC reclaiming the $69,200 ‘range high’ as support, which has already played out, could signal the conclusion of the recent decline. In addition, this demonstrates that Bitcoin is poised to move over its weekly range and soar higher.

With the 2024 Bitcoin halving drawing closer, the cryptocurrency is having difficulty in reclaiming its most recent peak of $73,000. However, there are rumors that today’s increase could mean the pre-halving decline is coming to an end.

Considered Catalysts For BTC’s Strength This Cycle

As of the time of writing, BTC has rebounded to around $70,806, indicating a daily increase of over 5%. Its market cap and trading volume are also showing strength, rising by 5.49% and 47.82%, respectively, in the past day.

One of the main drivers of Bitcoin’s growth this cycle is thought to have been the approval of spot BTC ETFs in January 2024. With the acceptance of the product, investors now have a convenient way to profit from Bitcoin’s value without actually owning any of it. 

Since then, the crypto asset has witnessed increased adoption from industry leaders and a massive inflow of capital, propelling its price as well. The BTC price has increased from $46,000 to a peak of $73,000 since the ETFs were approved by the US Securities and Exchange Commission (SEC).

Another catalyst considered to have impacted the coin’s price is the anticipation surrounding the upcoming Bitcoin Halving set to occur in April. In the past, these kinds of events have led to notable price upticks. Due to this, investors will shift their attention to BTC to position themselves for significant gains following the halving event.

Bitcoin

Bitcoin Approaches Risky Territory As Halving Event Draws Near

The price of Bitcoin has been on a downward trend since it reached a new all-time of $73,000, ushering in a wave of speculations regarding the crypto asset’s next direction in the short term.

In the past few days, Bitcoin’s recent dip has triggered a general crypto market retracement. With the Bitcoin Halving event fast approaching, many crypto analysts are anticipating a further decline in BTC’s price in the near future.

Bitcoin Poised For “Danger Zone” Ahead Of Halving Event

Popular cryptocurrency trader and analyst Rekt Capital has shared a gloomy prediction for Bitcoin with the crypto community on the social media platform X. His forecast examines BTC’s potential to drop even further prior to the halving event while noting the entrance to a risky area he dubbed the “Danger Zone.”

The analyst’s forecast came in light of BTC experiencing a notable decline in the past few days. According to the expert, two days from now, Bitcoin will formally venture into the danger Zone (orange). 

This is the starting area of past retracements seen ahead of the BTC Halving, which is expected to take place in April. Prior to the halving, these retracements have constantly indicated intervals of substantial market corrections for the digital asset. 

Bitcoin

Rekt Capital further pointed out that the pre-halving retracements have historically been observed in BTC 14-28 days before the event. Bitcoin’s price witnessed a pullback of about 40% in advance of the 2016 halving occurrence. 

Meanwhile, in 2020, the crypto asset fell by over 40% before the occasion. Presently, we are less than 30 days before this year’s BTC halving takes place; however, the price of the coin has declined by over 11% in the past week, suggesting further correction in the coming weeks. 

The post read:

In 2 days, Bitcoin will officially enter the “Danger Zone” (orange) where historical Pre-Halving Retraces have begun. Historically, Bitcoin has performed Pre-Halving Retraces 14-28 days before the Halving. In 2020, this retrace was -20% deep, and in 2016, this retrace was -40% deep. Currently, BTC is 30 days away from the Halving and has pulled back -11% this week.

It is noteworthy that the crypto analyst had previously pinpointed the timeframe BTC is expected to top out in this bull cycle. Rekt Capital believes the asset will peak within 280-350 days. Specifically, this could occur around mid-December this year, or in mid-February of next year.

4 Distinct Halving Phases

So far, the crypto analyst has highlighted several different phases for the upcoming Bitcoin Halving; these include the Pre-Halving Rally, Final Pre-Halving Retrace, Re-accumulation, and Parabolic uptrend.

According to Rekt Capital, there usually is a pre-halving rally approximately 60 days before the event takes place. For the final pre-halving retrace, it usually develops around 14 to 28 days ahead.

Furthermore, after the Pre-Halving pullback, a multi-month re-accumulation period follows. Lastly, the parabolic uptrend begins once Bitcoin exits the area of re-accumulation.

Bitcoin

Key Trend Driving Altcoin Market Toward $425 Billion: Analyst

Amid the bullish sentiment around the crypto landscape, the Altcoin overall market cap has displayed positive strength as many investors and traders are throwing capital into several altcoins ahead of the bull cycle. 

Altcoin Market To Rally Toward $425 Billion

Since Bitcoin has surged to a new record high, many cryptocurrency analysts anticipate a surge in the altcoin market cap. Rekt Capital, a cryptocurrency expert and trader, has shared a positive prediction regarding the altcoins market cap with the community on X.

The expert analysis delves into the current state of the market and its potential to surge higher in the coming months. His projections came in light of the altcoin season index showing advancement, which suggests that its season is almost here.

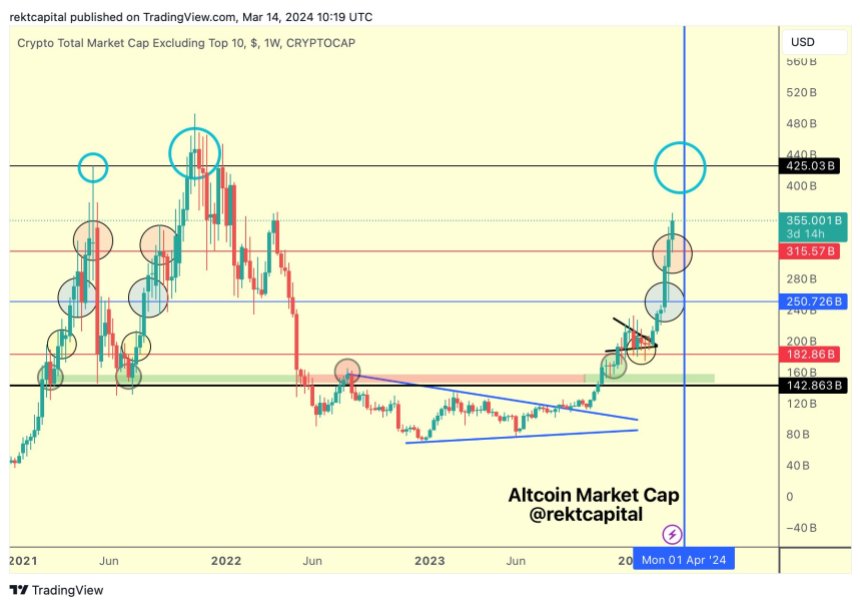
According to the analyst, the market has been “redirected into the blue-circled testing area,” which was caused by rejection from the “red-circled circle zone.” However, the market has rebounded since then, indicating an increased interest from market investors.

Altcoin

Furthermore, Rekt Capital noted that the market has surpassed the “$315 billion red line of resistance.” As a result, the red line resistance level has now been changed to a “new support level.” Due to this, the crypto analyst anticipates a surge to the “light blue circle” at the $425 billion threshold in the upcoming months.

The post read:

The red-circled area rejected the Altcoin Market back into the blue-circled retesting zone. Since then, the Altcoin Market Cap has recovered, broken beyond the red $315bn resistance, and turned recently into new support. Next is the light blue circle, over time.

However, Rekt Capital also asserted in another recent post that the “$315 billion mark is still being retested by alts market cap new support.” It has been unable to move past it despite today’s double-digit declines on several altcoins.

Even though the market is still retesting the aforementioned level, Rekt Capital is confident that it will “revisit the $425 billion resistance” soon. He anticipates the market revisiting the level before the Bitcoin Halving event, expected to take place in April.

Alts Gains Are Sustable And Likely To Crash

Chief Executive Officer (CEO) of Bitcoin technology firm JAN3, Samson Mow, has also shared his insights regarding the altcoin market. Despite anticipating a rise in the altcoin market, Mow highlighted that he expects alts to “crash in the upcoming weeks.” 

According to Mow, alts have been monitoring the “increase in Bitcoin” after launching BTC Spot Exchange-Traded Funds (ETFs). However, altcoins do not possess “the $500 million to $1 billion” daily inflows seen with Bitcoin.

Consequently, this should be the “major sign” that their gains “can not” be maintained. “MSTR has a $30 billion market cap, Solana is $73 billion. That is absurd. A correction is overdue,” he added.

Altcoin

Solana Smashes Major Resistance Levels, New All-Time High Imminent?

With previous price achievements, Solana (SOL) has become one of the biggest cryptocurrencies in the market, garnering the attention of investors and traders as its price continues to rise, hitting a new yearly high of $172.

Solana (SOL) Breaks Through All Critical Levels

Solana has effectively reached a new 25-month high, reflecting a strong positive interest from crypto investors within the sector. Due to this, several market experts are predicting that the crypto asset reaching a new all-time high is on the horizon.

Crypto Jelle, a cryptocurrency trader and analyst has shared his insights on Solana’s latest rally on X (formerly Twitter) while noting the significance of the development.

The crypto analyst pointed out that “SOL has surpassed every significant level preventing it from reaching new all-time highs.” This suggests that the digital asset could reach a new peak in the short term since there are only minor resistance levels ahead.

Solana

Jelle is optimistic about Solana, asserting that he has been able to “hold SOL with ease ever since it was at $20.” Furthermore, he mentioned that he “does not have any plans of selling” his SOL holdings anytime soon, demonstrating his belief in the coin to soar higher.

As Solana continues to rally, Jelle is confident that the asset will attract a lot of new retailers or investors. In addition, purchasing SOL serves as their entry point to position themselves for future gains.

The post read:

SOL has broken all major levels standing in the way of new all-time highs. I have been comfortably holding this one since $20, and I do not plan on selling it anytime soon. New retail will flock to Solana tokens, and buying SOL is their entry ticket.

According to Crypto Jelle, SOL is one of the largest assets in his crypto portfolio alongside Injective (INJ). Jelle asserted that both crypto assets are currently moving in an upward trajectory, signaling the start of their bull run.

Furthermore, he claims that SOL and INJ have reclaimed the top spot as the “altcoins market leaders.” Consequently, every other altcoin “will follow their lead” in this bull cycle.

$208 Resistance Level Might Be Revisited

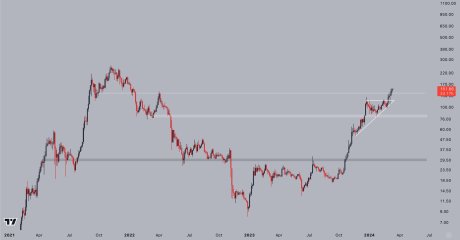
Rekt Capital, a crypto expert has pointed out Solana’s potential to revisit the $208 resistance in the short term. At first, he underscored that the SOL is demonstrating strength similar to that of the 2021 bull cycle.

Since the digital asset broke out from the green zone, it has increased by over 118%. It has also increased by over 53% ever since it broke out of the Ascending Triangle.

Due to this, he believes the “$208 resistance level might be tested again” in the coming months. So far, SOL has climbed by over 23% in the past week, indicating a rise in buying pressure in the crypto market.

Solana

Historical Trends Unveil Bitcoin Peak Timing in Current Bull Cycle

Since the price of Bitcoin broke its previous all-time high, it has shown immense momentum, surging even higher, surpassing the $72,000 price mark, while leading the charge to what is considered the “biggest bull run in history.”

Bitcoin Lengthening Cycles Beyond Previous All-Time High

Many crypto analysts predict the world’s largest cryptocurrency will peak within the next few months following the surge. Some have even pinpointed the exact timeframe in which this might happen in this bull cycle.

Rekt Capital, a cryptocurrency analyst and trader, has shared his insights on Bitcoin’s potential to top this bull cycle within the same timeframe as previous bull cycles.

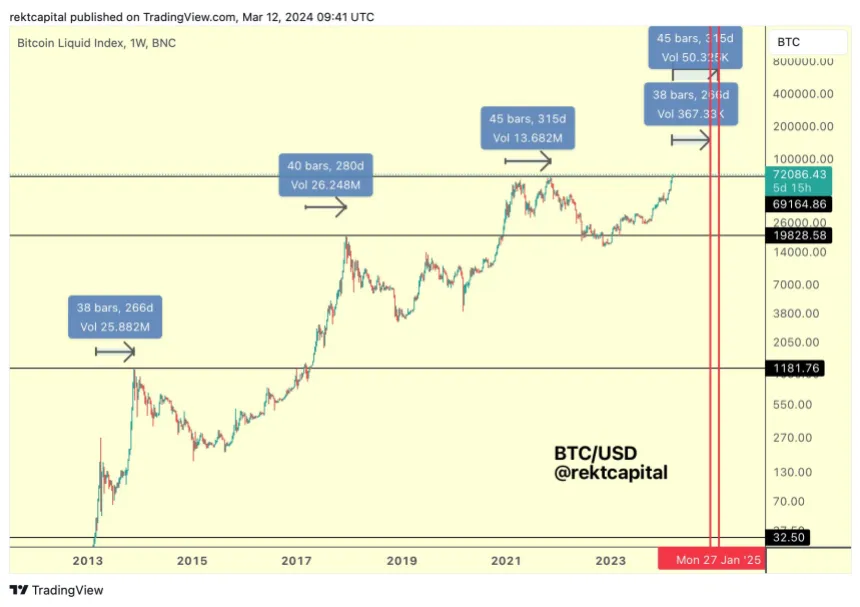
According to Rekt Capital, when Bitcoin breaks its old peak, it usually executes a “Bull Market Top” between 266-315 days. Given that BTC surpassed its previous all-time high last week, 266-315 days might be the approximate time of the next bull market peak.

Bitcoin

Specifically, this could happen around late November 2024 or very late January 2025. Even though this cycle is accelerating, Bitcoin’s days above its old peak seem to be taking longer.

The post reads:

Bitcoin broke its old All Time Highs last week, the next Bull Market Peak may thus occur in 266-315 days. That is very late November 2024 or very late January 2025. However, as fast as this cycle may be, it appears that the amount of days that Bitcoin spends beyond past all-time highs is actually lengthening.

Drawing attention to the preceding bull cycles, the expert further emphasized that before topping out in 2013, “BTC’s surge lasted for 268 days.” Also, in 2017, it “topped out in 280 days,” indicating an increase of 14 days.

Meanwhile, in 2021, the crypto asset “rallied for 315 days before reaching its peak,” indicating a 35-day increase compared to 2017. Therefore, this historical trend shows that BTC has exceeded past peaks by an average of 14 and 35 days.

As a result, by adding the initial bull market peak timeframe of 266-315 days with the 14-35 days, Rekt Capital has pinpointed the coin to top out within 280 and 350 days. In particular, this could take place in the middle of December 2024 or in the middle of February 2025.

Is BTC Breaking Its Preceding Pinnacle Too Early?

Dennis Porter, the Chief Executive Officer (CEO) of Satoshi Action Fund, has revealed his optimistic view regarding BTC’s latest milestone. Porter mentioned that the asset reaching a new height marks the first time it has happened ahead of the halving event.

According to the CEO, Bitcoin is witnessing a massive “fund inflow from institutional players not seen in the past.” He added, “many states are now seeking to enact legislation supporting BTC.” Thus, he has urged the community to remain unwavering, as “history is being made.”

Bitcoin

Bitcoin To $240,000: Analyst Cites Key Narrative As Catalyst

Bitcoin price has fallen by over 10% after briefly touching its all-time high of $69,000, propelled by investors’ flood of money into BTC Spot Exchange-Traded Funds (ETFs).

However, intense volatility surrounding the crypto asset’s price has triggered a rebound to the $68,000 mark, which highlights the return of positive enthusiasm, prompting predictions of a significant rally to an unprecedented height.

Key Narrative That Could Send Bitcoin To $240,000

Cryptocurrency analyst and trader Matthew Hyland has shared an optimistic forecast for Bitcoin with the community on the social media platform X. The analyst has identified a key trend that could trigger a bullish rally for BTC to the $240,000 threshold.

At first, Hyland noted that over the past two years, Bitcoin has “destroyed several narratives, both positive and negative.” These include one of the ideas that BTC will “never fall below the previous cycle low or reach its peak until after the halving event.”

Bitcoin

However, Hyland claims that the only narrative left that BTC has not destroyed is the “Diminishing Returns,” as it is still almost 100% effective. Hyland is uncertain of the narrative’s effect but believes that it is the “final boss” since it is the only one still standing.

As a result of the trend, the crypto expert has set his price target at $240,000 in the upcoming months. This simply means BTC needs to surpass the aforementioned price in order to be able to demolish the diminishing returns narrative.

Hyland claims it makes no difference to him if Bitcoin “reaches the level or not.” Nonetheless, it will be “intriguing” to observe whether it can smash the one trend that remains intact.

Another expert known as Crypto Signals seems to agree with Hyland, expressing his pleasure in the analysis. According to Crypto Signals, in the context of Bitcoin, “the idea of diminishing returns is a fascinating one.”

Crypto Signals claims that every cycle tends to “produce a declining percentage gain as the market matures.” Due to this, there is a more profound development and broader adoption in the market. Thus, in the constantly changing world of cryptocurrencies, the narrative is worth looking into.

Strategic Timeframe For BTC Pre-Halving Rally

Rekt Capital, a well-known crypto expert, has pinpointed a timeframe for when and where the Bitcoin Pre-Halving rally will end. According to Rekt Capital, the “pre-halving rally is gradually approaching its end.”

Related Reading: Bitcoin Halving Prep: Analyst Outlines Key Points Ahead Of Event

Drawing a comparison to 2020’s pre-halving rise, the analyst stated that it occurred two weeks before the event. After that, BTC witnessed a “pre-halving retrace” of about 20%, which was the last it saw before the halving.

He further drew a comparison to 2016’s pre-halving surge, which he noted took place “28 days prior to the halving.” Nevertheless, it also experienced “a conservative correction” of over 29% after the rally topped.

Rekt Capital has marked the point as the “historic danger zone” that could potentially conclude the pre-halving rally this year, before witnessing a pullback ahead of the event.

Bitcoin