
A return to the $73,000 price range for BTC will likely be met with short-term holder resistance but could also mark a turning point for the asset.
Cryptocurrency Financial News
A return to the $73,000 price range for BTC will likely be met with short-term holder resistance but could also mark a turning point for the asset.
For analysts and investors alike, comprehending the variables that influence price action in the complex world of cryptocurrency markets is essential. Ali Martinez, a well-known cryptocurrency expert, has recently provided insights into the fluctuations in the price of Bitcoin by applying the basic economic theory of supply and demand.
It is worth noting that any asset’s price movement, including cryptocurrencies, is determined by the fundamental rules of supply and demand. An asset’s price tends to decrease when supply outpaces demand, while prices typically increase when supply cannot keep up with demand.
Thus, Ali Martinez has deduced the crypto asset’s price and holders’ behaviour by applying the method and other on-chain metrics. Martinez’s analysis demonstrates how fluctuations in the market’s buying interest and the availability of Bitcoin are key factors influencing its price trajectory.
According to Martinez, Bitcoin’s Realized Cap witnessed a significant increase mid-way through March when BTC hit a new all-time high of $73,000. This indicated that the majority of BTC’s long-term holders were likely yielding gains at the time.
As a result, several investors sold their holdings, which led to a sharp rise in realized profits. Following realized profits in March, long-term holders felt safe adding over 70,000 BTC to their investments at these prices.
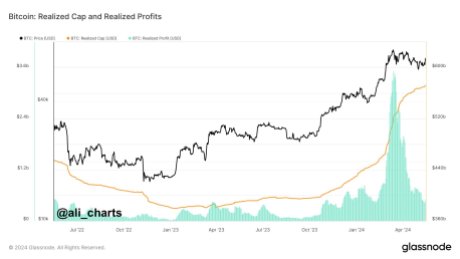
Meanwhile, when the market’s growing supply of Bitcoin exceeded demand, the coin saw a substantial correction from the $73,000 level to the $57,000 level.
Given that short-term holders are more likely to sell their holdings due to price volatility, this decline took Bitcoin below its realized price for short-term holders, inciting fear in the market. However, despite investors’ concerns, the short-term holder’s Realized Price at the $65,500 level acted as an accumulation point.
On the basis of this principle, Martinez believes the likelihood of Bitcoin continuing its upward trajectory will only increase when demand for the cryptocurrency starts to exceed the supply of BTC accessible in the market.
Martinez has underscored that the available BTC on crypto exchanges can be used to confirm these supply and demand laws. He further noted that over 30,000 BTC have been moved to private wallets for long-term storage in May, indicating confidence among holders in the potential worth of Bitcoin.
Observing Bitcoin’s price using the MVRV Extreme Deviation Pricing Bands, Martinez cited a retracement above the +0.5σ pricing band at $64,600. Such an upswing has historically caused BTC to test the pricing range of 1.0σ, which is backed by increasing demand. Meanwhile, this price range at the moment is roughly lingering at $77,000.
Presently, the price of Bitcoin is trading at $66,275, indicating an over 5% increase in the past week. Although prices are up, its trading volume has declined by 24%, while its market cap is up by 0.23%.
In an ever-evolving world of cryptocurrency markets, deciding the bottom of Bitcoin price correction is an endeavor that attracts interest from both investors and analysts. Joining the fray is cryptocurrency analyst and trader MilkyBull offering insights on the subject, claiming that Bitcoin’s local bottom has developed due to a certain development.
Following its weekend recovery out of bear market territory, the price of Bitcoin slightly decreased on Monday. However, MilkyBull is confident that the recent retracement might be the last before BTC turns to move on the upside.
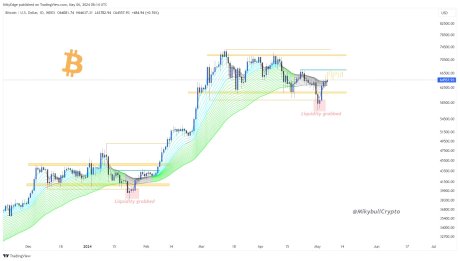
According to the expert, given that the next liquidity grab interest is above $64,557, the local bottom for Bitcoin is in. As a result, before moving on to the current all-time high of $73,000, BTC will first clear the $67,000 price level and consolidate. Thus, Bitcoin may eliminate the CME gap below either prior to or subsequent to eliminating the liquidity above $64,975.
Related Reading: Bitcoin Bottom In? Retracement From $73,800 Is Deeper And Took Longer To Form
The CME gap is a price difference that occurs between the Friday closing price and Sunday opening prices of the Chicago Mercantile Exchange (CME) Bitcoin futures market. Therefore, the expert considers this development a good area for long trade, signaling a buying opportunity for BTC bullish investors.
MilkyBull further drew attention to a previous analysis that suggests Bitcoin could be poised for a rally due to historical patterns. The analyst noted that the 2017 price action shows that when BTC breached a new all-time high, there was a healthy retracement that was driven by liquidity before it surged to a cycle peak.
Given that BTC might be mirroring this pattern, MilkyBull’s analysis might suggest that BTC has undergone its last shakeout, and a move on the upside could be imminent. He also confirmed that the present consolidation range was paralleled by the preceding consolidation, which began to materialize from December 2023 to February 2024.
This pattern, identified as a manipulative strategy of the market makers (MMs) by the expert, is meant to remove degenerate Short-Term Holders (STHs), which are particularly vulnerable to price corrections below their cost base.
While MilkyBull anticipates a rally, market expert Benjamin Cowen expects the leading cryptocurrency asset to drop in the upcoming days. Last week, Cowen claimed BTC’s Return On Investment (ROI) 12 days after the Bitcoin Halving event was the worst performance that the asset has experienced. According to Cowen, this is reasonable as it is the first time BTC is reaching a new all-time high before the Halving.
Almost a week later, there is still no improvement, as the analyst noted that BTC ROI is still performing worse than in previous cycles. Comparing this action with that of 2016, Cowen expects BTC to undergo a decline in the coming week.
During the time of writing, BTC was trading at $63,970, demonstrating an increase of over 3% in the past week. While its market cap is down by 1.17%, its daily trading volume has garnered positive sentiment, rising by 40%.
Short-term Bitcoin holders have been going on a buying spree lately, accumulating over 1.2 million BTC since December 2023, according to Glassnode. Bitcoin has received major interest from investors since the beginning of the year, and rightly so, considering the amount of attention brought by the launch of Spot Bitcoin ETFs in the US.
While the cryptocurrency has gone through an extended period of bullish action, the majority of the accumulation trend has largely been attributed to whales and addresses holding large amounts of Bitcoin for long periods. However, recent data from Glassnode has revealed an interesting accumulation trend amongst short-term holders. At the same time, the profit/loss ratio of this cohort of trades has remained well within the profit zone since the beginning of the year, with profit taking outsizing losses by 50x.
Investors have seen Bitcoin struggling to trade above the $70,000 price level since the middle of March. However, Bitcoin on-chain data has recently revealed an interesting accumulation trend from Bitcoin’s holding addresses. Particularly, 21,400 BTC, worth around $1.40 billion, were moved into these addresses in the past few days, indicating the buying pressure might be back already.
The collective holding of short-term holders has been rapidly climbing since December 2024 while the long-term holders have been distributing. Short-term holders are those wallets that hold Bitcoin only for a few weeks or months at a time. The fact that so many new coins have entered short-term holder wallets recently shows that many investors have been pouring into the market. This, in turn, could suggest the cryptocurrency has finally achieved full-scale adoption, which could lead to continued price growth over the years.
Profit/loss data reveals short-term holders have collectively been in profit since the beginning of the year. According to Glassnode, short-term holders have been buying and selling at a profit for the majority of 2024 so far. In fact, the short-term holder profit has outsized losses by 50 times. This means that over 49 out of 50 short-term holders were selling their Bitcoin for a higher price than what they paid.
Interestingly, Bitcoin’s recent ascent to a new all-time high saw the short-term holder realized profit/loss ratio reaching its highest point ever on the 7D Exponential Moving Average.
The buying spree by both short-term and long-term holders suggests that both retail and institutional interest in Bitcoin is now at its highest point. Fundamentals point to the likely continuation of this trend throughout April, especially with the approach of the next Bitcoin halving.
At the time of writing, Bitcoin is trading at $66,903, up by 1.87% in the past 24 hours.

The latest analysis by Glassnode suggests that the worst of the sell-offs could be concluded, but the market still needs time to recover.

Although long-term coin selling saw a marked increase last week, HODLing is still the preferred strategy as more of the short-term supply is becoming long-term supply.
Let’s cut to the chase: Glassnode thinks we’re in a bear market. In their latest “The Week On-Chain” newsletter, the company tries to “establish the likelihood that a prolonged bear market is in play” by “using historical investor behaviour, and profitability patterns as our guide.” One thing’s for sure, the recent crash was severe, and “such a heavy drawdown is likely to change investor perceptions and sentiment at a macro scale.”
Related Reading | Bitcoin Leads As Markets Sees Record Outflows. Bear Market Incoming?
How severe was it? According to Glassnode, “this is now the second worst sell-off since the 2018-20 bear market, eclipsed only by July 2021, where the market fell -54% from the highs set in April.” Apart from the price, investors “capitulated over $2.5 Billion in net realised value on-chain this week.” Who were those paper hand investors? “The lion’s share of these losses are attributed to Short-Term Holders.” Of course.
Glassnode Points Out The Bear Market Indicators
BTC Price Drawdown from ATH | Source: Glassnode
How does this point to a bear market? “Considering previous cycles, such low profitability is typical in the early to mid phase of a bear market (orange). One could also reasonably argue that a bear market started in May 2021 based on this observation.” This is not enough, though. But Glassnode has more.
How does this point to a bear market? “With a current MVRV-Z reading of 0.85, the market is well within territory visited in bearish markets, and a bearish divergence is noted, similar to the NUPL metric above.” Is this enough? No way. But Glassnode has an ace up its sleeve.
How does this point to a bear market? “The market is now trading below the RTLR price of $39.2k, but above the Realised price of $24.2k. Again, this is often observed during early to mid stage bear markets.”
Who Sold And Who Is Still Holding Strong?
There’s no surprise here. The “Short-Term Holders (STH)” are selling. How does Glassnode define STHs, though? By the age of their coins. “Coins are considered to be owned by STHs when they are younger than ~155-days, and are statistically more likely to be spent in the face of volatility.” No surprise there either.
It’s worth pointing out that the STH’s coins are “currently held at a loss.” In fact, “as of this week, almost the entire STH supply is underwater.” That could be scary for newcomers, so those coins are at risk of being sold. At a loss. These people are going to regret their emotional decisions for life, but that’s a topic for another article.
BTC price chart for 01/24/2022 on Oanda | Source: BTC/USD on TradingView.com
The other question here is, who’s holding strong? According to Glassnode, “Interestingly, STH supply remains near multi-year lows, which is indicative of their counter-part, the Long-Term Holders (LTHs), who appear impressively unfazed by such a severe drawdown.” Of course. People who already understood the game are not easy to shake.
How are the LTH’s coins doing? “Over 59.3% of the circulating supply has now been dormant for over 1yr, increasing by 5.8% of circulating supply in the last three months.” This sounds bullish, but Glassnode finds a way to rain on the LTH’s parade. “Whilst a rising, and large proportion of mature coins is generally considered constructive, it once again bears similarities to a bear market, a time when only the HODLers and patient accumulators remain.”
Related Reading | Bitcoin Bottom Signal From Bear Market, Black Thursday Could Save The Bull Run
Conclusions And Hopium
According to Glassnode, one could argue that the “bear market started in May 2021.” Does it feel like a bear market, though? No, it doesn’t. It doesn’t feel like a bull market, either. We may be in a new phase and the Bitcoin cycle is dead. Or maybe we’re just in a bear market as Glassnode tried to prove. Either way, LTHs are not selling.
Featured Image by mana5280 on Unsplash | Charts by Glassnode and TradingView
Bitcoin has been doing good lately in the market. The digital asset broke the $50K price point earlier this week, before seeing a slight retracement down to $49K. This has been driven by a number of factors in the market. Growing interest is at the top of the list. As the price rallies, a number of interesting things have been happening in the Bitcoin space, ranging from holding patterns to the duration of the hold.
Recent data shows that the number of short-term bitcoin holders has declined to new lows. Most investors are now just holding their coins and not moving them out of their wallets. This is happening regardless of where the price of BTC is at any moment. A record of approximately 84% of the total bitcoin supply has not been moved in three months. This timeline coincides with the end of the last bull rally that saw the asset hit a new all-time to the present rally.
Related Reading | South African Man Loses $900,000 Worth Of Bitcoin After Accidentally Deleting Keys
Investors Moving Bitcoin Out Of Exchanges
A bull rally that would usually lead to an accelerated rate of sell-off is now having the opposite effect. Instead of investors clamoring to sell off their coins and take profits as the price goes up, data shows that investors are hoarding their coins. This is apparent in the inflows and outflows from cryptocurrency exchanges.
Related Reading | Crypto Market Goes Into “Extreme Greed,” What This Means For Bitcoin
Mounting buy pressures is now the order of the day as long-term holders have refused to move any of their bitcoin holdings. With over 80% of total supply barely moved, demand has now exceeded supply in the market, which has led to growing BTC prices. The accumulation patterns show that long-term holders are just taking shares from short-term holders to add to their stash.
Short-term BTC holders are down | Source: Twitter
This is leading to scarcity in the digital asset that will see buy pressures continue to go up while sell pressures drop. Outflows from crypto exchanges show that investors are accumulating and consolidating their BTC holdings for the long term.
Tides Are Changing, And So Are Hands
The past couple of years has seen bitcoin investors change their investment strategy in the market. Before, the predominant investing pattern was to buy the asset, hold for a period of time, then sell off during a bull rally. This has been the case for previous rallies. These patterns always plunged the market into a long bear stretch following a bull market.
BTC price corrects down below $50K | Source: BTCUSD on TradingView.com
But as the market has evolved, investors are evolving with it. The potential of BTC no longer is a short-term profit grab. Instead, coins are being held for the long term. Bitcoin’s growth over the years has shown that the asset is still only in its early stage of growth. So the next couple of years will most likely see the digital asset post bigger gains.
The number of weak hands in crypto is decreasing by the day. More investors are turning towards holding for the long term. Bitcoin now has more diamond hands in the market than there are weak hands.
Featured image from USA Today, chart from TradingView.com


