Solana is moving lower from the $115 resistance. SOL price is showing a few bearish signs and might decline sharply toward the $68 support.
- SOL price started a fresh decline from the $115 resistance against the US Dollar.
- The price is now trading below $100 and the 100 simple moving average (4 hours).
- There is a key bearish trend line forming with resistance near $92 on the 4-hour chart of the SOL/USD pair (data source from Kraken).
- The pair could continue to move down toward the $80 support or even $68.
Solana Price Starts Downside Correction
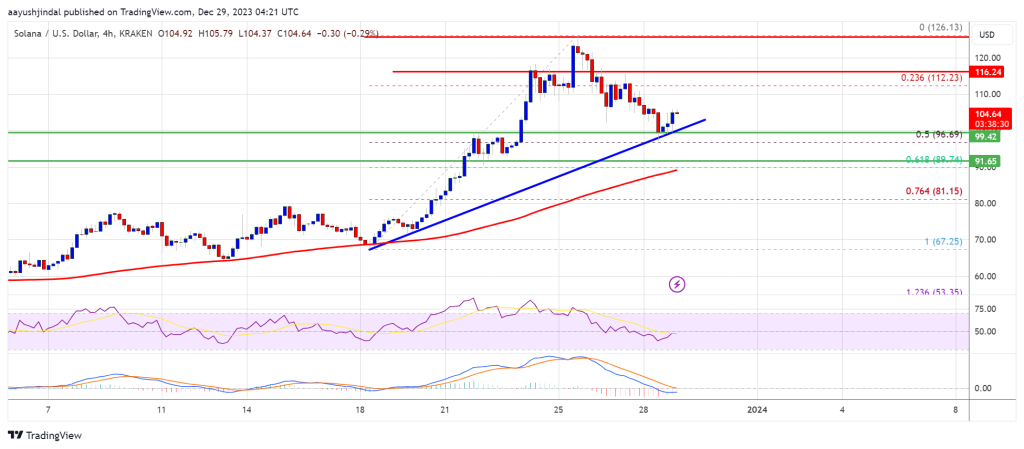
After a steady increase, Solana bulls struggled to clear the $115 resistance. SOL price formed a short-term top and started a fresh decline below the $105 support.
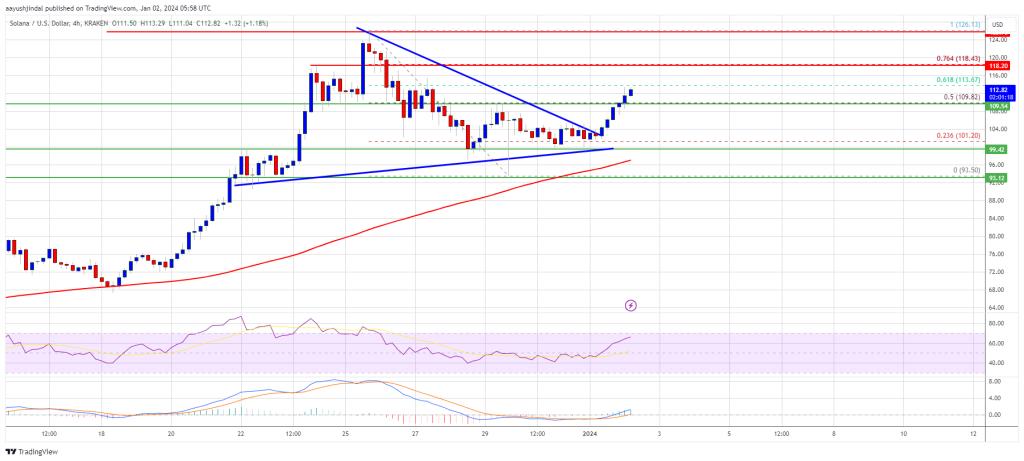
There was a steady decline below the $100 pivot level. The bears pushed the price below the 50% Fib retracement level of the upward move from the $71 swing low to the $108 high. The price is now showing a few bearish signs from the $115 resistance zone, like Bitcoin and Ethereum.
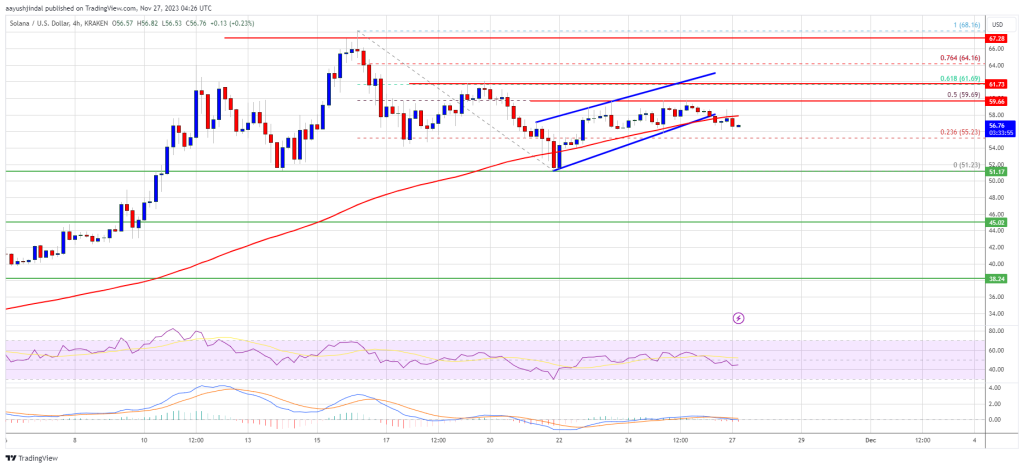
SOL is now trading below $95 and the 100 simple moving average (4 hours). There is also a key bearish trend line forming with resistance near $92 on the 4-hour chart of the SOL/USD pair.
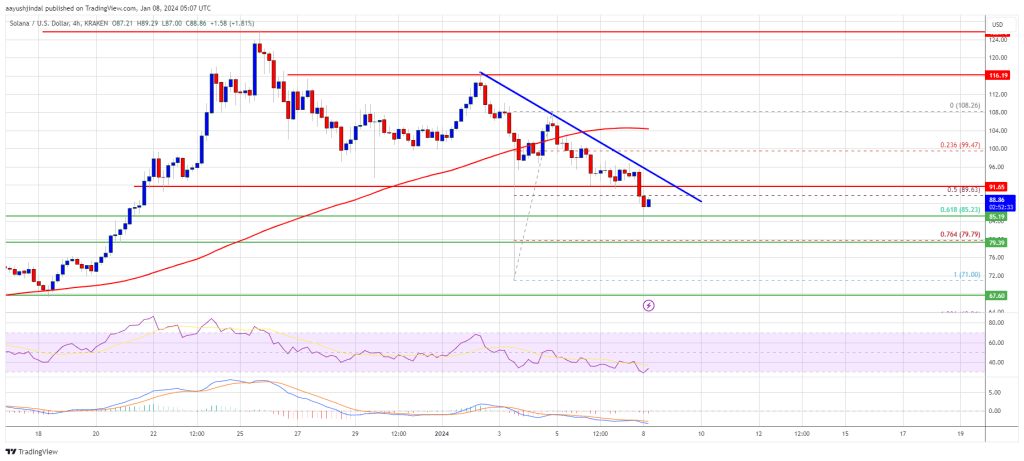
Source: SOLUSD on TradingView.com
If there is a fresh increase, immediate resistance is near the $92 level and the trend line. The first major resistance is near the $100 level or the 100 simple moving average (4 hours). The main resistance is now near $105. A successful close above the $105 resistance could set the pace for another major rally. The next key resistance is near $115. Any more gains might send the price toward the $125 level.
More Losses in SOL?
If SOL fails to rally above the $92 resistance, it could continue to move down. Initial support on the downside is near the $80 level.
The first major support is near the $72 level, below which the price could test $68. If there is a close below the $68 support, the price could decline toward the $50 support in the near term.
Technical Indicators
4-Hours MACD – The MACD for SOL/USD is gaining pace in the bearish zone.
4-Hours RSI (Relative Strength Index) – The RSI for SOL/USD is below the 50 level.
Major Support Levels – $80, and $68.
Major Resistance Levels – $92, $100, and $105.