The crypto’s weekly RSI has crossed above 70, indicating a strengthening of upward momentum.
Bitcoin’s ‘Triangular Consolidation’ Is Bullish: Technical Analysis
Such consolidations generally end with an upward breakout, one observer said.
Crypto Market Breadth Widens, Signals Bullish Momentum
Market breadth is a technical analysis technique that gauges the number of tokens participating in bitcoin’s rally.
SOL Price (Solana) Momentum Reignites: Indicators Signal Surge To $38
Solana is gaining pace above the $35 resistance against the US Dollar. SOL price remains supported and might aim for a fresh rally toward $38.
- SOL price started a major rally above the $32 resistance against the US Dollar.
- The price is now trading above $35 and the 100 simple moving average (4 hours).
- There is a key bullish trend line forming with support near $33.30 on the 4-hour chart of the SOL/USD pair (data source from Kraken).
- The pair is up nearly 10% and might surge further toward the $38 resistance.
Solana Price Rallies 10%
After a decent upward move, Solana settled above the $30 pivot level. SOL gained bullish momentum after it formed a base above the $30 and $32 levels.
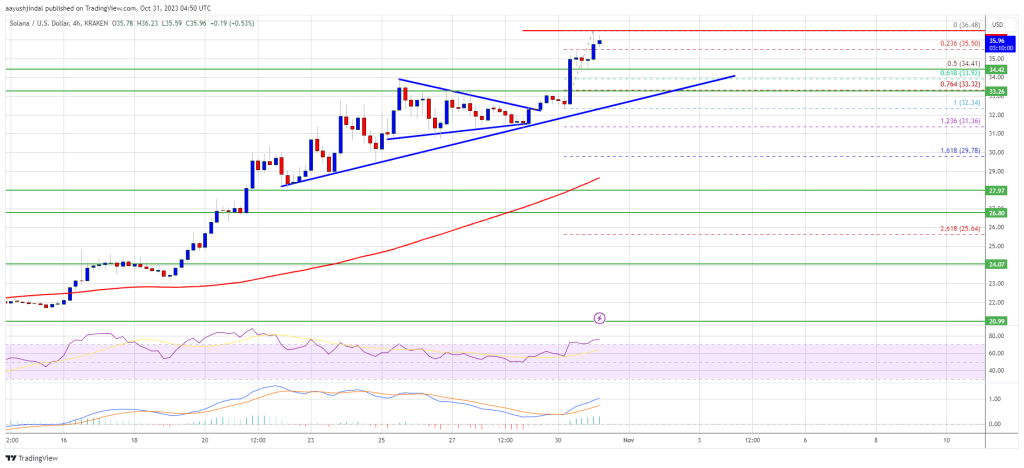
It is now outperforming Bitcoin and Ethereum. There was a clear move above the $35 resistance zone. A new multi-week high is formed near $36.48 and the price is now consolidating gains above the 23.6% Fib retracement level of the upward move from the $32.34 swing low to the $36.48 high.
SOL is now trading above $35 and the 100 simple moving average (4 hours). There is also a key bullish trend line forming with support near $33.30 on the 4-hour chart of the SOL/USD pair.
Source: SOLUSD on TradingView.com
On the upside, immediate resistance is near the $36.50 level. The first major resistance is near the $36.80 level. A successful close above the $36.80 resistance could set the pace for a larger increase. The next key resistance is near $38.00. Any more gains might send the price toward the $40.00 level.
Are Dips Limited in SOL?
If SOL fails to recover above the $36.50 resistance, it could start a downside correction. Initial support on the downside is near the $34.40 level.
The first major support is near the $33.30 level, the trend line zone, and the 76.4% Fib retracement level of the upward move from the $32.34 swing low to the $36.48 high. If there is a close below the $33.30 support, the price could decline toward the $32.00 support in the near term.
Technical Indicators
4-Hours MACD – The MACD for SOL/USD is gaining pace in the bullish zone.
4-Hours RSI (Relative Strength Index) – The RSI for SOL/USD is above the 50 level.
Major Support Levels – $34.40, and $33.30.
Major Resistance Levels – $36.50, $36.80, and $38.00.
Bitcoin to Score ‘Golden Cross’ After 30% Price Surge in Two Weeks
The bullish pattern comes months ahead of bitcoin’s fourth mining reward halving.
SOL Price Prediction: Solana Bulls Seem Unstoppable As They Aim For $35
Solana is gaining pace above the $30 resistance against the US Dollar. SOL price remains supported and might aim for a fresh rally toward $35.
- SOL price started a major rally above the $28 resistance against the US Dollar.
- The price is now trading above $29.20 and the 100 simple moving average (4 hours).
- There is a key contracting triangle forming with resistance near $32.10 on the 4-hour chart of the SOL/USD pair (data source from Kraken).
- The pair could start a strong rally if it clears the $32.10 and $32.75 resistance levels.
Solana Price Eyes More Upsides
After forming a base above $22.50, Solana started a fresh increase. SOL gained bullish momentum after Bitcoin rallied above the $30,000 resistance.
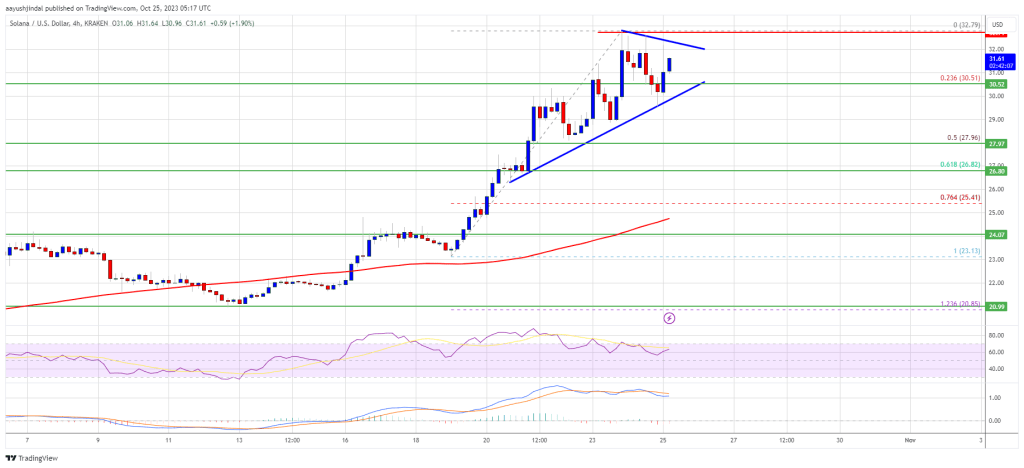
There was a strong move above the $28.80 and $30.00 resistance levels. It even spiked above the $32.50 level. A high is formed near $32.79 and the price is now consolidating gains. There is also a key contracting triangle forming with resistance near $32.10 on the 4-hour chart of the SOL/USD pair.
Solana is now trading above $29.20 and the 100 simple moving average (4 hours). It is now showing positive signs above the 23.6% Fib retracement level of the upward move from the $23.13 swing low to the $32.79 high.
Source: SOLUSD on TradingView.com
On the upside, immediate resistance is near the $32.00 level and the triangle region. The first major resistance is near the $32.75 level. A successful close above the $32.75 resistance could set the pace for a larger increase. The next key resistance is near $35.00. Any more gains might send the price toward the $36.50 level.
Are Dips Limited in SOL?
If SOL fails to recover above the $32.00 resistance, it could continue to move down. Initial support on the downside is near the $30.50 level.
The first major support is near the $28.00 level or the 50% Fib retracement level of the upward move from the $23.13 swing low to the $32.79 high. If there is a close below the $28.00 support, the price could decline toward the $26.80 support in the near term.
Technical Indicators
4-Hours MACD – The MACD for SOL/USD is gaining pace in the bullish zone.
4-Hours RSI (Relative Strength Index) – The RSI for SOL/USD is above the 50 level.
Major Support Levels – $30.50, and $28.00.
Major Resistance Levels – $32.00, $32.75, and $35.00.
SOL Price Prediction: Why Solana Could Surge 25% Above This Key Hurdle
Solana is correcting gains from the $25 resistance against the US Dollar. SOL price remains supported and might aim for a fresh rally toward $30.
- SOL price started a downside correction after it failed to clear the $25 resistance against the US Dollar.
- The price is now trading above $23.00 and the 100 simple moving average (4 hours).
- There is a key contracting triangle forming with resistance near $23.90 on the 4-hour chart of the SOL/USD pair (data source from Kraken).
- The pair could start a strong rally if it clears the $24 and $25 resistance levels.
Solana Price Remains In Uptrend
After a steady increase, Solana struggled to clear the $25 resistance zone. SOL formed a high at $24.82 and recently started a downside correction, like Bitcoin.
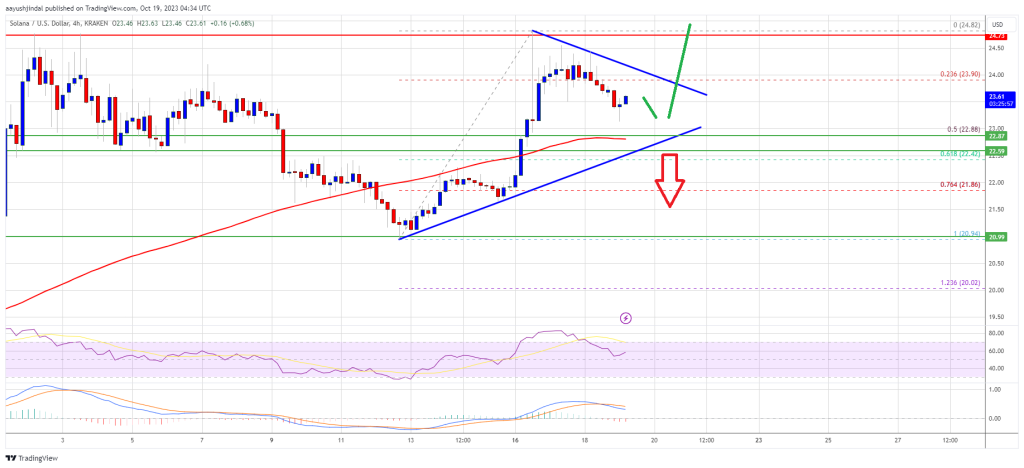
There was a move below the $24.20 and $22.00 levels. The bears pushed the price below the 23.6% Fib retracement level of the upward move from the $20.94 swing low to the $24.82 high. There is also a key contracting triangle forming with resistance near $23.90 on the 4-hour chart of the SOL/USD pair.
SOL is now trading above $23.00 and the 100 simple moving average (4 hours). It is now showing positive signs and remains supported above the $22.00 pivot level.
Source: SOLUSD on TradingView.com
On the upside, immediate resistance is near the $24.00 level and the triangle region. The first major resistance is near the $24.00 level. The main resistance is still near the $25.00 zone. A successful close above the $25.00 resistance could set the pace for a larger increase. The next key resistance is near $28.50. Any more gains might send the price toward the $30.00 level.
Are Dips Limited in SOL?
If SOL fails to recover above the $24.00 resistance, it could continue to move down. Initial support on the downside is near the $22.85 level or the 50% Fib retracement level of the upward move from the $20.94 swing low to the $24.82 high.
The first major support is near the $22.40 level. If there is a close below the $22.40 support, the price could decline toward the $21.80 support. In the stated case, there is a risk of more downsides toward the $20.50 support in the near term.
Technical Indicators
4-Hours MACD – The MACD for SOL/USD is losing pace in the bearish zone.
4-Hours RSI (Relative Strength Index) – The RSI for SOL/USD is above the 50 level.
Major Support Levels – $22.85, and $22.40.
Major Resistance Levels – $23.90, $24.00, and $25.00.
Bitcoin’s Rising Dominance Rate Challenges Altcoin Boom From 2021
The ascent in bitcoin’s dominance rate is consistent with the bullish breakout in June, which marked the end of a prolonged range play between 38% and 48%.
SOL Price Prediction: Will Correction Trend Push Solana Under $20?
Solana is correcting gains from the $25 resistance against the US Dollar. SOL price could accelerate lower if there is a break below the $21 support.
- SOL price started a fresh decline after it failed to clear the $25 resistance against the US Dollar.
- The price is now trading below $22.00 and the 100 simple moving average (4 hours).
- There is a key bearish trend line forming with resistance near $22.00 on the 4-hour chart of the SOL/USD pair (data source from Kraken).
- The pair could break the $21 support and accelerate lower toward $18.80.
Solana Price Visits Key Support
After a steady increase, Solana struggled to clear the $25 resistance zone. SOL formed a high at $24.77 and recently started a fresh decline.
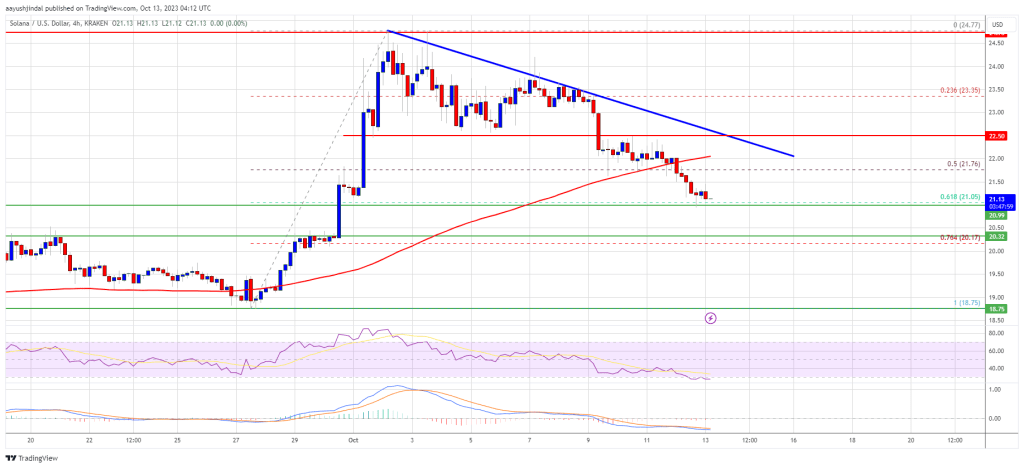
There was a move below the $24.00 and $23.50 levels. The bears pushed the price below the 50% Fib retracement level of the upward move from the $18.75 swing low to the $24.77 high. There is also a key bearish trend line forming with resistance near $22.00 on the 4-hour chart of the SOL/USD pair.
SOL is now trading below $22.00 and the 100 simple moving average (4 hours). It is also showing bearish signs below $22, like Bitcoin and Ethereum.
However, the bulls are now protecting the $21.00 support. It is near the 61.8% Fib retracement level of the upward move from the $18.75 swing low to the $24.77 high. On the upside, immediate resistance is near the $22.00 level and the trend line.
Source: SOLUSD on TradingView.com
The first major resistance is near the $22.50 level. A clear move above the $22.50 resistance might send the price toward the $23.50 resistance. The next key resistance is near $24.00. Any more gains might send the price toward the $25.00 level.
More Losses in SOL?
If SOL fails to recover above the $22.00 resistance, it could continue to move down. Initial support on the downside is near the $21.00 level.
The first major support is near the $20.30 level. If there is a close below the $20.00 support, the price could decline toward the $20.00 support. In the stated case, there is a risk of more downsides toward the $18.80 support in the near term.
Technical Indicators
4-Hours MACD – The MACD for SOL/USD is gaining pace in the bearish zone.
4-Hours RSI (Relative Strength Index) – The RSI for SOL/USD is below the 50 level.
Major Support Levels – $21.00, and $20.30.
Major Resistance Levels – $22.00, $22.50, and $24.00.
SOL Price Prediction: Solana Surges 15%, Is This Just Start Of A Larger Increase?
Solana is surging above the $23.50 resistance against the US Dollar. SOL price could accelerate further higher if it clears the $25.00 resistance zone.
- SOL price is up over 15% and it is showing signs of bullish continuation against the US Dollar.
- The price is now trading below $23.00 and the 100 simple moving average (4 hours).
- There is a key bullish trend line forming with support near $23.10 on the 4-hour chart of the SOL/USD pair (data source from Kraken).
- The pair could rise further higher if it clears the $25 resistance zone.
Solana Price Starts Fresh Rally
In the past few days, Solana’s price formed a strong support base above the $18.80 level. SOL started a strong increase after it settled above the $22 resistance zone.
There was a steady increase above the $23.20 resistance, outpacing Bitcoin and Ethereum. It is up over 15% and there was a test of the $24.50 resistance. A high is formed near $24.47 and the price is now consolidating gains. SOL is well above the 23.6% Fib retracement level of the upward move from the $18.75 swing low to the $24.47 high.
It is also trading below $23.00 and the 100 simple moving average (4 hours). Besides, there is a key bullish trend line forming with support near $23.10 on the 4-hour chart of the SOL/USD pair.
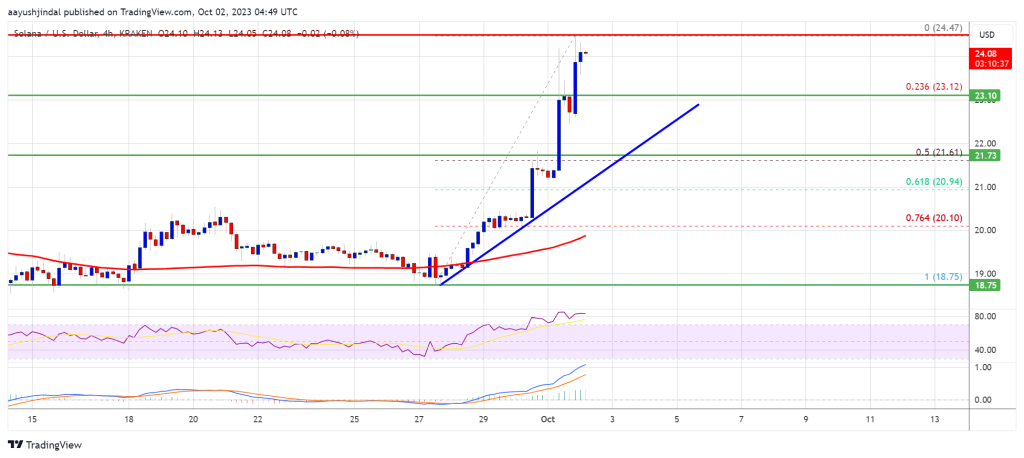
Source: SOLUSD on TradingView.com
On the upside, immediate resistance is near the $24.50 level. The first major resistance is near the $25.00 level. A clear move above the $25 resistance might send the price toward the $27.20 resistance. The next key resistance is near $28.80. Any more gains might send the price toward the $30 level.
Downside Correction in SOL?
If SOL fails to settle above $24.50 and $25.00, it could start a downside correction. Initial support on the downside is near the $23.20 level and the trend line.
The first major support is near the $21.50 level or the 50% Fib retracement level of the upward move from the $18.75 swing low to the $24.47 high. If there is a close below the $21.50 support, the price could decline toward the $20.50 support. In the stated case, there is a risk of more downsides toward the $20.00 support in the near term.
Technical Indicators
4-Hours MACD – The MACD for SOL/USD is gaining pace in the bullish zone.
4-Hours RSI (Relative Strength Index) – The RSI for SOL/USD is above the 50 level.
Major Support Levels – $23.20, and $21.50.
Major Resistance Levels – $24.50, $25.00, and $27.20.
SOL Price Prediction: Solana At Make-Or-Break Moment, Key Levels To Watch
Solana is eyeing a fresh increase above the $19.00 resistance against the US Dollar. SOL price must settle above $19 and $20 to start a fresh increase.
- SOL price is attempting a bullish breakout above the $19 resistance against the US Dollar.
- The price is now trading below $20 and the 100 simple moving average (4 hours).
- There is a major bearish trend line forming with resistance near $18.80 on the 4-hour chart of the SOL/USD pair (data source from Kraken).
- The pair could gain bullish momentum if it settles above the trend line and $20.
Solana Price Eyes Bullish Breakout
In the past few days, Solana’s price extended its decline below the $22 support. SOL even traded below the $20 level to move further into a bearish zone.
Finally, it tested the $17.40 zone. A low was formed near $17.37 and the price is now attempting a fresh increase, like Bitcoin and Ethereum. There was a move above the $18.50 resistance zone. The price even spiked above the 50% Fib retracement level of the downward move from the $20.60 swing high to the $17.37 low.
However, the bears are protecting a close above the $19 resistance. There is also a major bearish trend line forming with resistance near $18.80 on the 4-hour chart of the SOL/USD pair.
Solana is now trading below $20 and the 100 simple moving average (4 hours). On the upside, immediate resistance is near the $19.00 level. The first major resistance is near the $19.40 level or the 100 simple moving average (4 hours). It is close to the 61.8% Fib retracement level of the downward move from the $20.60 swing high to the $17.37 low.
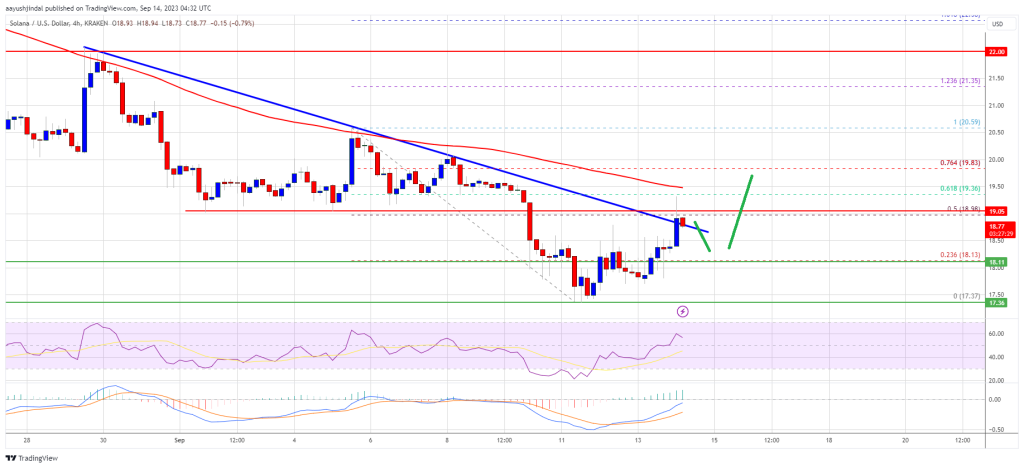
Source: SOLUSD on TradingView.com
The next key resistance is near $20. A clear move above the $20 resistance might send the price toward the $21.20 resistance. Any more gains might send the price toward the $22 level.
Another Decline in SOL?
If SOL fails to settle above $19.00 and $19.40, it could start another decline. Initial support on the downside is near the $18.10 level.
The first major support is near the $17.40 level. If there is a close below the $17.40 support, the price could decline toward the $16.50 support. In the stated case, there is a risk of more downsides toward the $15.00 support in the near term.
Technical Indicators
4-Hours MACD – The MACD for SOL/USD is gaining pace in the bullish zone.
4-Hours RSI (Relative Strength Index) – The RSI for SOL/USD is above the 50 level.
Major Support Levels – $18.10, and $17.40.
Major Resistance Levels – $19.00, $19.40, and $20.00.
SOL Price Prediction: Solana Takes Hit and Could Dive To $15
Solana is gaining bearish momentum below $20 against the US Dollar. SOL price is struggling and could drop further toward $16.50 or even $15.00.
- SOL price is showing bearish signs below $20.00 and $20.50 against the US Dollar.
- The price is now trading below $20 and the 100 simple moving average (4 hours).
- There is a major bearish trend line forming with resistance near $19.20 on the 4-hour chart of the SOL/USD pair (data source from Kraken).
- The pair could continue to down if there is a close below the $17.80 support.
Solana Price Drops Further
In the past few days, Solana’s price made a couple of attempts to clear the $22.00 resistance. However, SOL failed to gain strength for a move above the $22.00 level.
As a result, there was a fresh bearish reaction below the $21.20 support, like Bitcoin and Ethereum. More importantly, FTX’s news of a possible selling of SOL is also putting a lot of pressure on the bulls. The price gained bearish momentum and traded below the $20.00 support.
Finally, it found support near $17.80. A low is formed near $17.78 and the price is now consolidating losses. SOL is now trading below $20 and the 100 simple moving average (4 hours).
Besides, there is a major bearish trend line forming with resistance near $19.20 on the 4-hour chart of the SOL/USD pair. On the upside, immediate resistance is near the $18.50 level or the 23.6% Fib retracement level of the downward move from the $20.59 swing high to the $17.78 low.
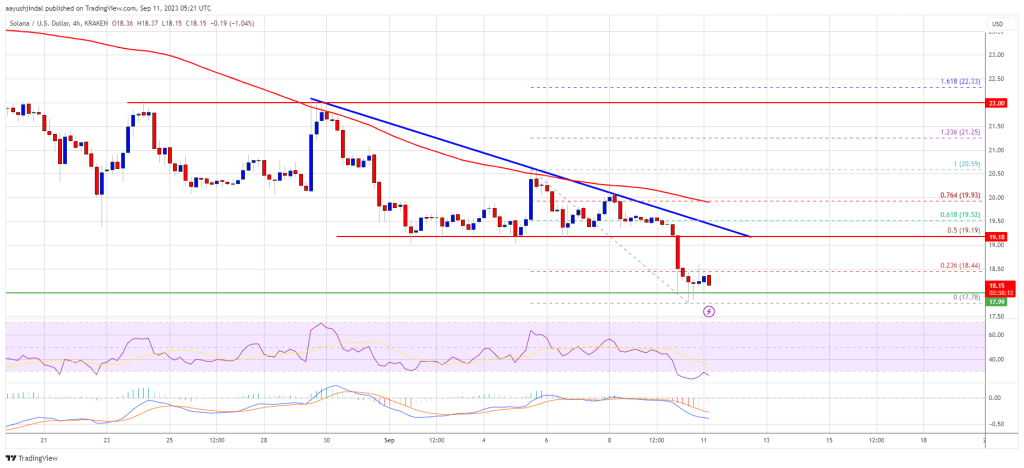
Source: SOLUSD on TradingView.com
The first major resistance is near the $19.20 level or the trend line. The next key resistance is near the 76.4% Fib retracement level of the downward move from the $20.59 swing high to the $17.78 low at $20.00. A clear move above the $20.00 resistance might send the price toward the $21.20 resistance. Any more gains might send the price toward the $22 level.
More Losses in SOL?
If SOL fails to clear the $19.20 resistance, it could continue to move down. Initial support on the downside is near the $17.80 level.
The first major support is near the $17.20 level. If there is a close below the $17.20 support, the price could decline toward the $16.50 support. In the stated case, there is a risk of more downsides toward the $15.00 support in the near term.
Technical Indicators
4-Hours MACD – The MACD for SOL/USD is gaining pace in the bearish zone.
4-Hours RSI (Relative Strength Index) – The RSI for SOL/USD is below the 50 level.
Major Support Levels – $17.80, and $17.20.
Major Resistance Levels – $19.20, $20.00, and $22.00.
Bitcoin Set to Form Death Cross as Dollar Index Teases Golden Crossover
A death cross indicates a potential long-term bearish shift in momentum while a golden cross suggests the opposite.
SHIB Price Prediction: Here’s What Could Trigger Recovery In Shiba Inu
SHIB price (Shiba Inu) is struggling below the $0.000008 resistance against the US Dollar. Shiba Inu could start a recovery wave if it settles above $0.000008.
- Shiba Inu price extended its decline and tested the $0.0000074 zone against the US Dollar.
- The price is now trading below $$0.000008 and the 100 simple moving average (4 hours).
- There is a key bearish trend line forming with resistance near $0.0000077 on the 4-hour chart of the SHIB/USD pair (data source from Kraken).
- The pair could start a recovery wave if it clears the $0.0000078 and $0.0000080 levels.
SHIB Price Faces Uphill Task
In the past few days, SHIB price saw a steady decline below the $0.0000088 level. The bears were able to push the price below the key support at $0.0000080.
Finally, Shiba Inu found support near the $0.0000074 zone. A low is formed near $0.00000739 and the price is now attempting a recovery wave, like Bitcoin and Ethereum. It is now consolidating near the 23.6% Fib retracement level of the downward move from the $0.00000845 swing high to the $0.00000739 low.
However, SHIB price is trading below $$0.000008 and the 100 simple moving average (4 hours). Besides, there is a key bearish trend line forming with resistance near $0.0000077 on the 4-hour chart of the SHIB/USD pair.
On the upside, the bears are protecting the $0.0000077 level and the trend line. The next major resistance is near the $0.0000078 level or the 50% Fib retracement level of the downward move from the $0.00000845 swing high to the $0.00000739 low.
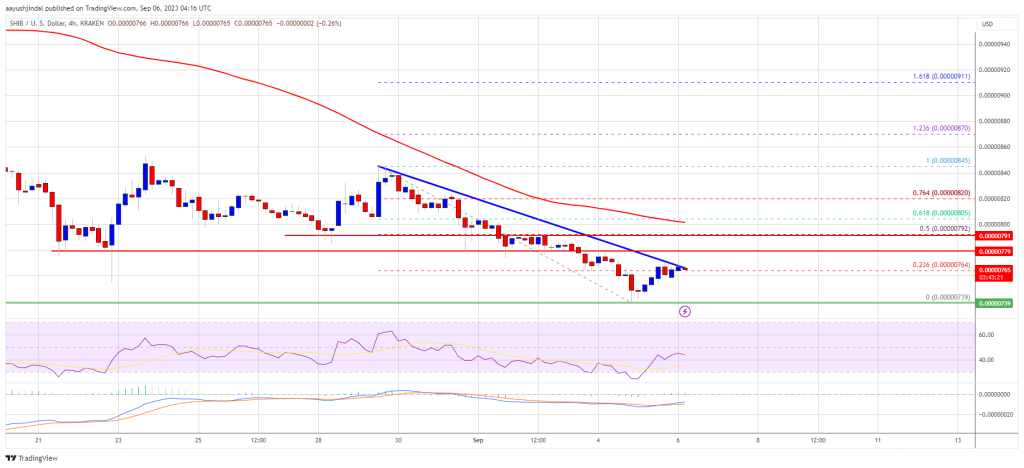
Source: SHIBUSD on TradingView.com
The main resistance is now forming near the $0.0000080 level. A close above the $0.0000080 level might send the price toward the $0.0000088 level. Any more gains might send the price towards the $0.0000092 level.
More Losses In Shiba Inu?
If Shiba Inu price fails to clear the $0.0000078 resistance, it could start another decline. Initial support on the downside is near the $0.0000075 level.
The first major support is near the $0.0000074 level. The next major support is near the $0.0000072 level. If there is a downside break below the $0.0000072 support, there could be an extended decline towards the $0.0000070 zone.
Technical Indicators
4 Hours MACD – The MACD for SHIB/USD is losing pace in the bearish zone.
4 Hours RSI (Relative Strength Index) – The RSI for SHIB/USD is currently below the 50 level.
Major Support Levels – $0.0000075 and $0.000074.
Major Resistance Levels – $0.0000078, $0.0000080 and $0.0000088.
Bitcoin Bulls Face Setback as Monthly Stochastic Indicator Turns Lower: Analyst
At the end of August, bitcoin confirmed an overbought downturn in its monthly stochastic, a signal that has previously marked market peaks.
Bitcoin, Ethereum Show More Potential For Downside Despite Recent Bounce – Analyst
A prominent cryptocurrency analyst, Bluntz, has expressed skepticism about the recent uptrend that increased Bitcoin and Ethereum prices by more than 5%. The pseudonymous analyst told his over 224,000 Twitter followers that the flagship crypto assets may face more downturns.
Applying the Elliott Wave theory in his analysis, Bluntz predicted that Ethereum is about to complete a five-wave pattern. According to him, Ethereum will decline to $1,450 on completing the wave pattern marked 1, 2, 3, 4, and 5.
Bitcoin And Ether Could Face More Downturn Before A Bounce
In Bluntz’s technical analysis, the five-wave chart pattern exists within a larger three-wave pattern marked A, B, and C. And this three-wave pattern is also on a downtrend. He noted that ETH and BTC must complete this wave pattern before a bullish upturn.
However, while this analysis projects a bearish trend for ETH and BTC, Bluntz believes there is potential for a bullish breakout. He said the theory becomes invalid if ETH breaks above $1,804 or Bitcoin surpasses the $28,770 price level.
Bluntz noted:
Invalidation of this thesis is if we break $1,804 for ETH or $28,770 for BTC as wave-4 can’t go within wave-1 territory,
Bears Intent On More Downturns For ETH And BTC; Any Hope For A Rebound?
Meanwhile, Bitcoin and Ethereum are exhibiting a slightly bearish outlook at press time. Bitcoin trades at $27,211, with a nearly 1% decline, while Ethereum price is down by 0.89%, at $1,704. Bitcoin had also been under bearish pressure over the past seven days after slipping off the $29,000 support level on August 16.
As the bears pressed on, the flagship cryptocurrency traded within the $26,000 price level, occasionally regressing to $25,900. The downturn was in tune with the bearish sentiment in the cryptocurrency market over the past few days.
However, on August 29, the news of the court ruling in favor of Grayscale Investment in its case against the US SEC broke out. This news generated a buzz in the crypto market, leading to an uptick in market capitalization.
As a result, Bitcoin recorded a sharp spike that returned its value to the $28,000 price mark. At the time, BTC’s price surged 8%, climbing from a week low of $25,860 to a high of $28,010. But the bulls couldn’t sustain the momentum as Bitcoin quickly regressed, dipping to $27,394.
Bitcoin now consolidates around the $27,000 price zone, awaiting a bullish turn to trigger a rally.
Ethereum Market Outlook
Ethereum also met a similar fate as Bitcoin, exhibiting the same chart pattern and price movement in the last week. The second-largest cryptocurrency by market cap remained on a bearish trend in line with the broader crypto market.
Ether’s price slipped off the $1,800 support on August 17, accompanied by a prolonged bearish momentum that pushed it to $1,600.
Just like Bitcoin, Ethereum reacted to the brief market recovery, pushing above $1,740 on August 29. While ETH’s rally has relapsed, it maintains a price level above $1,700, holding over 2% of its past week’s gains. However, ETH’s latest strides suggest the bulls are up for a recovery.
Ether Heads for ‘Death Cross’
Bitcoin Looks Most Oversold Since Covid Crash, Key Indicator Suggests
Bitcoin’s relative strength index has dropped well below 30 to its strongest oversold reading since March 2020.
Bitcoin and U.S. Real Yield Reach Strongest Inverse Correlation Since April
Bitcoin fell over 10% last week as the yield on the 10-year inflation-indexed security rose to the highest since 2009.
Bitcoin’s 2023 Bullish Trendline in Focus as Traders Search for Directional Clues
A bullish trendline is a an upward-sloping diagonal line connecting two or more higher price lows.


