Ripple Getting Bullish, Positive Trends Point To A Solid Year For XRP

Today’s Ripple price analysis is rather cloudy, and analysts are expecting the market to reverse course near the $0.90 level.

After being dragged down from recent highs, the XRP/USD pair may be on the verge of a new bottom.

Ripple’s market value is increasing over the last several days, with the price of Ripple climbing to roughly $0.88 before sliding down to Friday’s $0.83 level.

Compared to Bitcoin, XRP is up 5.62% in the XRP/BTC trading pair for the day. Crypto analysts project that this is only the beginning of a long-term positive trend they expect to continue in the coming days.

In the meantime, the XRP/ETH trading pair is up 6.83%. After a recent surge in value, Ripple has recovered its place as the sixth-largest cryptocurrency globally.

XRP Seen To Regain Solid Grounds

XRP is now overtaking Cardano and Solana in market cap. The price of XRP is seen to return to the $1 mark over the next few weeks, market observers said.

The price of Ripple is seeing an upward trajectory as traders look for bargains in the current trend.

The market capitalization has grown recently and should continue to do so over the next few days.

XRP total market cap is at $38.87 billion in the daily chart | Source: TradingView.com

Related Reading | Ripple Had Its Strongest Year Ever Despite The Sec’s “Attack On Crypto”

Optimism On Lawsuit Victory Causes Spike?

XRP is being (allegedly) marketed as an unregistered investment by Ripple, according to the U.S. Securities and Exchange Commission.

They believe that Ripple’s platform is not decentralized based on its involvement in financing the company.

XRP is rallying more than 30% in the last week following an order by a federal court judge in New York to open the documents.

There is a growing anticipation the sealed documents would show the crypto company received legal advice from an outside law firm stating XRP were not securities.

In 2020, the SEC sued Ripple, claiming that XRP is not a currency but a security, subject to stringent securities laws.

According to Reuters, U.S. District Judge Analisa Torres of Manhattan has ordered that the documents be unsealed on February 17.

Once made public, these papers will demonstrate that Ripple received legal advice in 2012 concluding that XRP was not an investment contract, Stuart Alderoty, Ripple General Counsel, disclosed.

In spite of XRP trading in a global market, it has taken the SEC eight years to suggest that they disagreed with that analysis, Alderoty points out.

Despite the lack of concrete results in the SEC vs. Ripple showdown, these events have nonetheless been a boom for XRP hodlers.

Therefore, the recent news is being interpreted as a fundamentally bullish event — and speculators are returning to XRP in droves.

Related Reading | XRP Builds Momentum With 7% Increase As Ripple Launches New ODL Partnership

Featured image from Global Crypto News, chart from TradingView.com

The Ethereum Foundation Sold At The Top Again. Did They Know Something We Didn’t?

Apparently, the Ethereum Foundation employs incredible traders. Once again, they managed to cash out at the very top. On November 16th, ETH was worth an all-time high of $4891. On the very next day, the Ethereum Foundation sent 20,000 ETH to Kraken and sold them. Is this suspicious at all? Not per se, but this is the second time that they pull the same magic move. 

Related Reading | Why The Ethereum Foundation Launched A Client Incentive Program

A professional trader that goes by the name Edward Morra on Twitter was the first to spot the trade. “Friendly reminder that ETH foundation cashed out at the top (again). ETH down 40+% since then,” he said. Morra also provided a chart that shows ETH’s sharp decline in price since the sale.

$ETHFriendly reminder that ETH foundation cashed out at the top (again). ETH down 40+% since then pic.twitter.com/Bp80hEDvK0

— Edward Morra (@edwardmorra_btc) January 21, 2022

To add insult to injury, the Ethereum Foundation only paid $20 in gas fees. That might be the most impressive feat of them all.

At the time of writing, the Ethereum Foundation’s wallet holds 353,318 ETH, which is approximately $835K at current prices.

What Do We Know About The Organization’s Previous Sell-Off?

Back to Morra, his Twitter followers told him that this information was of no use to them this late in the game. The trader surprised the world and pulled an ace up his sleeve. As it turns out, Morra tweeted about the trade at the time it happened. Not only that, he warned them, “They cashed out 35k ETH on 17th of May this year, marked on the chart.”

Casual 20k ETH cashout by EthDev, sent to Kraken:https://t.co/w6AbdeW2AJThey cashed out 35k ETH on 17th of May this year, marked on the chart 👇 pic.twitter.com/sTbUwHSzD4

— Edward Morra (@edwardmorra_btc) November 11, 2021

As you can see on the chart, on May 17th the price of ETH was near its previous peak. And after the Ethereum Foundation sold, ETH trended down for months and months. Is this a coincidence? Does the foundation employ great traders? Or, is there something else to this story? Did they dump on retail ETH holders? Did the Ethereum Foundation know anything that the rest of the world didn’t?

The Ethereum Foundation still holds 394,787 ETH, and Vitalik said he persuaded foundation to sell 70,000 ETH at the top of 2018 to support the work of developers. This is a normal operation, but it also means that the Foundation thought that bear market is coming.

— Wu Blockchain (@WuBlockchain) May 21, 2021

At the time of the first sell-off, journalist Colin Wu highlighted the trade and said, “The Ethereum Foundation transferred 35,000 Eth to the Kraken Exchange on May 17. Vitalik said bubbles could have ended already on May 20.” Analyzing the move, Wu said, “This is a normal operation, but it also means that the Foundation thought that bear market is coming.”

The gas fee for this operation was 0.00240474 ETH, or $5.66 at the time of writing. Wow.

ETH price chart for 01/25/2022 on Bitfinex | Source: BTC/USD on TradingView.com
What’s The Ethereum Foundation Anyway?

According to Ethereum’s official site:

“The EF is not a company, or even a traditional non-profit. Their role is not to control or lead Ethereum, nor they are the only organization that funds critical development of Ethereum-related technologies. The EF is one part of a much larger ecosystem.”

The Ethereum Foundation distributes funds to developers via the Ecosystem Support Program and the Fellowship Program, organizes Devcom, and more. To do all that, they surely need Fiat currency in some capacity. The trade makes sense from that angle.

Related Reading | Ethereum Foundation Devs Discuss ETH2 Launch & Economics

The question, though, is, did they know that a crash was coming? And if they did, did they reach that conclusion through technical and on-chain analysis or by… other methods?

Featured Image by PatriestB on Pixabay | Charts by TradingView

10 Bullish Monthly Bitcoin Price Charts To Start November

Bitcoin price closed the month of October with a higher high on the candle closing, a feat that has throughout history always led to a renewed bull run and additional all-time highs.

Coinciding with the November monthly open, here are ten bullish Bitcoin price charts that suggest bullish continuation is ahead – but also warns that the eventual end to the market cycle is near as well.

Ten Bullish Monthly Bitcoin Price Charts

The leading cryptocurrency by market cap has made a higher high on the highest timeframes – a clear signal that the trend has yet to conclude. By pure definition, an uptrend is a series of higher highs and higher lows. The two boxes have been checked by Bitcoin, and it is time for the market to respond.

Below you’ll find ten monthly Bitcoin price charts and the bullish factors they exhibit. For all of the bullish technicals, there are two important things to note. When the move ahead appears this obvious and the crowd expects it to happen, the market often does the opposite. Also, such overheated monthly technical indicators – as bullish as they may be – signal the end is also near.

Relative Strength Index (RSI)

The Relative Strength Index measures the strength of an asset’s underlying price action and can tell analysts when an asset is overbought or oversold. A reading of under 30 suggests conditions are oversold – something that’s never happened on monthly timeframes when trading the first ever cryptocurrency.

Above 70 typically suggests an asset is overbought and its time to sell. But on monthly timeframes in Bitcoin, this only has indicated in the past when FOMO is at the highest, and buying is in a frenzy. There is no telling when the top might form based on the monthly, only that a peak is near and will happen closer to the previous RSI top set back in April this year.

Ichimoku

The Ichimoku can be a confusing tool to look at if you don’t know how to read it. But in the right hands (or with the right set of eyes), the tool gives the clearest signals of all. Note how the lagging span, projected backward behind price in green – which is used to highlight support and resistance – set a higher high similar to the 2013 mid-cycle peak. The 2013 finale or the 2017 cycle top did not.

Bitcoin price is also above both the conversion line and the base line, which is a bullish signal in and of itself. These lines are also crossed bullish, and the cloud has a tiny bullish twist suggesting a short pulse of bullish momentum ahead.

Parabolic SAR

Before we get into more complex signals and technical indicators, we’ll stop (pun intended) quickly at the Parabolic SAR, created by J. Welles Wilder, one of the pioneers of technical analysis.

Related Reading | Bitcoin Price Prepares To Blast Off Back Into RSI “Bull Zone”

SAR stands for “stop and reverse” and it tells an analyst when a trend has done so. Notice that at the mid-cycle peak in both 2013 and 2021, the rally then restarted after just four months of downtrend according to the Parabolic SAR.

Fisher Transform

The Fisher Transform is a tool that normalizes price movements to filter out noise and make points of reversal or price extremes easier to spot, based on standard deviations.

The mid-cycle pullback in Bitcoin price happened to reach the same standard deviation as the 2013 bull cycle, a level that also briefly held as support in 2017. A bearish divergence with a lower high on the indicator while price pushes higher would be a signal that the bear market is here.

Keltner Channel

No, these aren’t the Bollinger Bands, but the Keltner Channel is another volatility tool that, according to Investopedia, is designed to aid in trend recognition and spotting reversals.

The biggest factor suggesting a climax to the cycle is on the way, is the lack of the bottom band falling out as it has on past cycles when they’ve come to a conclusion. The market hasn’t seen anything yet in terms of volatility this cycle.

Super Guppy

This ribbon made of exponential moving averages (EMAs) makes it very clear when an asset is trending up. On the monthly timeframe, that’s pretty much been the only direction the cryptocurrency has ever known.

However, there is zero compression of the ribbon as past bear phases have shown, and Bitcoin price has closed a monthly candle above all of the EMAs signaling a strong trend is forming.

Williams Alligator

The Williams Alligator was created by early market psychology pioneer Bill Williams. It consists of three smoothed moving averages based on the Fibonacci sequence: 5, 8, 13. The three averages are called the tool’s Jaw, Teeth, and Lips.

The tool currently shows that the Alligator is feeding into the trend, with the moving averages diverging and moving upward – a clear sign of continuation.

Awesome Oscillator

The Awesome Oscillator is awesome because it gives simple signals. The momentum measuring tool can help to affirm trends and preempt market reversals, according to MoneyControl.

The histogram adding two green ticks as the price moves upward is a sign that the cycle hasn’t likely concluded, and is about to get a lot more awesome.

Donchian Channel

Another Bollinger Band lookalike, but this one works very differently. The Donchian Channel is based on Bitcoin’s Average True Range, and is depicted by the lower and upper bands. The middle-line is the market median, or what is likely a fair price for the cryptocurrency.

Passing above or below the media indicates the direction of the trend, which is still headed up. Confirming this further, is the fact that the upper and lower bands are starting to move up, showing that the Average True Range of Bitcoin is forever moving away from low prices set at the bear market bottom.

Money Flow Index (MFI)

The Money Flow Index signals when an asset is overbought or oversold similar to the RSI, but also takes into consideration volume data.

The addition of volume makes finding divergences easier. Comparing to the RSI at the top of the article, the second top of the 2013 double top on the indicator is significantly truncated on the MFI. The short, sharp spike was impactful during the 2013 finale, and could suggest that there isn’t much time left in the current bull cycle.

Related Reading | Want To Learn How To Read Bitcoin Price Charts? Click Here

(Cycle) Conclusion

There are a lot of bullish signals in Bitcoin price action currently on the highest timeframes. Elliott Wave Theory also has provided the roadmap for a potential wave 5 situation. However, the macro situation is bleak, and the cryptocurrency asset class remains speculative and ultra sensitive to things like regulation or Black Swan events.

There is also no telling where the music stops. Bitcoin price could fall short of expectations of $100,000 or higher, causing a sharper selloff and more severe bear market. The cryptocurrency could blast far past that barrier and then some. What is guaranteed, is that what goes up, must come down, and after the bull cycle parabola breaks down completely, the leading cryptocurrency by market cap is likely looking at around an 80% drop to the bottom.

Follow @TonySpilotroBTC on Twitter or join the TonyTradesBTC Telegram for exclusive daily market insights and technical analysis education. Please note: Content is educational and should not be considered investment advice.

Featured image from iStockPhoto, Charts from TradingView.com

Charted: Dogecoin (DOGE) Surges 50%, Here’s Why The Bulls Are Not Done Yet

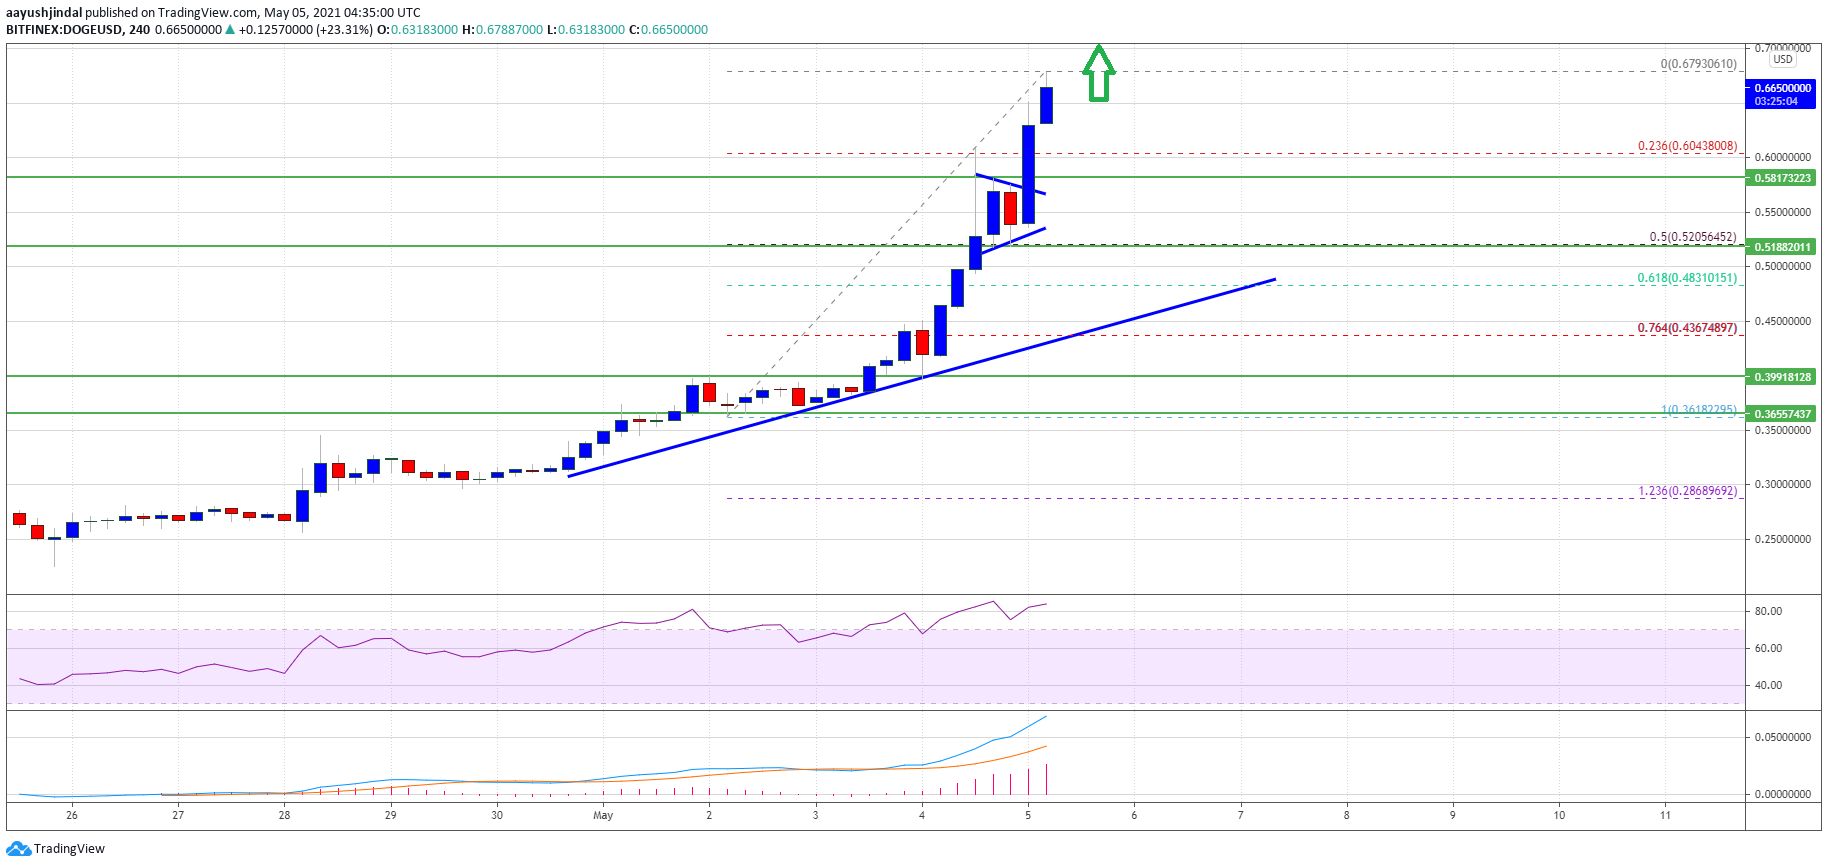
Dogecoin remained strong and it rallied further above $0.5000 against the US Dollar. DOGE surged over 50% and it traded to a new all-time high above $0.6500.

  • DOGE extended its rally and it cleared the $0.5000 and $0.5500 resistance levels against the US dollar.
  • The price is trading well above the $0.5000 zone and the 100 simple moving average (4-hours).
  • There is a key bullish trend line forming with support near $0.4800 on the 4-hours chart of the DOGE/USD pair (data source from Bitfinex).
  • The pair is likely to continue higher above the $0.6800 and $0.7000 levels in the near term.

Dogecoin Rallies To New ATH

Yesterday, we discussed the chances of more gains in dogecoin above the $0.5000 resistance zone. DOGE did gain pace above the $0.5000 resistance, outpacing bitcoin and ethereum.

It surged over 50% and it even cleared the $0.6500 level. A new all-time high is formed near the $0.6793, with a bullish angle. It is now trading well above the $0.5000 zone and the 100 simple moving average (4-hours).

An initial support is near the $0.6200 level. The first key support is near the $0.6050 level. It is close to the 23.6% Fib retracement level of the recent surge from the $0.3618 swing low to $0.6793 high. If there is a downside break below the $0.6000 support, the price could correct further.

Dogecoin (DOGE)

Source: DOGEUSD on TradingView.com

The main support is forming near the $0.5200 and $0.5000 levels. The 50% Fib retracement level of the recent surge from the $0.3618 swing low to $0.6793 high is also near $0.5200. Moreover, there is a key bullish trend line forming with support near $0.4800 on the 4-hours chart of the DOGE/USD pair. Any more losses could open the doors for a move towards the $0.4000 level.

More Gains in DOGE?

If DOGE price remains stable above the $0.6000 support, there are chances of more gains. An initial resistance on the upside is near the $0.6750 level.

The first major resistance is near the $0.7000 level. Any more gains above the $0.7000 zone could encourage the bulls to aim a test the important $1 level.

Technical Indicators

4-Hours MACD – The MACD for DOGE/USD is now gaining momentum in the bullish zone.

4-Hours RSI (Relative Strength Index) – The RSI for DOGE/USD is now in the overbought zone.

Major Support Levels – $0.6500, $0.6050 and $0.6000.

Major Resistance Levels – $0.6750, $0.7000 and $0.8000.

Charted: Dogecoin (DOGE) Beats Bitcoin, Why It Could Test $0.5

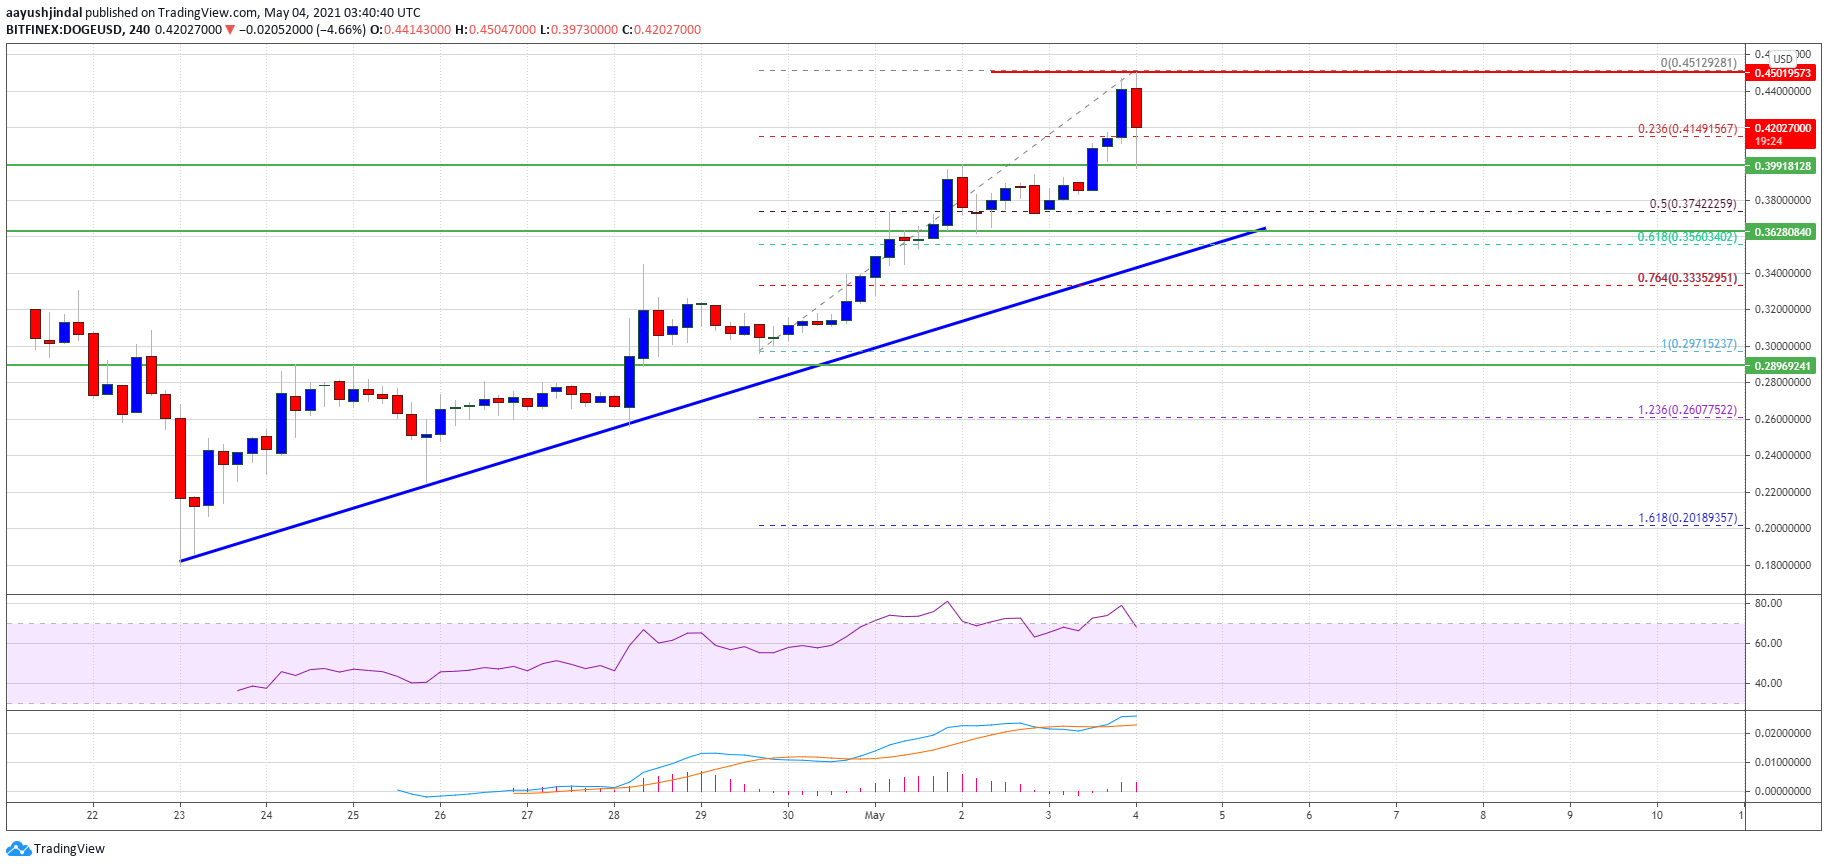
Dogecoin extended its rally above the $0.4000 resistance against the US Dollar. DOGE tested the $0.4500 zone and it is likely to continue higher in the near term.

  • DOGE gained bullish momentum above the $0.3500 and $0.4000 resistance levels against the US dollar.
  • The price is trading nicely above the $0.3000 support and the 100 simple moving average (4-hours).
  • There is a crucial bullish trend line forming with support near $0.3600 on the 4-hours chart of the DOGE/USD pair (data source from Bitfinex).
  • The pair is correcting gains, but dips are likely to remain limited below $0.3500.

Dogecoin Rallies To $0.45

After forming a base above the $0.2800 and $0.3000 levels, dogecoin started a fresh rally. It broke many important hurdles near the $0.3500 and $0.3550 levels, outperforming bitcoin.

DOGE rallied above the $0.4000 barrier and settled above the 100 simple moving average (4-hours). It tested the $0.4500 resistance zone and a high is formed near $0.4512. The price is now correcting gains and trading below the $0.4400 level.

It spiked below the $0.4200 support zone. There was a break below the 23.6% Fib retracement level of the recent rally from the $0.2971 swing low to $0.4512 high.

Dogecoin (DOGE)

Source: DOGEUSD on TradingView.com

On the downside, an initial support is near the $0.4000 level. The next major support is seen near the $0.3750 level. It is close to the 50% Fib retracement level of the recent rally from the $0.2971 swing low to $0.4512 high.

The main support is forming near the $0.3600 and $0.3500 levels. There is also a crucial bullish trend line forming with support near $0.3600 on the 4-hours chart of the DOGE/USD pair. Any more losses could open the doors for a move towards the $0.3000 level.

More Upsides in DOGE

If DOGE price remains stable above the $0.4000 support or the trend line, there are chances of more upsides. An initial resistance on the upside is near the $0.4350 level.

The first major resistance is near the $0.4500 level. Any more gains and a clear close above $0.4500 could set the pace for a rise towards the $0.5000 resistance zone.

Technical Indicators

4-Hours MACD – The MACD for DOGE/USD is now gaining momentum in the bullish zone.

4-Hours RSI (Relative Strength Index) – The RSI for DOGE/USD is now above the 50 level.

Major Support Levels – $0.4000, $0.3750 and $0.3600.

Major Resistance Levels – $0.4350, $0.4500 and $0.5000.

Charted: Dogecoin (DOGE) Eyes Fresh Surge Towards $0.40

Dogecoin started a fresh increase from the $0.2500 support against the US Dollar. DOGE is rising and the bulls seem to be eyeing an upside break above the $0.3500 resistance

  • DOGE is holding the ground above the $0.3000 and $0.2800 levels against the US dollar.
  • The price is trading nicely above the $0.3000 support and the 100 simple moving average (4-hours).
  • There is a major bullish trend line forming with support near $0.2950 on the 4-hours chart of the DOGE/USD pair (data source from Bitfinex).
  • The pair could start a strong rally once it clears the $0.3350 and $0.3500 resistance levels.

Dogecoin Eyes Fresh Surge

After forming a base above the $0.2000 and $0.2200 levels, dogecoin started a steady increase, similar to ethereum and unlike bitcoin. It broke many important hurdles near the $0.3000 level.

DOGE even settled above the $0.3000 support and the 100 simple moving average (4-hours). It spiked towards the $0.3500 level, where the bears took a stand. A high was formed near $0.3455 before the price started a downside correction.

There was a break below the $0.3200 support zone. The price declined below the 23.6% Fib retracement level of the recent surge from the $0.2562 swing low to $0.3455 high.

Dogecoin (DOGE)

Source: DOGEUSD on TradingView.com

However, the bulls remained active near the $0.3000 support zone. It also found support near the 50% Fib retracement level of the recent surge from the $0.2562 swing low to $0.3455 high. More importantly, there is a major bullish trend line forming with support near $0.2950 on the 4-hours chart of the DOGE/USD pair.

The price is rising and an immediate resistance is near the $0.3320 level. The main resistance is still near the $0.3500 level. A successful break above the $0.3500 level could lead the price towards the $0.4000 level in the near term.

Dips Supported in DOGE

If DOGE price fails to continue higher above $0.3320 or $0.3500, there could be a fresh decline. The first key support is near the $0.3200 level.

The next major support is near the $0.3000 level and the bullish trend line. Any more losses may perhaps open the doors for a move towards the $0.2500 support zone.

Technical Indicators

4-Hours MACD – The MACD for DOGE/USD is now gaining momentum in the bullish zone.

4-Hours RSI (Relative Strength Index) – The RSI for DOGE/USD is now above the 50 level.

Major Support Levels – $0.3200, $0.3000 and $0.2500.

Major Resistance Levels – $0.3320, $0.3500 and $0.4000.

Charted: THETA Rallies To Enter Top 10, Why It Could Test $20

THETA started a strong increase from the $6.50 support zone against the TetherUS. The price is now up over 25% and it is likely to continue higher above $15.00.

  • THETA started a strong rally above the $8.00 and $10.00 resistance levels against the TetherUS.
  • The price is trading nicely above $12.00 and the 100 simple moving average (4-hours).
  • There is a key bullish trend line forming with support near $10.00 on the 4-hours chart of the THETA/USD pair (data source from Kraken).
  • The pair is likely to continue higher if it clears the $15.00 and $15.50 resistance levels in the near term.

THETA Enters Top 10

After forming a support base above the $6.00 and $6.50 levels, THETA price started a sharp increase. It broke a couple of important hurdles near $10.00 to move into a solid uptrend, outperforming bitcoin and ethereum.

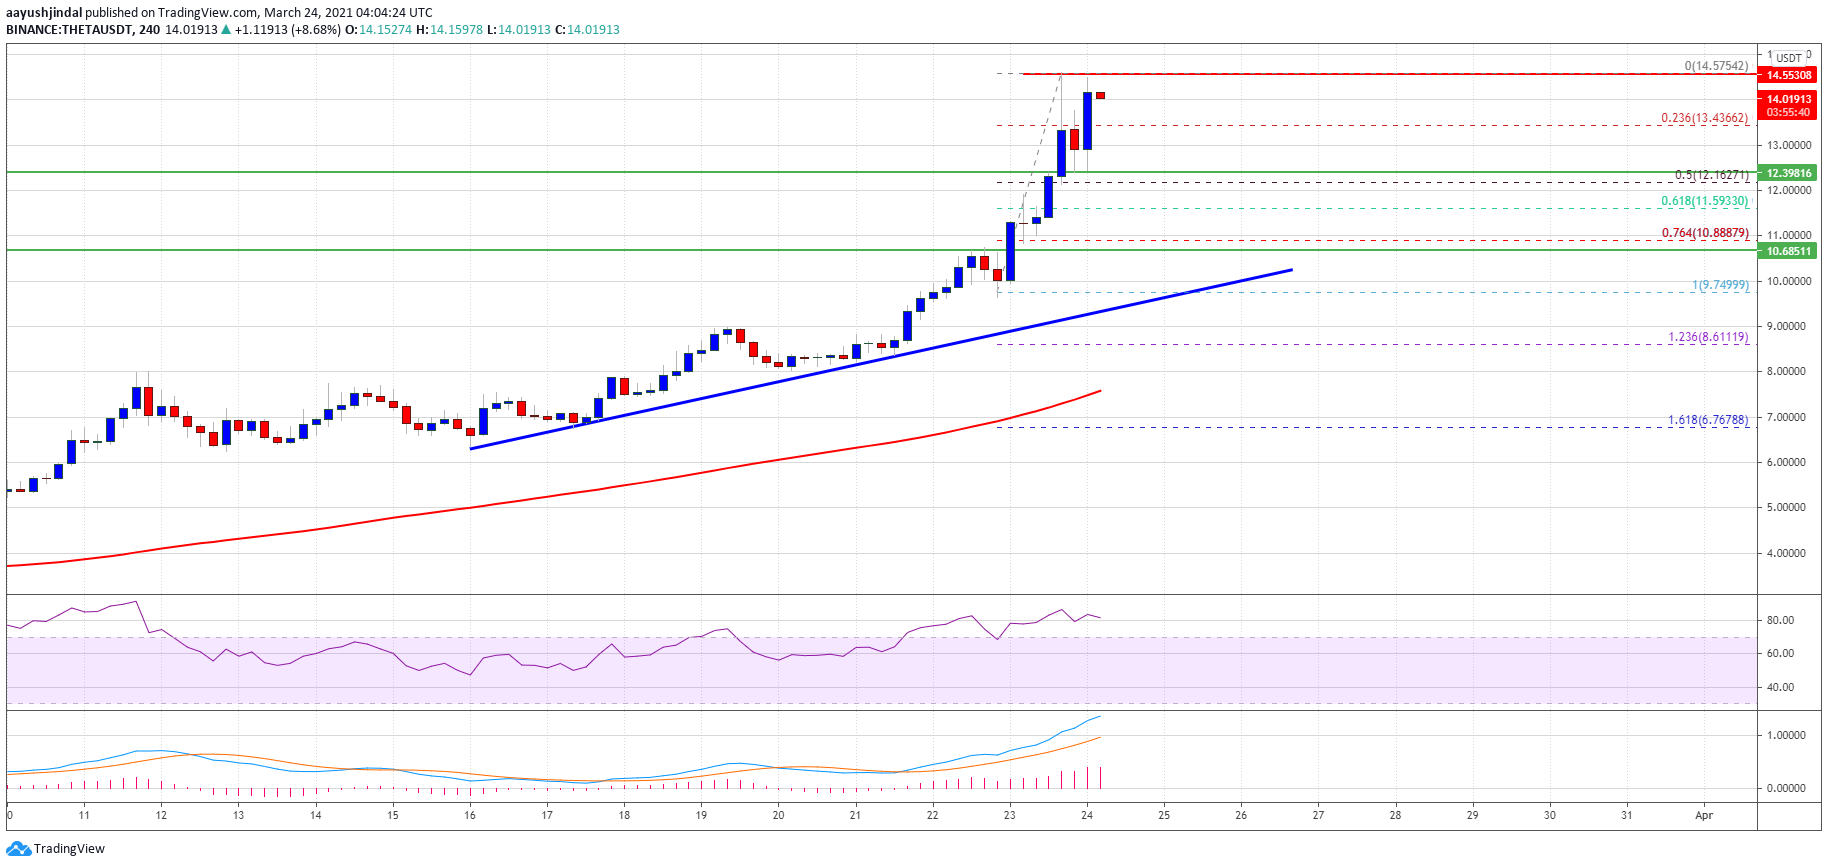
The price even cleared the $12.00 resistance and settled above the 100 simple moving average (4-hours). A new all-time high is formed near $14.57 and it has entered the top 10 cryptos by market cap. THETA is currently consolidating gains above the $13.50 support.

The 23.6% Fib retracement level of the upward move from the $9.74 low to $14.57 high is also near $13.50 to provide support. The next major support is near the $12.20 level.

THETA Price

Source: THETAUSDT on TradingView.com

The bulls are likely to protect the 50% Fib retracement level of the upward move from the $9.74 low to $14.57 high near $12.16 level. Moreover, there is a key bullish trend line forming with support near $10.00 on the 4-hours chart of the THETA /USD pair.

On the upside, the price is facing hurdles near $14.50 and $15.00. A close above the $15.00 level could open the doors for another increase and the price might surge towards the $18.50 and $20.00 levels.

Dips Supported?

If THETA price fails to climb above $15.00 or $15.50, it could correct lower. The first major support is near the $12.20 and $12.00 levels.

The main support is now forming near the $10.00 zone and the trend line. A downside break below the $10.00 support might open the doors for a push towards the $7.50 support.

Technical Indicators

4-Hours MACD – The MACD for THETA/USD is gaining momentum in the bullish zone.

4-Hours RSI (Relative Strength Index) – The RSI for THETA/USD is well above the 60 level.

Major Support Levels – $12.20, $12.00 and $10.00.

Major Resistance Levels – $14.50, $15.00 and $20.00.