UNI price turned red and declined below the $10.00 support. Uniswap is showing many bearish signs and recoveries could face hurdles near $10.00.
- UNI started a fresh decline below the $10.00 support zone.
- The price is trading below $9.50 and the 100 simple moving average (4 hours).
- There is a key bearish trend line forming with resistance near $10.25 on the 4-hour chart of the UNI/USD pair (data source from Kraken).
- The pair might recover but the upsides might be limited above $10.00.
UNI Price Takes Hit
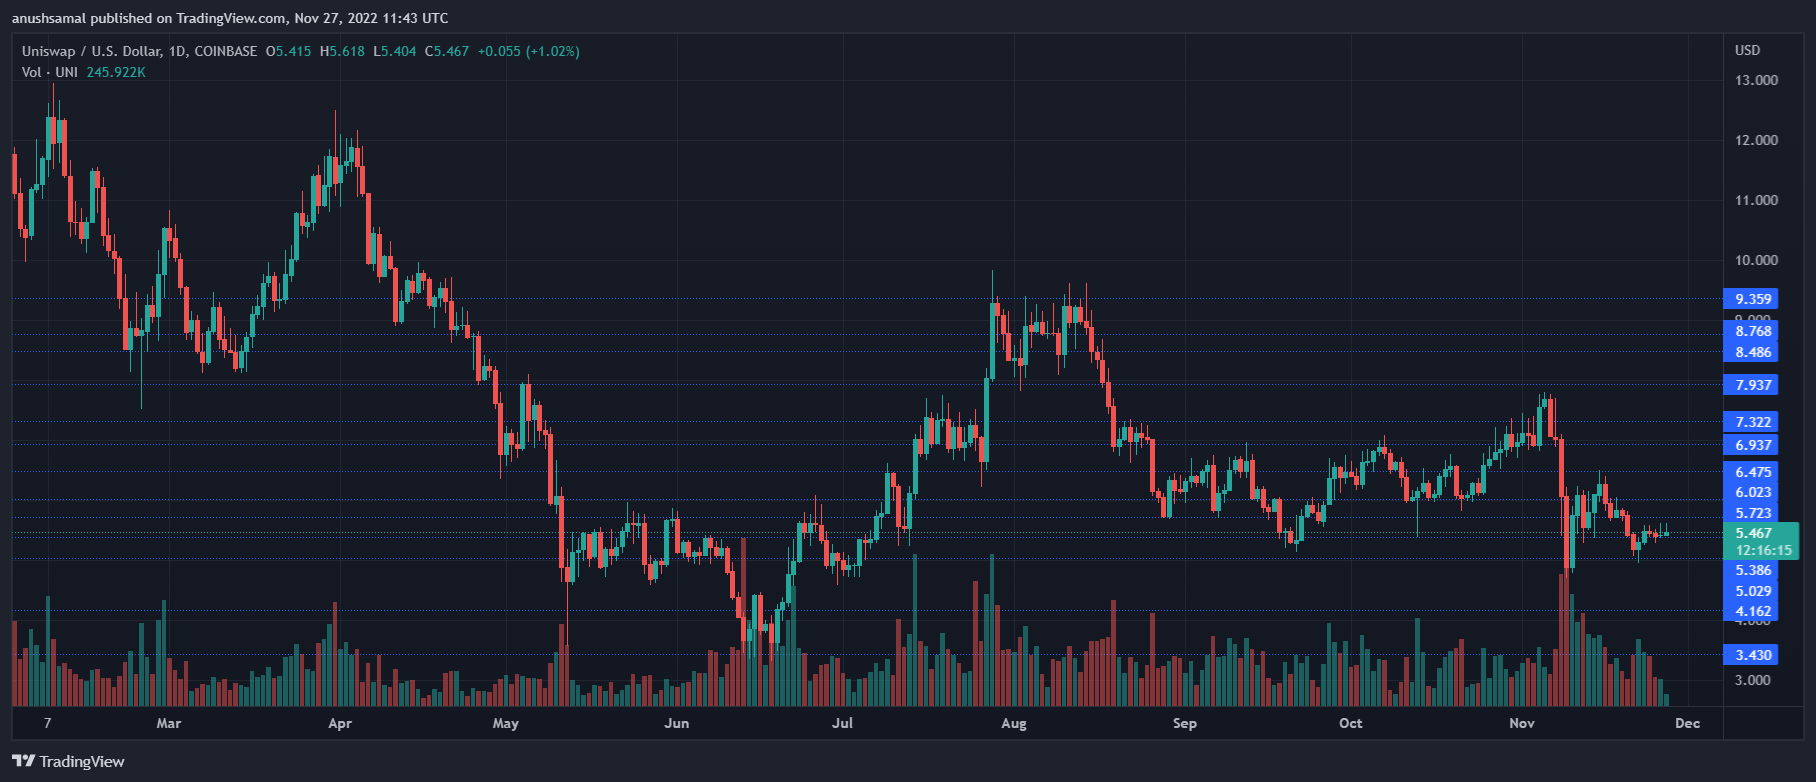
After the SEC news, UNI started a major decline. There was an increase in selling pressure on Uniswap below the $12.00 pivot level. The price declined over 15% and traded below the $10.00 support. It also increased some pressure on Bitcoin and Ethereum.
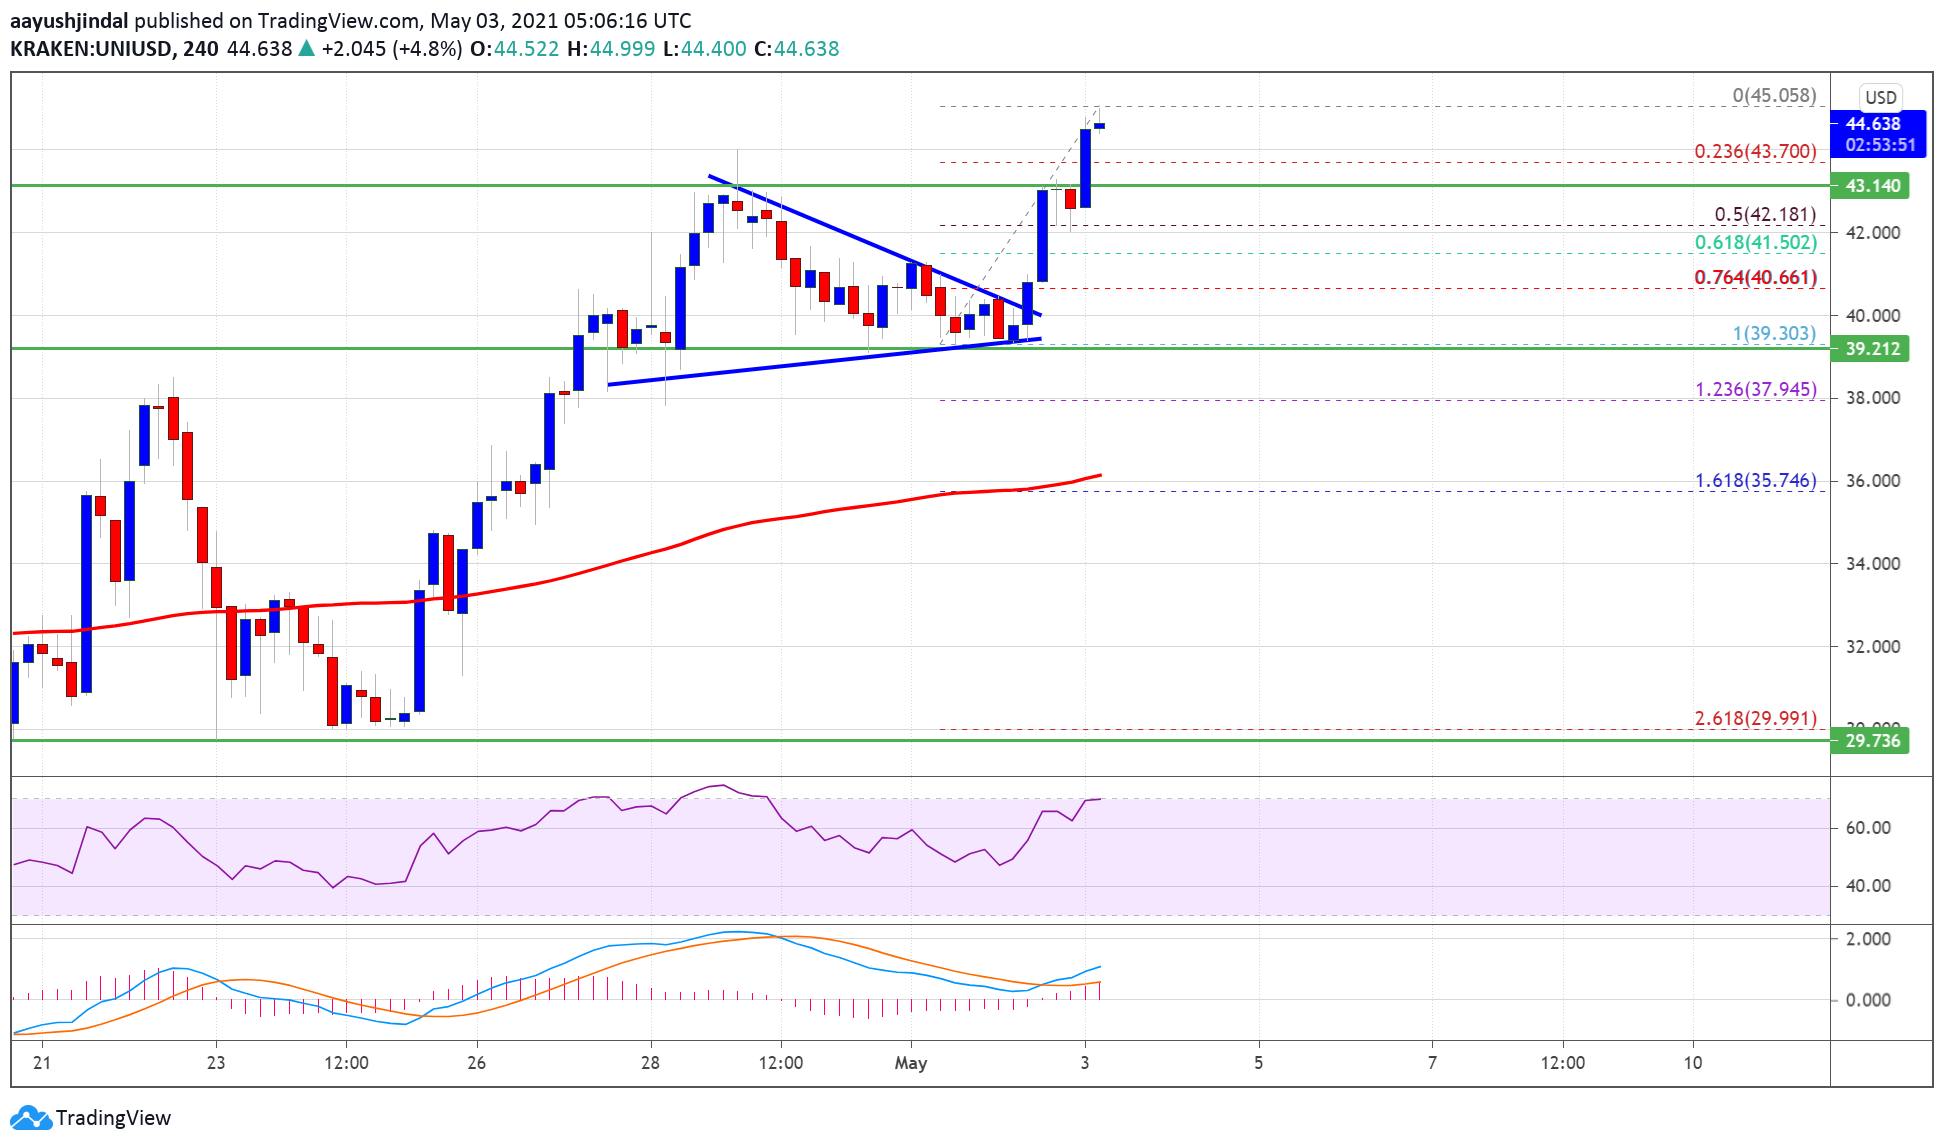
There was also a drop below the $9.20 level. The price traded as low as $8.72 and it is still showing many bearish signs. There is also a key bearish trend line forming with resistance near $10.25 on the 4-hour chart of the UNI/USD pair.
UNI price is now trading well below $10.00 and the 100 simple moving average (4 hours). Immediate resistance on the upside is near the $9.45 level. It is near the 23.6% Fib retracement level of the downward move from the $11.79 swing high to the $8.72 low.
The next key resistance is near the $10.25 level or the trend line. It coincides with the 50% Fib retracement level of the downward move from the $11.79 swing high to the $8.72 low.
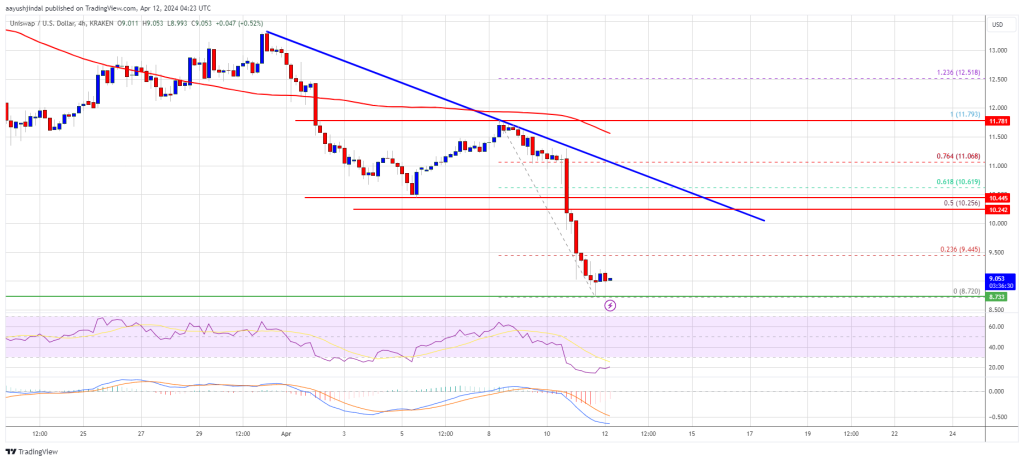
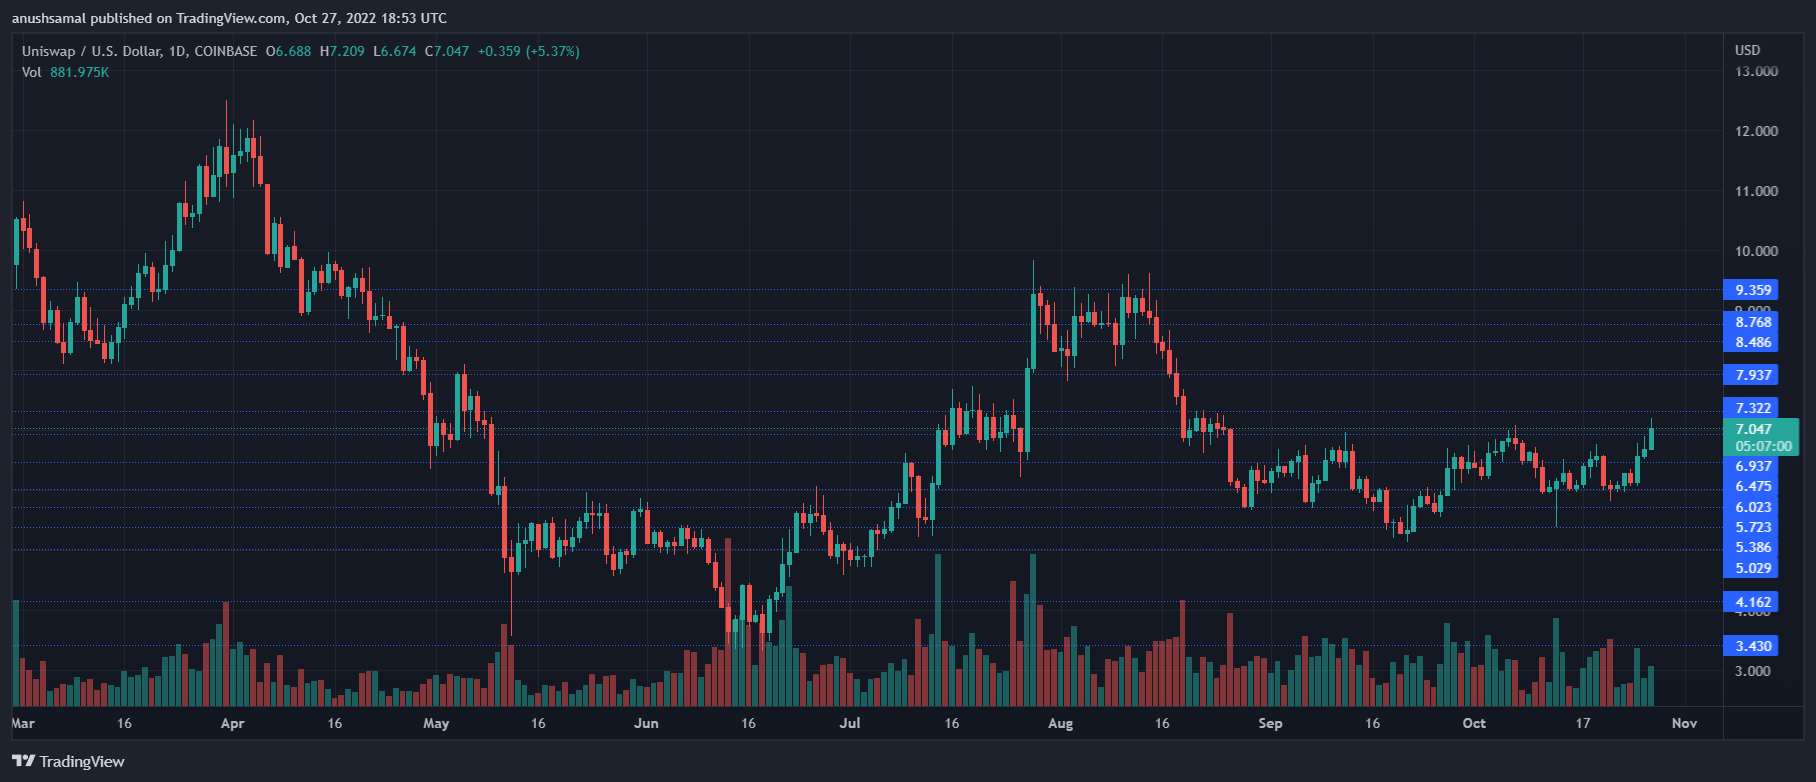
Source: UNIUSD on TradingView.com
A close above the $10.25 level could open the doors for more gains in the near term. The next key resistance could be near $11.80, above which the bulls are likely to aim a test of the $12.00 level. Any more gains might send UNI toward $13.50.
More Losses In Uniswap?
If UNI price fails to climb above $9.45 or $9.50, it could continue to move down. The first major support is near the $8.70 level.
The next major support is near the $8.50 level. A downside break below the $8.50 support might open the doors for a push toward $7.65.
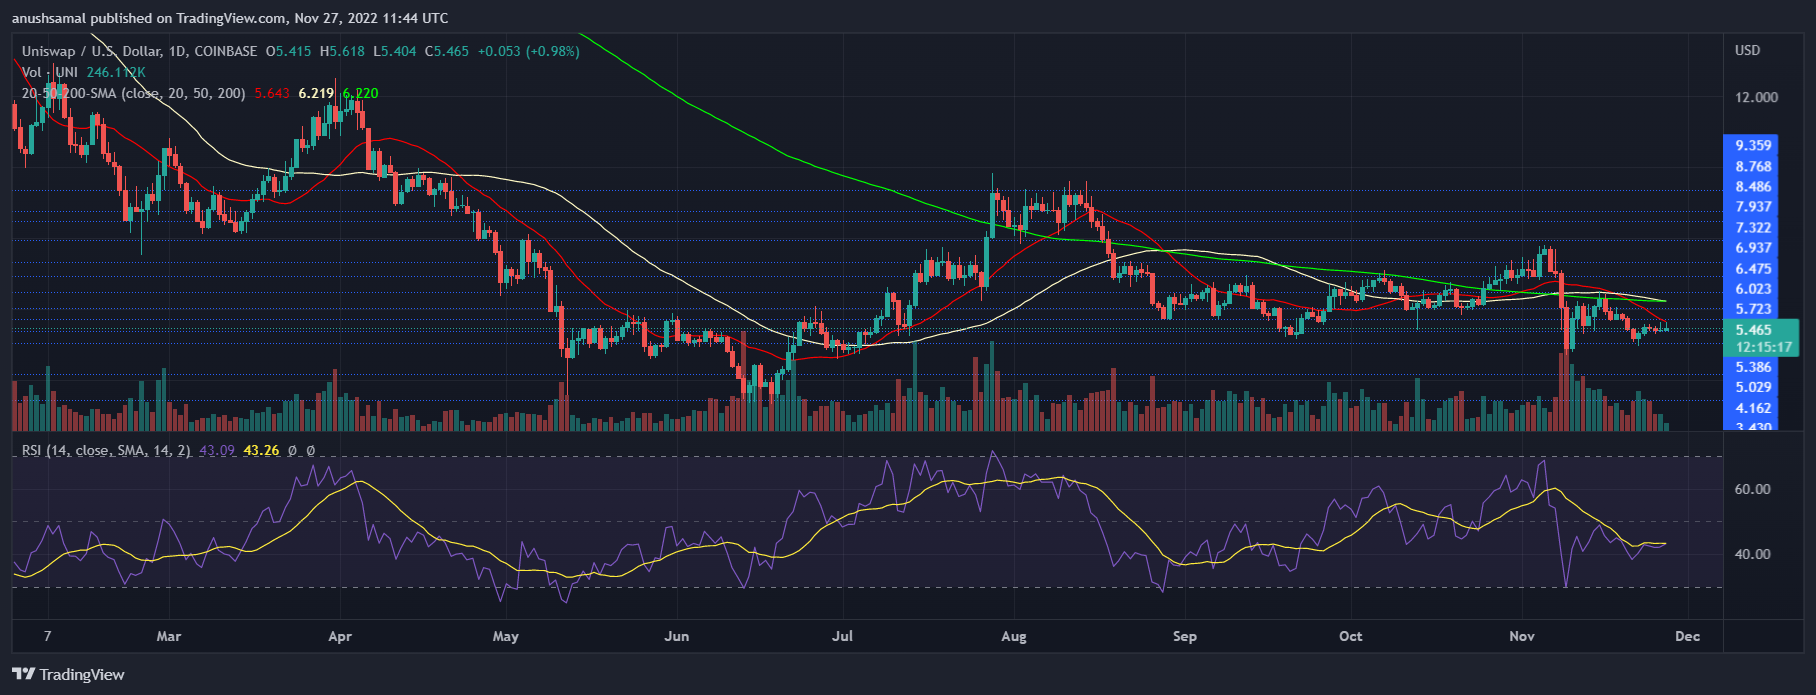
Technical Indicators
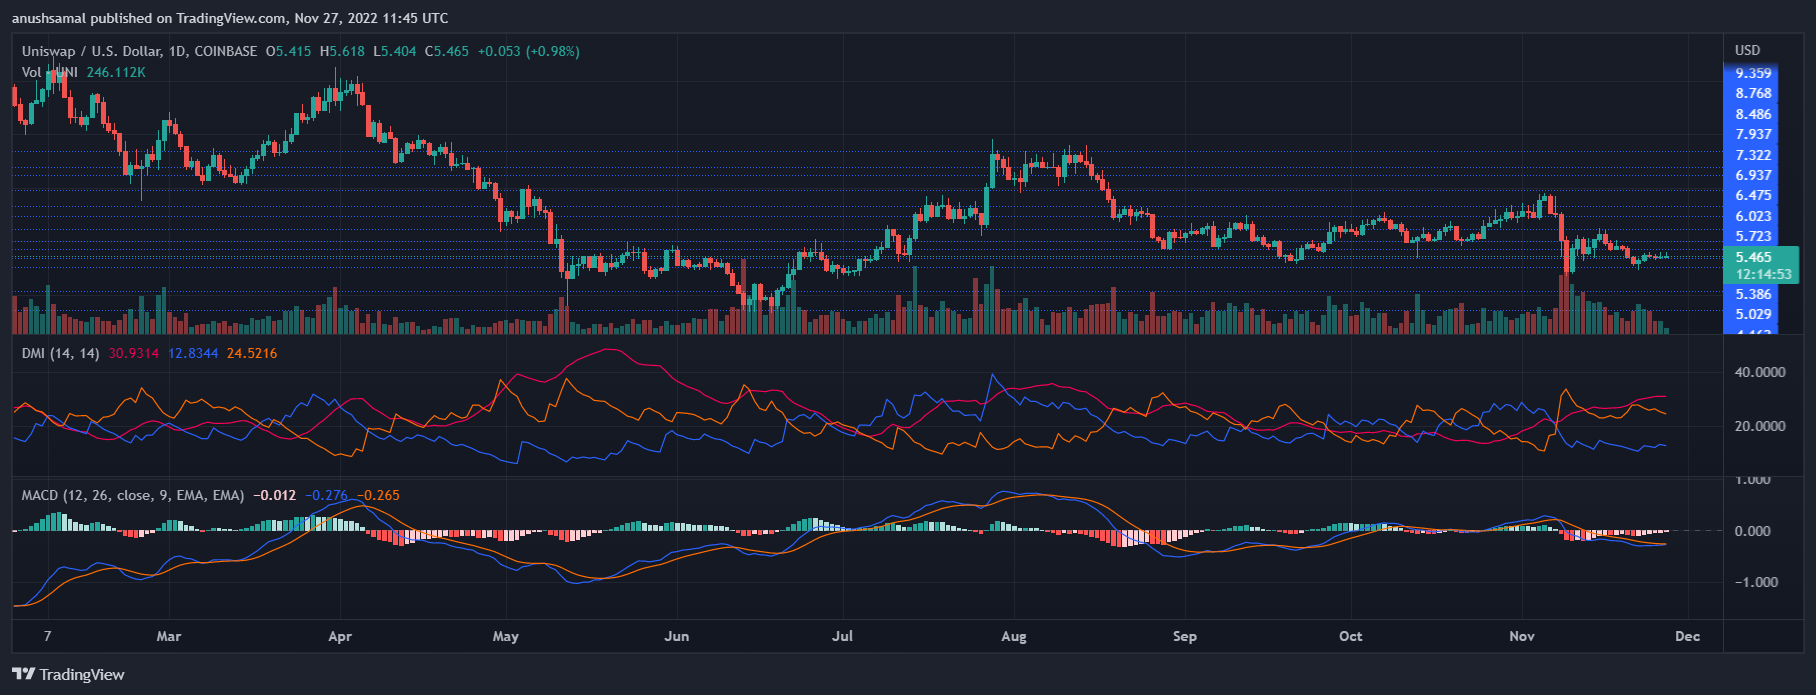
4-Hours MACD – The MACD for UNI/USD is gaining momentum in the bearish zone.
4-Hours RSI (Relative Strength Index) – The RSI for UNI/USD is below the 25 level.
Major Support Levels – $8.70, $8.50, and $7.65.
Major Resistance Levels – $9.45, $10.00, and $10.25.
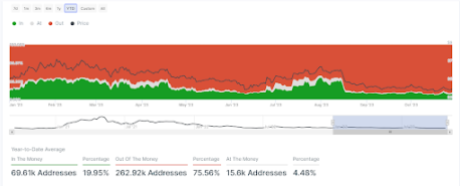 More addresses are out of the money | Source: IntoTheBlock