Bitcoin Price Turns Red And At Risk of More Downsides Below $63K

Bitcoin price failed to recover above the $65,500 resistance. BTC is again moving lower and there is a risk of more downsides below $63,000.

  • Bitcoin started another decline after it failed to surpass the $65,500 resistance zone.
  • The price is trading below $64,500 and the 100 hourly Simple moving average.
  • There is a connecting bearish trend line forming with resistance at $64,500 on the hourly chart of the BTC/USD pair (data feed from Kraken).
  • The pair could accelerate lower if there is a daily close below the $63,000 support zone.

Bitcoin Price Faces Hurdles

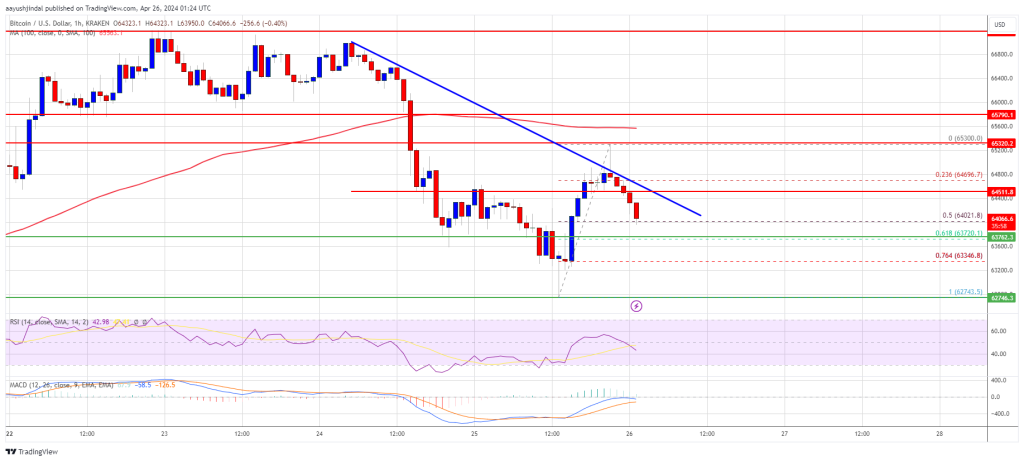
Bitcoin price started a recovery wave from the $62,750 support zone. BTC was able to climb above the $64,000 and $64,500 resistance levels. However, the price failed to clear the $65,500 resistance zone.

A high was formed at $65,300 and the price started another decline. There was a move below the $64,500 level. The price tested the 50% Fib retracement level of the recovery wave from the $62,743 swing low to the $65,300 high.

Bitcoin is now trading below $64,500 and the 100 hourly Simple moving average. There is also a connecting bearish trend line forming with resistance at $64,500 on the hourly chart of the BTC/USD pair.

Immediate resistance is near the $64,500 level or the trend line. The first major resistance could be $65,350 or $65,500. A clear move above the $65,500 resistance might send the price higher. The next resistance now sits at $66,200.

Bitcoin Price

Source: BTCUSD on TradingView.com

If there is a clear move above the $66,200 resistance zone, the price could continue to move up. In the stated case, the price could rise toward $67,000. The next major resistance is near the $67,400 zone. Any more gains might send Bitcoin toward the $68,800 resistance zone in the near term.

More Losses In BTC?

If Bitcoin fails to rise above the $64,500 resistance zone, it could continue to move down. Immediate support on the downside is near the $64,000 level.

The first major support is $63,750 or the 61.8% Fib retracement level of the recovery wave from the $62,743 swing low to the $65,300 high. If there is a close below $63,750, the price could start to drop toward $62,750. Any more losses might send the price toward the $61,200 support zone in the near term.

Technical indicators:

Hourly MACD – The MACD is now gaining pace in the bearish zone.

Hourly RSI (Relative Strength Index) – The RSI for BTC/USD is now below the 50 level.

Major Support Levels – $64,000, followed by $63,750.

Major Resistance Levels – $64,500, $65,350, and $66,200.
Bitcoin Price Trims Gains Amid War Escalation, Can Bulls Save The Day?

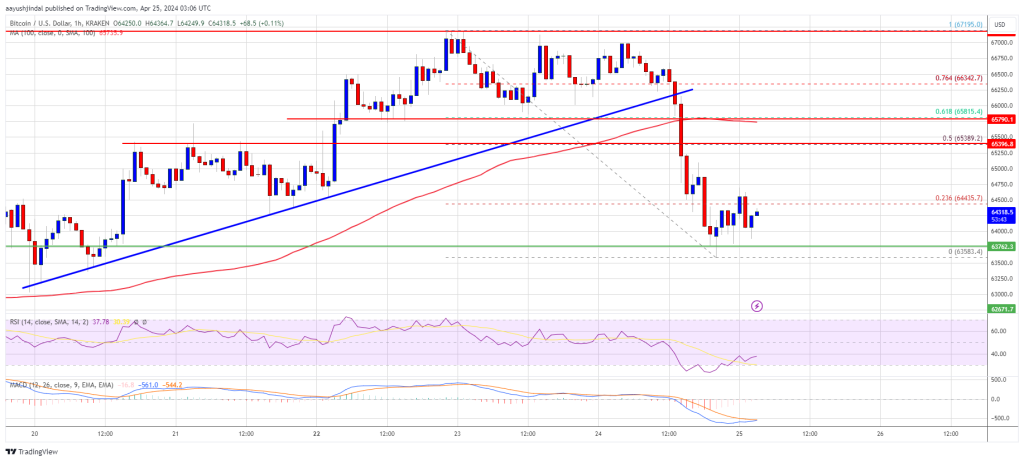
Bitcoin price failed to clear the $67,000 resistance. BTC trimmed gains and is now struggling to stay above the $63,650 support zone.

  • Bitcoin started another decline after it failed to surpass the $67,200 resistance zone.
  • The price is trading below $65,000 and the 100 hourly Simple moving average.
  • There was a break below a key bullish trend line with support at $66,200 on the hourly chart of the BTC/USD pair (data feed from Kraken).
  • The pair could correct higher, but the bears might remain active near the $65,500 zone.

Bitcoin Price Dips Again

Bitcoin price struggled to clear the $67,000 and $67,200 resistance levels. BTC formed a short-term topping pattern and started a fresh decline below the $66,000 level.

There was a move below the $65,500 support. Besides, there was a break below a key bullish trend line with support at $66,200 on the hourly chart of the BTC/USD pair. The pair even spiked below $63,650. A low was formed at $63,583 and the price is now consolidating losses.

Bitcoin price is now trading below $65,500 and the 100 hourly Simple moving average. Immediate resistance is near the $64,500 level or the 23.6% Fib retracement level of the downward move from the $67,195 swing high to the $63,583 low.

The first major resistance could be $65,350 or the 50% Fib retracement level of the downward move from the $67,195 swing high to the $63,583 low. A clear move above the $65,350 resistance might send the price higher. The next resistance now sits at $65,850. If there is a clear move above the $65,850 resistance zone, the price could continue to move up. In the stated case, the price could rise toward $67,000.

Bitcoin Price

Source: BTCUSD on TradingView.com

The next major resistance is near the $67,200 zone. Any more gains might send Bitcoin toward the $68,800 resistance zone in the near term.

More Losses In BTC?

If Bitcoin fails to rise above the $65,350 resistance zone, it could continue to move down. Immediate support on the downside is near the $63,500 level.

The first major support is $62,600. If there is a close below $62,600, the price could start to drop toward $61,200. Any more losses might send the price toward the $60,000 support zone in the near term.

Technical indicators:

Hourly MACD – The MACD is now losing pace in the bearish zone.

Hourly RSI (Relative Strength Index) – The RSI for BTC/USD is now below the 50 level.

Major Support Levels – $63,500, followed by $62,600.

Major Resistance Levels – $65,350, $65,850, and $67,000.

Bitcoin Price Eyes Next Breakout As The Bulls Aim For $70K

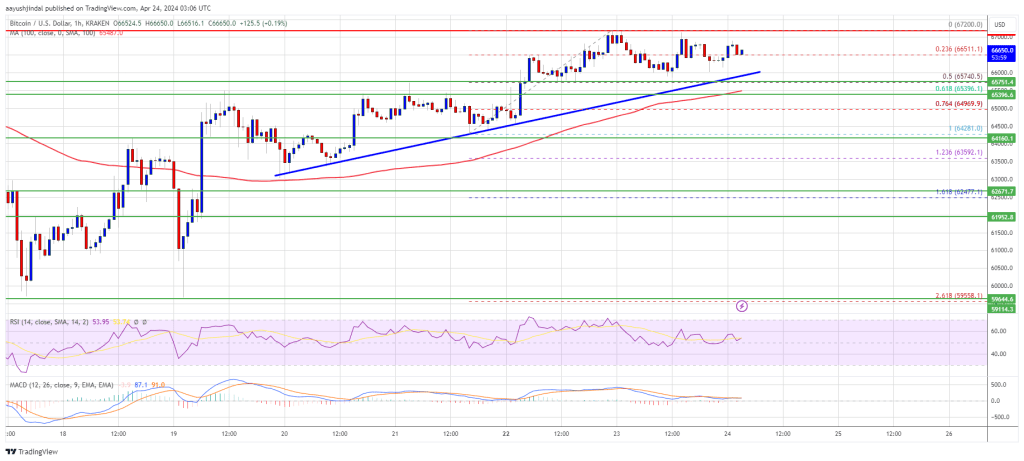
Bitcoin price climbed above the $66,000 resistance zone and started consolidation. BTC is now eyeing the next move above the $67,200 resistance zone.

  • Bitcoin is eyeing a decent increase above the $67,200 resistance zone.
  • The price is trading above $65,500 and the 100 hourly Simple moving average.
  • There is a connecting bullish trend line forming with support at $65,900 on the hourly chart of the BTC/USD pair (data feed from Kraken).
  • The pair could gain bullish momentum if it clears the $67,200 resistance zone.

Bitcoin Price Eyes More Upsides

Bitcoin price started a fresh increase above the $65,500 and $66,000 resistance levels. BTC even climbed above the $67,000 level. It traded as high as $67,200 and is currently consolidating gains.

There was a minor decline below the $66,500 level, but the price remained stable above the 23.6% Fib retracement level of the upward move from the $64,280 swing low to the $67,200 low. Bitcoin price is still trading above $65,500 and the 100 hourly Simple moving average.

There is also a connecting bullish trend line forming with support at $65,900 on the hourly chart of the BTC/USD pair. The trend line is near the 50% Fib retracement level of the upward move from the $64,280 swing low to the $67,200 low.

Immediate resistance is near the $67,000 level. The first major resistance could be $67,200. A clear move above the $67,200 resistance might send the price higher. The next resistance now sits at $68,500. If there is a clear move above the $68,500 resistance zone, the price could continue to move up. In the stated case, the price could rise toward $70,000.

Bitcoin Price

Source: BTCUSD on TradingView.com

The next major resistance is near the $70,500 zone. Any more gains might send Bitcoin toward the $72,000 resistance zone in the near term.

Are Dips Limited In BTC?

If Bitcoin fails to rise above the $67,000 resistance zone, it could start a downside correction. Immediate support on the downside is near the $66,200 level.

The first major support is $66,000 or the trend line. If there is a close below $66,000, the price could start to drop toward $65,400. Any more losses might send the price toward the $64,200 support zone in the near term.

Technical indicators:

Hourly MACD – The MACD is now losing pace in the bullish zone.

Hourly RSI (Relative Strength Index) – The RSI for BTC/USD is now above the 50 level.

Major Support Levels – $66,200, followed by $66,000.

Major Resistance Levels – $67,000, $67,200, and $68,500.

Bitcoin Price Extends Increase, Why Dips Turned Attractive In Short-Term

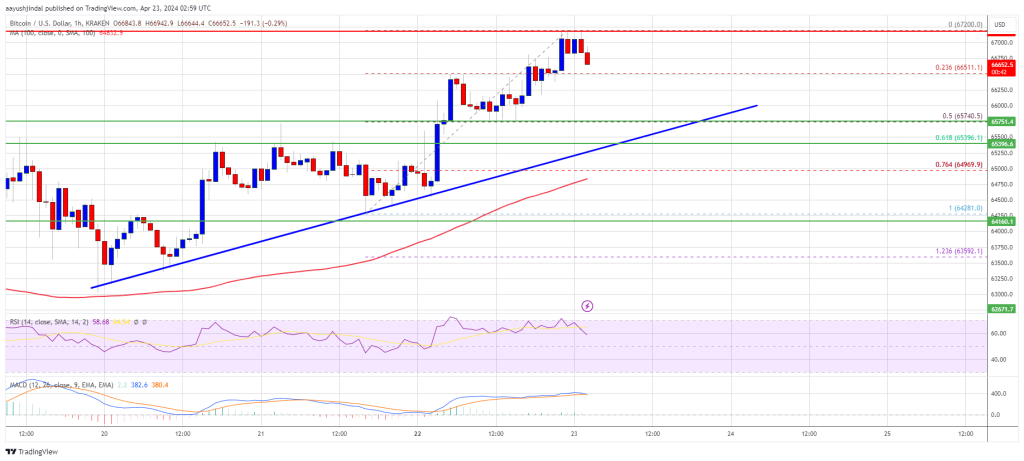
Bitcoin price extended its increase and climbed above the $66,000 resistance zone. BTC is now showing positive signs and might find bids near $65,500.

  • Bitcoin gained pace for a move above the $65,500 resistance zone.
  • The price is trading above $65,500 and the 100 hourly Simple moving average.
  • There is a key bullish trend line forming with support at $65,700 on the hourly chart of the BTC/USD pair (data feed from Kraken).
  • The pair could correct lower, but the bulls might remain active near the $65,500 support.

Bitcoin Price Gains Strength

Bitcoin price started a fresh increase above the $64,500 and $65,000 resistance levels. BTC bulls even pushed the price above the $66,000 resistance. It traded to a new weekly high at $67,200 and is currently consolidating gains.

The price is slowly moving lower toward the 23.6% Fib retracement level of the upward move from the $64,281 swing low to the $67,200 low. Bitcoin price is still trading above $65,500 and the 100 hourly Simple moving average.

There is also a key bullish trend line forming with support at $65,700 on the hourly chart of the BTC/USD pair. The trend line is near the 50% Fib retracement level of the upward move from the $64,281 swing low to the $67,200 low.

Immediate resistance is near the $67,000 level. The first major resistance could be $67,200. The next resistance now sits at $68,500. If there is a clear move above the $68,500 resistance zone, the price could continue to move up. In the stated case, the price could rise toward $70,000.

Bitcoin Price

Source: BTCUSD on TradingView.com

The next major resistance is near the $70,500 zone. Any more gains might send Bitcoin toward the $72,000 resistance zone in the near term.

Downside Correction In BTC?

If Bitcoin fails to rise above the $67,000 resistance zone, it could start a downside correction. Immediate support on the downside is near the $66,500 level.

The first major support is $65,700 or the trend line. If there is a close below $65,500, the price could start to drop toward $65,000. Any more losses might send the price toward the $64,200 support zone in the near term.

Technical indicators:

Hourly MACD – The MACD is now losing pace in the bullish zone.

Hourly RSI (Relative Strength Index) – The RSI for BTC/USD is now above the 50 level.

Major Support Levels – $66,500, followed by $65,500.

Major Resistance Levels – $67,000, $67,200, and $68,500.

Bitcoin Price Approaches Breakout, Can BTC Pump Above $66K?

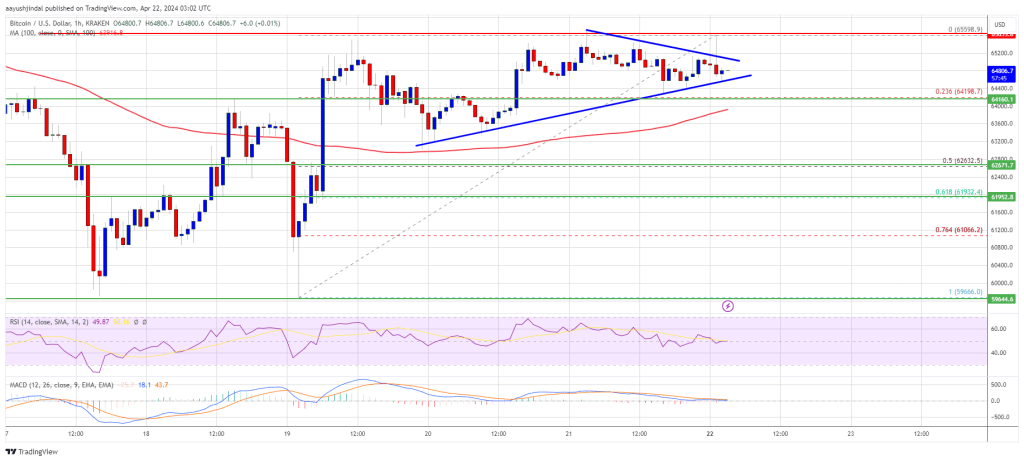
Bitcoin price recovered and climbed above the $64,000 resistance zone. BTC is now facing hurdles near the $65,500 and $66,000 levels.

  • Bitcoin is now struggling to gain pace for a move above the $65,500 resistance zone.
  • The price is trading above $64,000 and the 100 hourly Simple moving average.
  • There is a key contracting triangle forming with resistance at $65,100 on the hourly chart of the BTC/USD pair (data feed from Kraken).
  • The pair could start a fresh surge if it clears the $65,500 resistance zone.

Bitcoin Price Starts Increase

Bitcoin price found support above $60,000 and started a fresh increase. BTC climbed above the $62,500 and $63,500 resistance levels. The bulls even pushed the price above the $65,000 level.

However, the bears seem to be active near the $65,500 zone. The recent high was formed at $65,598 and the price is now consolidating gains. There was a drop below the $65,000 level, but the price is still above the 23.6% Fib retracement level of the upward move from the $59,666 swing low to the $65,598 low.

Bitcoin price is trading above $64,000 and the 100 hourly Simple moving average. Immediate resistance is near the $65,100 level. There is also a key contracting triangle forming with resistance at $65,100 on the hourly chart of the BTC/USD pair.

The first major resistance could be $65,500. The next resistance now sits at $66,000. If there is a clear move above the $66,000 resistance zone, the price could continue to move up. In the stated case, the price could rise toward $67,500.

Bitcoin Price

Source: BTCUSD on TradingView.com

The next major resistance is near the $68,500 zone. Any more gains might send Bitcoin toward the $70,000 resistance zone in the near term.

Downside Correction In BTC?

If Bitcoin fails to rise above the $65,500 resistance zone, it could start a downside correction. Immediate support on the downside is near the $64,500 level.

The first major support is $64,000. If there is a close below $64,000, the price could start to drop toward the 50% Fib retracement level of the upward move from the $59,666 swing low to the $65,598 low at $62,500. Any more losses might send the price toward the $61,200 support zone in the near term.

Technical indicators:

Hourly MACD – The MACD is now losing pace in the bullish zone.

Hourly RSI (Relative Strength Index) – The RSI for BTC/USD is now near the 50 level.

Major Support Levels – $64,500, followed by $64,000.

Major Resistance Levels – $65,100, $65,500, and $66,000.

Bitcoin Price Still At Risk of Major Downside Break Below $60K

Bitcoin price is showing bearish signs below the $63,000 resistance zone. BTC must stay above the $60,000 support zone to avoid a major decline.

  • Bitcoin is still struggling to start a recovery wave above the $63,000 resistance zone.
  • The price is trading below $62,800 and the 100 hourly Simple moving average.
  • There was a break below a connecting bullish trend line with support at $62,400 on the hourly chart of the BTC/USD pair (data feed from Kraken).
  • The pair could gain bearish momentum if it settles below the $60,000 support zone.

Bitcoin Price Struggle Continues

Bitcoin price started another increase above the $61,500 resistance zone. BTC cleared the $62,500 and $63,000 resistance levels. It even spiked above $64,000 but failed to surpass the key level at $65,000.

A high was formed at $64,142 before there was a sharp decline. There was a break below a connecting bullish trend line with support at $62,400 on the hourly chart of the BTC/USD pair. It dived below the $60,800 level and retested $59,650.

A low was formed near $59,666 and the price is now attempting a fresh recovery wave. The price climbed above the 23.6% Fib retracement level of the recent decline from the $64,142 swing high to the $59,666 low.

Bitcoin price is trading below $62,800 and the 100 hourly Simple moving average. Immediate resistance is near the $62,000 level. It is close to the 50% Fib retracement level of the recent decline from the $64,142 swing high to the $59,666 low.

The first major resistance could be $63,000. The next resistance now sits at $64,200. If there is a clear move above the $64,200 resistance zone, the price could continue to move up. In the stated case, the price could rise toward $65,000.

Bitcoin Price

Source: BTCUSD on TradingView.com

The next major resistance is near the $66,500 zone. Any more gains might send Bitcoin toward the $67,500 resistance zone in the near term.

More Losses In BTC?

If Bitcoin fails to rise above the $62,000 resistance zone, it could start another decline. Immediate support on the downside is near the $60,800 level.

The first major support is $60,000. If there is a close below $60,000, the price could start to drop toward the $59,550 level. Any more losses might send the price toward the $58,500 support zone in the near term.

Technical indicators:

Hourly MACD – The MACD is now gaining pace in the bearish zone.

Hourly RSI (Relative Strength Index) – The RSI for BTC/USD is now below the 50 level.

Major Support Levels – $60,800, followed by $60,000.

Major Resistance Levels – $62,000, $63,000, and $64,200.

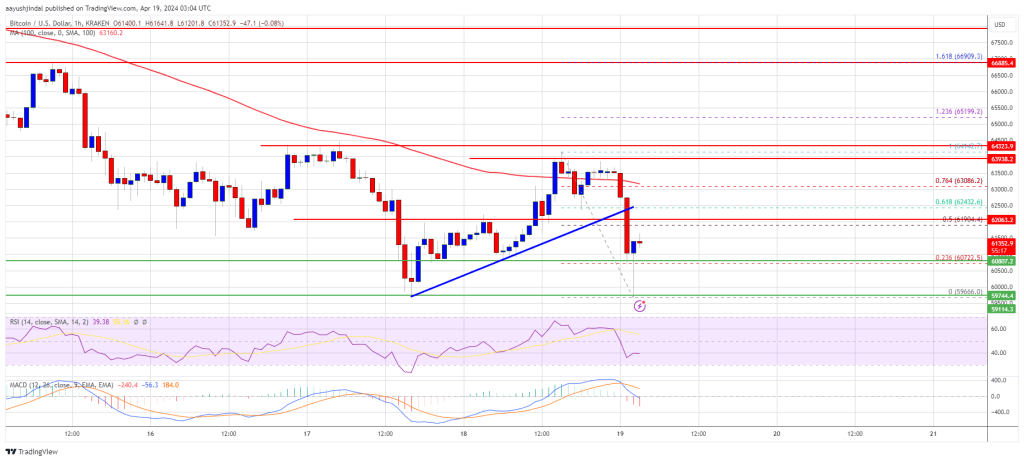
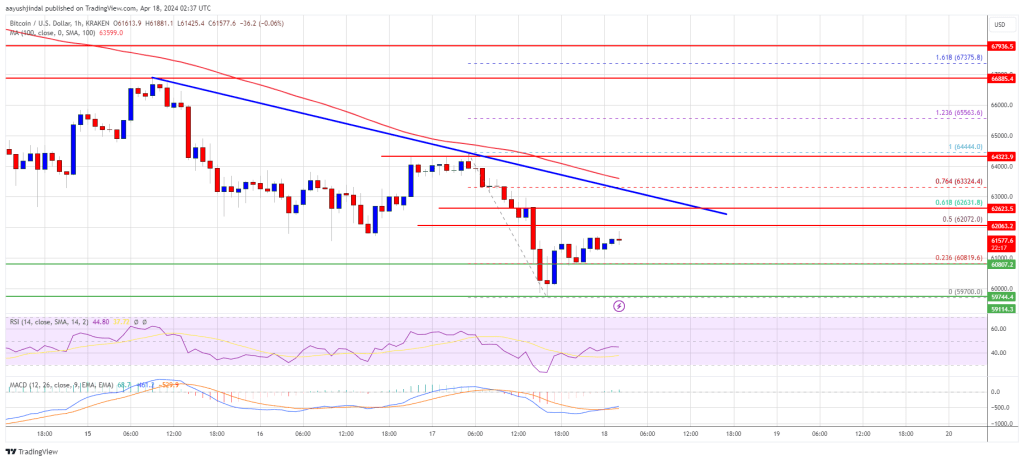
Bitcoin Price At Make-Or-Break Moment, Key Levels To Watch

Bitcoin price is still struggling below the $65,000 resistance zone. BTC must stay above the $60,000 support zone to avoid a major decline.

  • Bitcoin is still struggling to gain pace for a move above the $65,000 resistance zone.
  • The price is trading below $63,000 and the 100 hourly Simple moving average.
  • There is a key bearish trend line forming with resistance at $62,650 on the hourly chart of the BTC/USD pair (data feed from Kraken).
  • The pair could gain bullish momentum if it clears the $63,000 resistance zone.

Bitcoin Price Remains At Risk

Bitcoin price failed to clear the $64,500 resistance zone. BTC formed a short-term top at $64,450 and started another decline. There was a move below the $63,000 and $62,000 levels.

The price even spiked below the $60,000 level. A low was formed near $59,700 and the price is now attempting a fresh recovery wave. The price climbed above the 23.6% Fib retracement level of the recent decline from the $64,444 swing high to the $59,700 low.

Bitcoin price is trading below $63,000 and the 100 hourly Simple moving average. Immediate resistance is near the $62,000 level. It is close to the 50% Fib retracement level of the recent decline from the $64,444 swing high to the $59,700 low.

The first major resistance could be $62,650 and the trend line. The next resistance now sits at $63,000. If there is a clear move above the $63,000 resistance zone, the price could continue to move up. In the stated case, the price could rise toward $64,500.

Bitcoin Price

Source: BTCUSD on TradingView.com

The next major resistance is near the $65,000 zone. Any more gains might send Bitcoin toward the $66,500 resistance zone in the near term.

More Losses In BTC?

If Bitcoin fails to rise above the $63,000 resistance zone, it could start another decline. Immediate support on the downside is near the $60,800 level.

The first major support is $60,000. If there is a close below $60,000, the price could start to drop toward the $59,200 level. Any more losses might send the price toward the $58,500 support zone in the near term.

Technical indicators:

Hourly MACD – The MACD is now losing pace in the bearish zone.

Hourly RSI (Relative Strength Index) – The RSI for BTC/USD is now below the 50 level.

Major Support Levels – $60,800, followed by $60,000.

Major Resistance Levels – $62,650, $63,000, and $64,500.

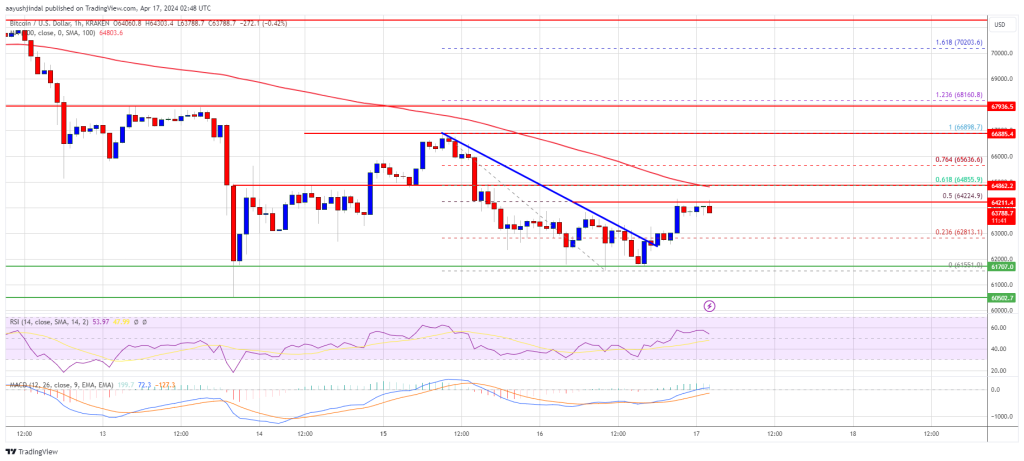
Bitcoin Price Consolidates Below Hurdles, Can BTC Bounce Back?

Bitcoin price is consolidating below the $65,000 resistance zone. BTC must surpass $65,000 and $67,000 to move into a bullish zone again.

  • Bitcoin is struggling to gain pace for a move above the $65,000 resistance zone.
  • The price is trading below $65,000 and the 100 hourly Simple moving average.
  • There was a break above a connecting bearish trend line with resistance at $63,000 on the hourly chart of the BTC/USD pair (data feed from Kraken).
  • The pair could gain bullish momentum if it clears the $67,000 resistance zone.

Bitcoin Price Eyes Upside Break

Bitcoin price failed to clear the $67,000 resistance zone. BTC started another decline and traded below the $65,000 support zone. It even declined below $62,000 before the bulls emerged.

A low was formed near $61,551 and the price is now attempting a fresh recovery wave. There was a break above a connecting bearish trend line with resistance at $63,000 on the hourly chart of the BTC/USD pair. The pair climbed above the 23.6% Fib retracement level of the recent decline from the $66,898 swing high to the $61,551 low.

Bitcoin price is trading below $65,000 and the 100 hourly Simple moving average. Immediate resistance is near the $64,250 level. It is close to the 50% Fib retracement level of the recent decline from the $66,898 swing high to the $61,551 low.

The first major resistance could be $64,850. The next resistance now sits at $65,000. If there is a clear move above the $65,000 resistance zone, the price could continue to move up. In the stated case, the price could rise toward $66,500.

Bitcoin Price

Source: BTCUSD on TradingView.com

The next major resistance is near the $67,200 zone. Any more gains might send Bitcoin toward the $70,000 resistance zone in the near term.

Another Decline In BTC?

If Bitcoin fails to rise above the $65,000 resistance zone, it could start another decline. Immediate support on the downside is near the $62,800 level.

The first major support is $62,000. If there is a close below $62,000, the price could start to drop toward the $61,500 level. Any more losses might send the price toward the $60,500 support zone in the near term.

Technical indicators:

Hourly MACD – The MACD is now losing pace in the bullish zone.

Hourly RSI (Relative Strength Index) – The RSI for BTC/USD is now above the 50 level.

Major Support Levels – $63,000, followed by $62,000.

Major Resistance Levels – $64,850, $65,000, and $67,000.

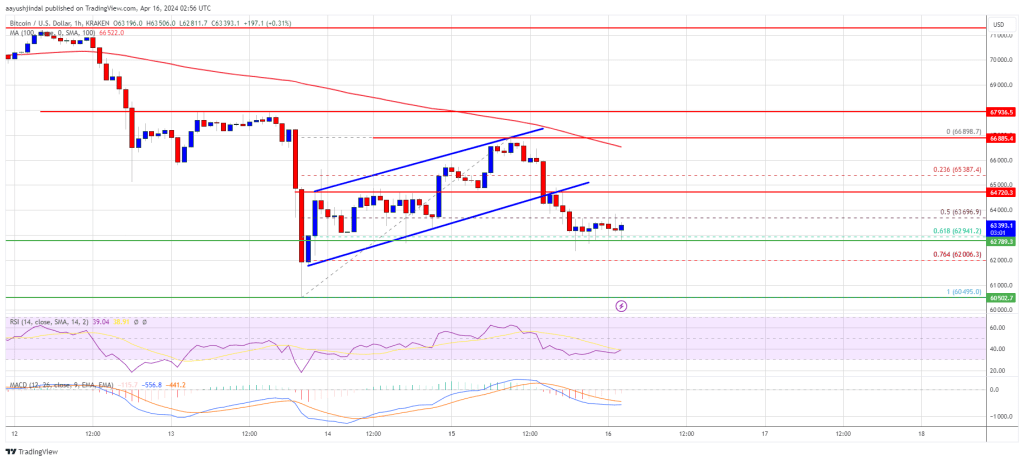
Bitcoin Price Restarts Decline, Can BTC Bulls Protect $60K?

Bitcoin price started another decline from the $67,000 zone. BTC is showing bearish signs and might soon revisit the $61,000 support zone.

  • Bitcoin failed to clear the $67,000 resistance zone.
  • The price is trading below $65,000 and the 100 hourly Simple moving average.
  • There was a break below a rising channel with support at $64,900 on the hourly chart of the BTC/USD pair (data feed from Kraken).
  • The pair could extend its decline unless it clears the $65,000 resistance zone.

Bitcoin Price Recovery Stalls

Bitcoin price attempted a recovery wave above the $65,000 resistance zone. BTC even climbed above $66,200, but the bears were active near the $67,000 zone.

A high was formed at $66,898 and the price started another decline amid rising tensions between Israel and Iran. There was a move below the $65,000 and $64,000 levels. The price traded below the 50% Fib retracement level of the upward move from the $60,495 swing low to the $66,898 high.

There was a break below a rising channel with support at $64,900 on the hourly chart of the BTC/USD pair. Bitcoin is now trading below $65,000 and the 100 hourly Simple moving average. The bulls are now protecting the 61.8% Fib retracement level of the upward move from the $60,495 swing low to the $66,898 high at $63,000.

Immediate resistance is near the $63,750 level. The first major resistance could be $64,700. The next resistance now sits at $65,000. If there is a clear move above the $65,000 resistance zone, the price could continue to move up. In the stated case, the price could rise toward $66,800 and the 100 hourly Simple moving average.

Bitcoin Price

Source: BTCUSD on TradingView.com

The next major resistance is near the $67,200 zone. Any more gains might send Bitcoin toward the $70,000 resistance zone in the near term.

More Losses In BTC?

If Bitcoin fails to rise above the $65,000 resistance zone, it could start another decline. Immediate support on the downside is near the $63,000 level.

The first major support is $62,000. If there is a close below $62,000, the price could start to drop toward the $61,000 level. Any more losses might send the price toward the $60,500 support zone in the near term.

Technical indicators:

Hourly MACD – The MACD is now losing pace in the bearish zone.

Hourly RSI (Relative Strength Index) – The RSI for BTC/USD is now below the 50 level.

Major Support Levels – $63,000, followed by $62,000.

Major Resistance Levels – $64,700, $65,000, and $67,000.

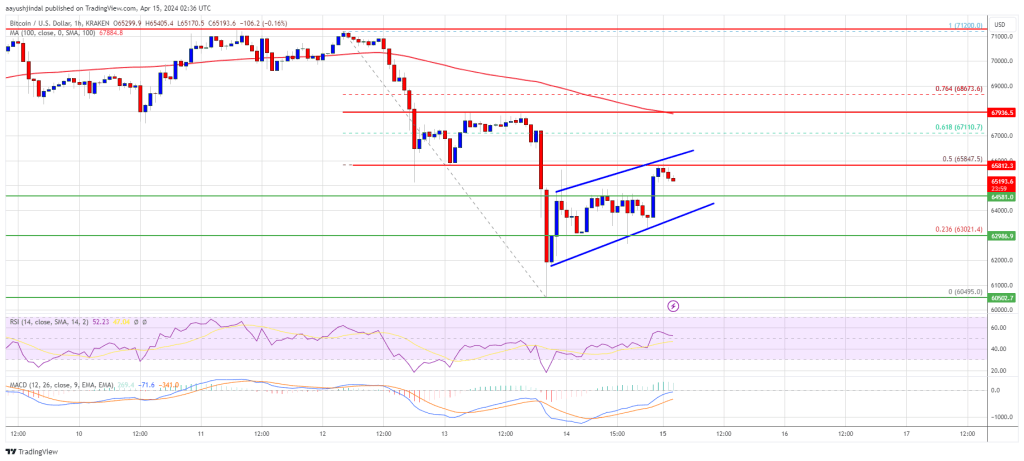
Bitcoin Price Downside Thrust Over Or The Bears Are Not Done Yet?

Bitcoin price started a major decline amid the Israel-Iran tensions. BTC declined toward $60,500 and is currently attempting a recovery wave.

  • Bitcoin is attempting a recovery wave from the $60,500 support zone.
  • The price is trading below $65,500 and the 100 hourly Simple moving average.
  • There is a key rising channel forming with resistance at $65,850 on the hourly chart of the BTC/USD pair (data feed from Kraken).
  • The pair could gain bullish momentum if it clears the $66,000 resistance zone.

Bitcoin Price Recovery Faces Hurdles

Bitcoin price started a major decline below the $70,000 level. BTC gained bearish momentum amid rising tensions between Israel and Iran. There was a sharp decline below the $66,000 and $65,000 levels.

The price dipped over 10% and even tested the $60,500 support. A low was formed near $60,495 and the price is now attempting a recovery wave. It climbed above the $62,500 and $63,000 levels. There was a move above the 23.6% Fib retracement level of the downward move from the $71,200 swing high to the $60,495 low.

Bitcoin is now trading below $67,000 and the 100 hourly Simple moving average. Immediate resistance is near the $65,800 level. There is also a key rising channel forming with resistance at $65,850 on the hourly chart of the BTC/USD pair. It is close to the 50% Fib retracement level of the downward move from the $71,200 swing high to the $60,495 low.

Bitcoin Price

Source: BTCUSD on TradingView.com

The first major resistance could be $66,000. The next resistance now sits at $68,000 and the 100 hourly Simple moving average. If there is a clear move above the $68,000 resistance zone, the price could continue to move up. In the stated case, the price could rise toward $70,000. The next major resistance is near the $71,200 zone. Any more gains might send Bitcoin toward the $72,500 resistance zone in the near term.

Another Decline In BTC?

If Bitcoin fails to rise above the $66,850 resistance zone, it could start another decline. Immediate support on the downside is near the $64,500 level.

The first major support is $63,000. If there is a close below $63,000, the price could start to drop toward the $62,000 level. Any more losses might send the price toward the $60,500 support zone in the near term.

Technical indicators:

Hourly MACD – The MACD is now losing pace in the bullish zone.

Hourly RSI (Relative Strength Index) – The RSI for BTC/USD is now above the 50 level.

Major Support Levels – $64,500, followed by $63,000.

Major Resistance Levels – $65,850, $66,000, and $68,000.

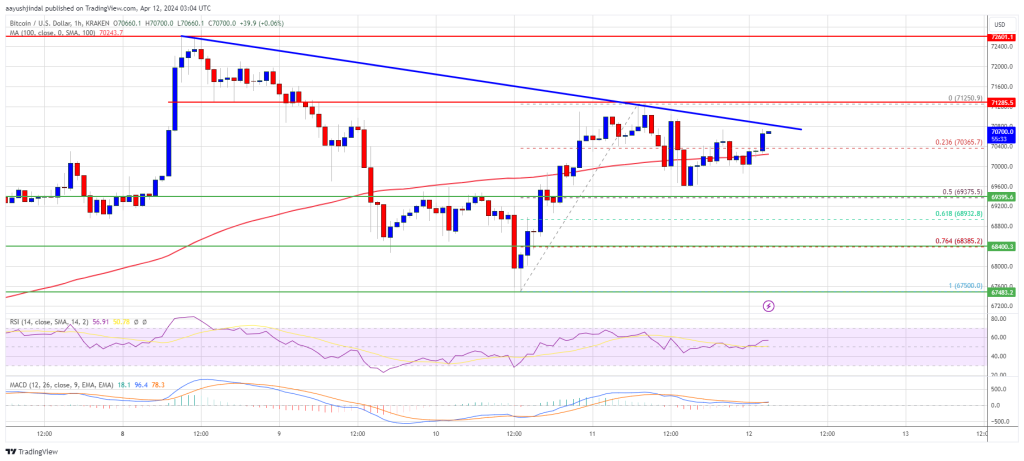
Bitcoin Price Eyes Upside Break, Can Bulls Send BTC To $75K?

Bitcoin price is holding gains above the $69,200 zone. BTC could gain bullish momentum if it clears the $70,800 and $71,250 resistance levels.

  • Bitcoin is attempting another increase above the $70,000 zone.
  • The price is trading above $70,000 and the 100 hourly Simple moving average.
  • There is a connecting bearish trend line forming with resistance at $70,800 on the hourly chart of the BTC/USD pair (data feed from Kraken).
  • The pair could gain bullish momentum if it clears the $71,250 resistance zone.

Bitcoin Price Eyes Another Increase

Bitcoin price attempted more gains above the $70,500 level. However, BTC struggled to gain pace for a move above the $71,200 and $71,400 levels.

A high was formed at $71,250 before there was a downside correction. There was a move below the $70,500 level. The price dipped below the 23.6% Fib retracement level of the upward move from the $67,500 swing low to the $71,250 high.

However, the bulls are active above the $69,200 level. It is close to the 50% Fib retracement level of the upward move from the $67,500 swing low to the $71,250 high.

Bitcoin is now trading above $70,000 and the 100 hourly Simple moving average. Immediate resistance is near the $70,800 level. There is also a connecting bearish trend line forming with resistance at $70,800 on the hourly chart of the BTC/USD pair.

Bitcoin Price

Source: BTCUSD on TradingView.com

The first major resistance could be $71,250. The next resistance now sits at $71,400. If there is a clear move above the $71,400 resistance zone, the price could continue to move up. In the stated case, the price could rise toward $72,600. The next major resistance is near the $73,500 zone. Any more gains might send Bitcoin toward the $75,000 resistance zone in the near term.

Another Decline In BTC?

If Bitcoin fails to rise above the $71,250 resistance zone, it could start another decline. Immediate support on the downside is near the $70,400 level and the 100 hourly SMA.

The first major support is $69,350. If there is a close below $69,350, the price could start a drop toward the $68,500 level. Any more losses might send the price toward the $67,500 support zone in the near term.

Technical indicators:

Hourly MACD – The MACD is now gaining pace in the bullish zone.

Hourly RSI (Relative Strength Index) – The RSI for BTC/USD is now above the 50 level.

Major Support Levels – $70,400, followed by $69,350.

Major Resistance Levels – $70,800, $71,250, and $72,600.

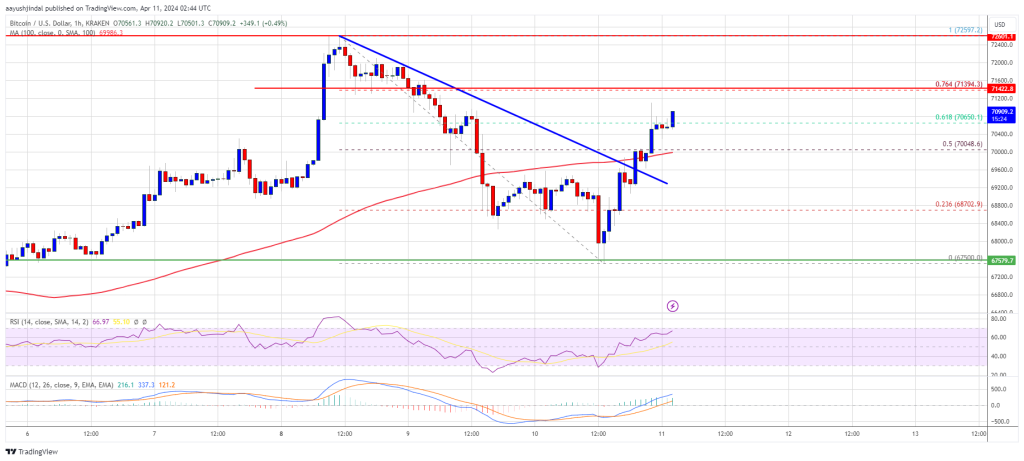
Bitcoin Price Gearing For Another Lift-Off to $72.5K: Dips Turn Attractive

Bitcoin price found support near $67,500. BTC started a fresh increase and might soon revisit the $72,500 resistance zone in the near term.

  • Bitcoin retested the $67,500 support zone before it started a fresh increase.
  • The price is trading above $70,000 and the 100 hourly Simple moving average.
  • There was a break above a key bearish trend line with resistance at $69,600 on the hourly chart of the BTC/USD pair (data feed from Kraken).
  • The pair could gain bullish momentum if it clears the $71,400 resistance zone.

Bitcoin Price Holds Support

Bitcoin price saw another decline below the $70,000 zone. BTC even dived below the $68,500 level after the US CPI increased more than expected. However, the bulls were active near the $67,500 support.

A low was formed at $67,500 and the price started a fresh increase. There was a move above the $69,200 and $69,500 resistance levels. The price cleared the 50% Fib retracement level of the downward move from the $72,597 swing high to the $67,500 low.

There was a break above a key bearish trend line with resistance at $69,600 on the hourly chart of the BTC/USD pair. Bitcoin is now trading above $70,000 and the 100 hourly Simple moving average.

Immediate resistance is near the $71,400 level or the 76.4% Fib retracement level of the downward move from the $72,597 swing high to the $67,500 low. The first major resistance could be $72,500. The next resistance now sits at $72,800. If there is a clear move above the $72,800 resistance zone, the price could continue to move up.

Bitcoin Price

Source: BTCUSD on TradingView.com

In the stated case, the price could rise toward $73,200. The next major resistance is near the $73,500 zone. Any more gains might send Bitcoin toward the $75,000 resistance zone in the near term.

Another Decline In BTC?

If Bitcoin fails to rise above the $71,400 resistance zone, it could start another decline. Immediate support on the downside is near the $70,000 level and the 100 hourly SMA.

The first major support is $69,200. If there is a close below $69,200, the price could start a drop toward the $68,500 level. Any more losses might send the price toward the $67,500 support zone in the near term.

Technical indicators:

Hourly MACD – The MACD is now gaining pace in the bullish zone.

Hourly RSI (Relative Strength Index) – The RSI for BTC/USD is now above the 50 level.

Major Support Levels – $70,000, followed by $69,200.

Major Resistance Levels – $71,400, $72,500, and $73,500.

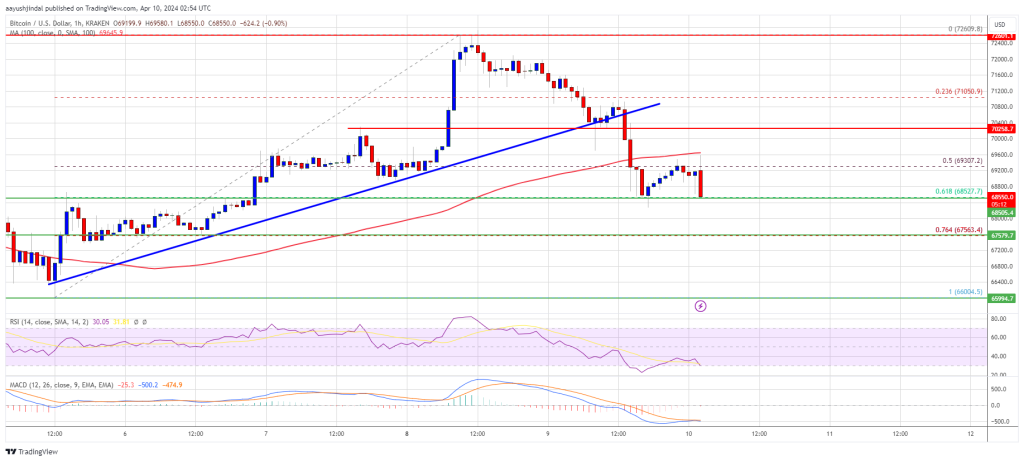
Bitcoin Price Fails Again, Is This A Fresh Bearish Signal?

Bitcoin price failed to settle above the $72,000 resistance. BTC corrected gains and now moving lower toward the $67,500 support zone.

  • Bitcoin struggled to clear the $72,000 and $72,500 resistance levels.
  • The price is trading below $70,000 and the 100 hourly Simple moving average.
  • There was a break below a major bullish trend line with support near $70,400 on the hourly chart of the BTC/USD pair (data feed from Kraken).
  • The pair could continue to move down if it breaks the $68,500 support level.

Bitcoin Price Trims Gains

Bitcoin price saw a decent increase above the $70,000 resistance zone. BTC even cleared the $71,200 and $72,000 resistance levels, but upsides were limited.

The bears appeared near the $72,500 zone. A high was formed near the $72,609 level and the price struggled to settle above the $72,000 level. There was a fresh bearish reaction below the $71,200 level. The price declined below the 50% Fib retracement level of the upward move from the $68,955 swing low to the $72,609 high.

There was a break below a major bullish trend line with support near $70,400 on the hourly chart of the BTC/USD pair. Bitcoin is now trading below $70,000 and the 100 hourly Simple moving average.

The bulls are now protecting the $68,500 support and the 61.8% Fib retracement level of the upward move from the $68,955 swing low to the $72,609 high. Immediate resistance is near the $69,500 level and the 100 hourly Simple moving average.

The first major resistance could be $70,000. The next resistance now sits at $71,200. If there is a clear move above the $71,200 resistance zone, the price could start a fresh increase.

Bitcoin Price

Source: BTCUSD on TradingView.com

In the stated case, the price could rise toward $72,000. The next major resistance is near the $72,500 zone. Any more gains might send Bitcoin toward the $73,500 resistance zone in the near term.

More Downsides In BTC?

If Bitcoin fails to rise above the $70,000 resistance zone, it could continue to move down. Immediate support on the downside is near the $68,500 level.

The first major support is $67,500. If there is a close below $67,500, the price could start a drop toward the $66,000 level. Any more losses might send the price toward the $65,000 support zone in the near term.

Technical indicators:

Hourly MACD – The MACD is now gaining pace in the bearish zone.

Hourly RSI (Relative Strength Index) – The RSI for BTC/USD is now below the 50 level.

Major Support Levels – $68,500, followed by $67,500.

Major Resistance Levels – $69,500, $70,000, and $71,200.

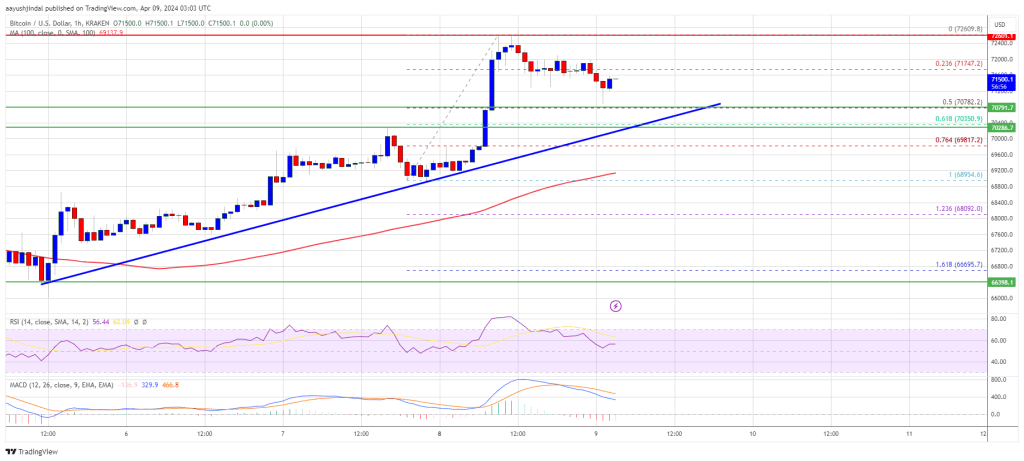
Bitcoin Price Resumes Upside, Why BTC Could Soon Hit New ATH

Bitcoin price is moving higher above the $71,200 resistance. BTC is showing positive signs and might soon extend gains above $72,500.

  • Bitcoin climbed higher above $69,500 and $70,000 resistance levels.
  • The price is trading above $70,000 and the 100 hourly Simple moving average.
  • There is a key bullish trend line forming with support near $70,750 on the hourly chart of the BTC/USD pair (data feed from Kraken).
  • The pair could accelerate higher if it clears the $72,500 resistance zone.

Bitcoin Price Regains Momentum

Bitcoin price started a decent increase above the $68,500 resistance zone. BTC cleared the $69,500 and $70,000 resistance levels to move into a positive zone.

The price even cleared the $71,200 resistance zone. A high was formed near the $72,609 level and the price is now correcting gains. There was a move below the $72,000 level. The price corrected lower below the 23.6% Fib retracement level of the upward wave from the $68,954 swing low to the $72,609 high.

Bitcoin is now trading above $70,000 and the 100 hourly Simple moving average. There is also a key bullish trend line forming with support near $70,750 on the hourly chart of the BTC/USD pair. The trend line is close to the 50% Fib retracement level of the upward wave from the $68,954 swing low to the $72,609 high.

Immediate resistance is near the $72,000 level. The first major resistance could be $72,500. The next resistance now sits at $72,800. If there is a clear move above the $72,800 resistance zone, the price could start a fresh increase.

Bitcoin Price

Source: BTCUSD on TradingView.com

In the stated case, the price could rise toward $73,500. The next major resistance is near the $74,000 zone. Any more gains might send Bitcoin toward the $75,000 resistance zone in the near term.

Are Dips Supported In BTC?

If Bitcoin fails to rise above the $72,000 resistance zone, it could continue to move down. Immediate support on the downside is near the $70,7500 level or the trend line.

The first major support is $70,350. The next support sits at $70,000. If there is a close below $70,000, the price could start a drop toward the $68,500 level. Any more losses might send the price toward the $67,500 support zone in the near term.

Technical indicators:

Hourly MACD – The MACD is now losing pace in the bullish zone.

Hourly RSI (Relative Strength Index) – The RSI for BTC/USD is now near the 50 level.

Major Support Levels – $70,750, followed by $70,000.

Major Resistance Levels – $72,000, $72,500, and $73,500.

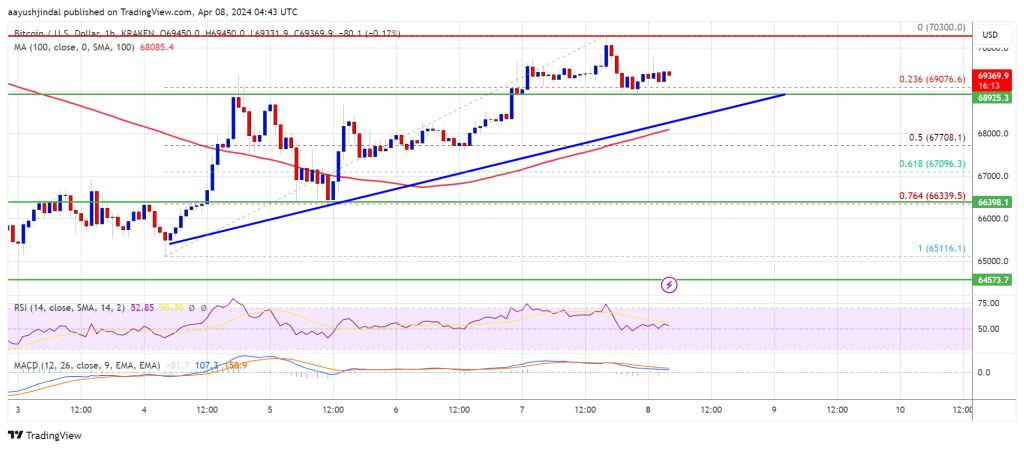
Bitcoin Price Hints At Potential Correction, Buy The Dip?

Bitcoin price is showing a few positive signs above the $68,500 resistance. BTC must settle above the $70,000 resistance to continue higher in the near term.

  • Bitcoin is eyeing a steady increase above $69,500 and $70,000 levels.
  • The price is trading above $68,000 and the 100 hourly Simple moving average.
  • There is a key bullish trend line forming with support near $68,800 on the hourly chart of the BTC/USD pair (data feed from Kraken).
  • The pair could start another increase if it stays above the $68,000 support zone.

Bitcoin Price Holds Support

Bitcoin price started a decent increase above the $67,500 resistance zone. BTC cleared the $68,500 and $68,800 resistance levels to move into a positive zone.

The price even spiked above the $70,000 resistance zone. A high was formed near the $70,300 level and the price is now correcting gains. There was a move below the $70,000 level. There was a move below the 23.6% Fib retracement level of the upward move from the $65,116 swing low to the $70,300 high.

Bitcoin is now trading above $68,000 and the 100 hourly Simple moving average. Immediate resistance is near the $69,800 level. The first major resistance could be $70,000.

Bitcoin Price

Source: BTCUSD on TradingView.com

The next resistance now sits at $70,300. If there is a clear move above the $70,300 resistance zone, the price could start a fresh increase. In the stated case, the price could rise toward $71,200. The next major resistance is near the $72,000 zone. Any more gains might send Bitcoin toward the $73,500 resistance zone in the near term.

Are Dips Limited In BTC?

If Bitcoin fails to rise above the $70,000 resistance zone, it could start a downside correction. Immediate support on the downside is near the $69,000 level or the trend line.

The first major support is $67,800 or the 50% Fib retracement level of the upward move from the $65,116 swing low to the $70,300 high. The next support sits at $66,500. If there is a close below $66,500, the price could start a drop toward the $65,350 level. Any more losses might send the price toward the $62,500 support zone in the near term.

Technical indicators:

Hourly MACD – The MACD is now losing pace in the bullish zone.

Hourly RSI (Relative Strength Index) – The RSI for BTC/USD is now near the 50 level.

Major Support Levels – $68,800, followed by $67,800.

Major Resistance Levels – $69,800, $70,000, and $71,200.

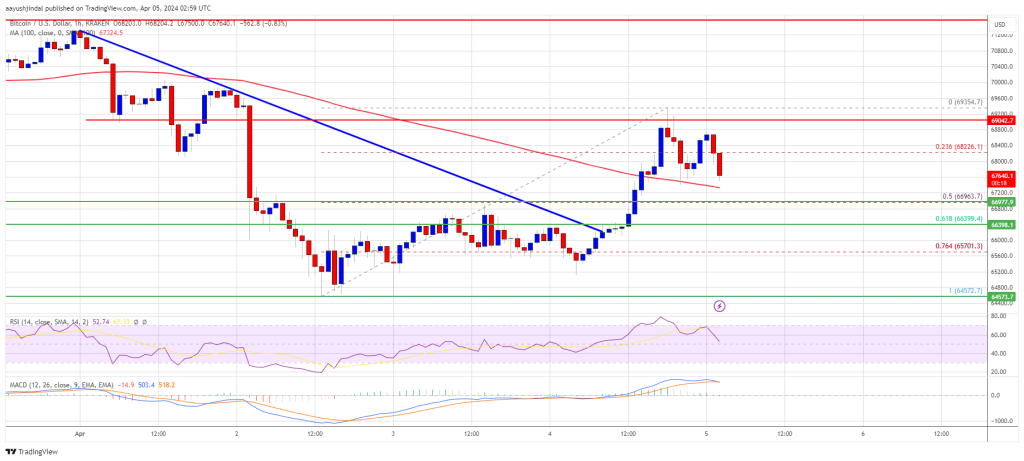
Bitcoin Price Reclaims 100 SMA But Bulls Still Face Uphill Task

Bitcoin price is attempting a recovery wave above the $66,500 resistance. BTC must clear the $70,000 resistance to continue higher in the near term.

  • Bitcoin is facing many hurdles near the $69,500 and $70,000 levels.
  • The price is trading above $67,000 and the 100 hourly Simple moving average.
  • There was a break above a key bearish trend line with resistance at $66,350 on the hourly chart of the BTC/USD pair (data feed from Kraken).
  • The pair could start another increase if it stays above the $67,000 support zone.

Bitcoin Price Eyes Recovery

Bitcoin price found support near the $64,500 zone and started a recovery wave. BTC was able to rise above the $66,500 and $67,000 resistance levels to move into a short-term positive zone.

There was a break above a key bearish trend line with resistance at $66,350 on the hourly chart of the BTC/USD pair. The pair even spiked above the $69,000 zone. A high was formed at $69,354 and the price is now consolidating gains.

It traded below the 23.6% Fib retracement level of the upward move from the $64,572 swing low to the $69,352 high. Bitcoin is now trading above $67,000 and the 100 hourly Simple moving average.

Immediate resistance is near the $68,250 level. The first major resistance could be $69,350. The main resistance now sits at $70,000. If there is a clear move above the $70,000 resistance zone, the price could start a fresh increase. In the stated case, the price could rise toward $71,200.

Bitcoin Price

Source: BTCUSD on TradingView.com

The next major resistance is near the $72,000 zone. Any more gains might send Bitcoin toward the $73,500 resistance zone in the near term.

Another Decline In BTC?

If Bitcoin fails to rise above the $69,350 resistance zone, it could start another decline. Immediate support on the downside is near the $67,200 level.

The first major support is $67,000 or the 50% Fib retracement level of the upward move from the $64,572 swing low to the $69,352 high. The next support sits at $66,400. If there is a close below $66,400, the price could start a drop toward the $65,500 level. Any more losses might send the price toward the $64,500 support zone in the near term.

Technical indicators:

Hourly MACD – The MACD is now losing pace in the bullish zone.

Hourly RSI (Relative Strength Index) – The RSI for BTC/USD is now declining toward the 50 level.

Major Support Levels – $67,200, followed by $67,000.

Major Resistance Levels – $69,350, $70,000, and $71,200.

Bitcoin Price Could Struggle And Continue Lower – Here’s Why

Bitcoin price is struggling to recover above the $67,000 zone. BTC could gain bearish momentum if there is a close below the $64,500 level.

  • Bitcoin is facing many hurdles near the $66,500 and $67,000 levels.
  • The price is trading below $67,000 and the 100 hourly Simple moving average.
  • There is a major bearish trend line forming with resistance near $66,400 on the hourly chart of the BTC/USD pair (data feed from Kraken).
  • The pair is now at risk of a downside break below the $64,500 support zone.

Bitcoin Price Upsides Remain Capped

Bitcoin price started a consolidation phase after there was a drop toward the $64,500 level. BTC traded as low as $64,572 and recently attempted a minor recovery wave.

There was a move above the $66,000 level. The price climbed above the 23.6% Fib retracement level of the downward wave from the $71,305 swing high to the $64,570 low. However, the bears were active near the $66,600 level.

Bitcoin is now trading below $67,000 and the 100 hourly Simple moving average. There is also a major bearish trend line forming with resistance near $66,400 on the hourly chart of the BTC/USD pair.

Immediate resistance is near the $66,400 level and the trend line. The first major resistance could be $66,600. If there is a clear move above the $66,600 resistance zone, the price could start a fresh increase. In the stated case, the price could rise toward the 50% Fib retracement level of the downward wave from the $71,305 swing high to the $64,570 low at $67,950.

Bitcoin Price

Source: BTCUSD on TradingView.com

The next major resistance is near the $68,750 zone. Any more gains might send Bitcoin toward the $70,000 resistance zone in the near term.

More Losses In BTC?

If Bitcoin fails to rise above the $66,600 resistance zone, it could continue to move down. Immediate support on the downside is near the $65,200 level.

The first major support is $64,600. The next support sits at $64,000. If there is a close below $64,000, the price could start a drop toward the $62,500 level. Any more losses might send the price toward the $60,500 support zone in the near term.

Technical indicators:

Hourly MACD – The MACD is now gaining pace in the bearish zone.

Hourly RSI (Relative Strength Index) – The RSI for BTC/USD is now below the 50 level.

Major Support Levels – $65,200, followed by $64,500.

Major Resistance Levels – $66,600, $67,000, and $67,950.

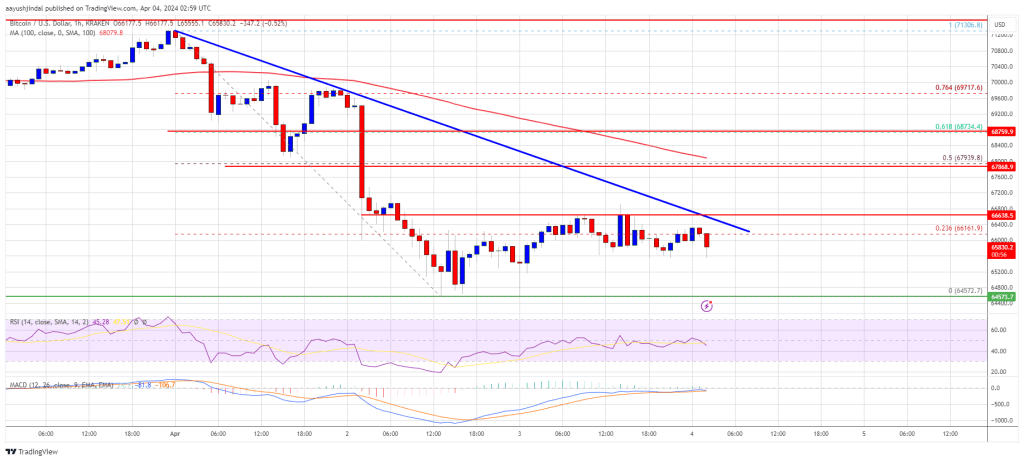
Bitcoin Price Consolidates Losses But Recovery Could Face Hurdles

Bitcoin price extended its decline below the $65,000 support zone. BTC is now consolidating losses and might attempt a recovery wave toward $67,000.

  • Bitcoin price declined further below the $65,500 and $65,000 levels.
  • The price is trading below $67,500 and the 100 hourly Simple moving average.
  • There is a key bearish trend line forming with resistance near $67,200 on the hourly chart of the BTC/USD pair (data feed from Kraken).
  • The pair could recover but the bears might remain active near $67,000.

Bitcoin Price Drops Further

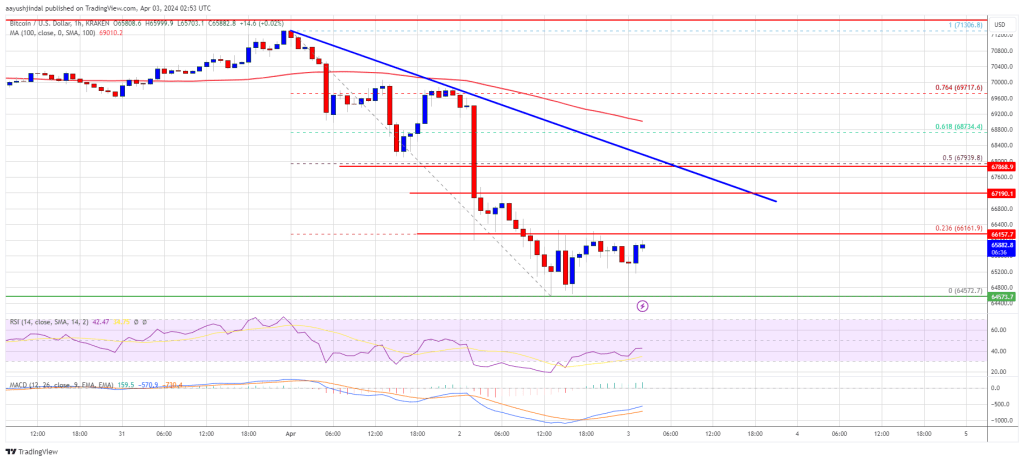
Bitcoin price turned red after it broke the $68,000 support zone. BTC extended its decline below the $65,500 and $65,000 levels. Finally, it tested the $64,500 region.

A low was formed near $64,572 and the price is now consolidating losses. There was a move above the $65,000 level. The price even tested the 23.6% Fib retracement level of the downward move from the $71,306 swing high to the $64,572 low.

Bitcoin is now trading below $67,000 and the 100 hourly Simple moving average. There is also a key bearish trend line forming with resistance near $67,200 on the hourly chart of the BTC/USD.

Immediate resistance is near the $66,000 level. The first major resistance could be $67,200 and the trend line. If there is a clear move above the $67,200 resistance zone, the price could start a fresh increase. In the stated case, the price could rise toward the 50% Fib retracement level of the downward move from the $71,306 swing high to the $64,572 low at $67,950.

Bitcoin Price

Source: BTCUSD on TradingView.com

The next major resistance is near the $68,500 zone. Any more gains might send Bitcoin toward the $70,000 resistance zone in the near term.

More Losses In BTC?

If Bitcoin fails to rise above the $67,200 resistance zone, it could continue to move down. Immediate support on the downside is near the $65,200 level.

The first major support is $64,500. The next support sits at $64,000. If there is a close below $64,000, the price could start a drop toward the $62,500 level. Any more losses might send the price toward the $60,500 support zone in the near term.

Technical indicators:

Hourly MACD – The MACD is now losing pace in the bearish zone.

Hourly RSI (Relative Strength Index) – The RSI for BTC/USD is now below the 50 level.

Major Support Levels – $65,200, followed by $64,500.

Major Resistance Levels – $66,000, $67,200, and $67,950.

Bitcoin Price Dumped To $66K As Bears Gain Strength, $64K Next?

Bitcoin price started another decline from the $70,000 resistance zone. BTC is down over 5% and there was a move below the $67,500 support.

  • Bitcoin price is gaining bearish momentum from the $70,000 resistance zone.
  • The price is trading below $68,500 and the 100 hourly Simple moving average.
  • There is a key bearish trend line forming with resistance near $68,400 on the hourly chart of the BTC/USD pair (data feed from Kraken).
  • The pair could extend its decline toward the $64,000 support zone in the near term.

Bitcoin Price Turns Red

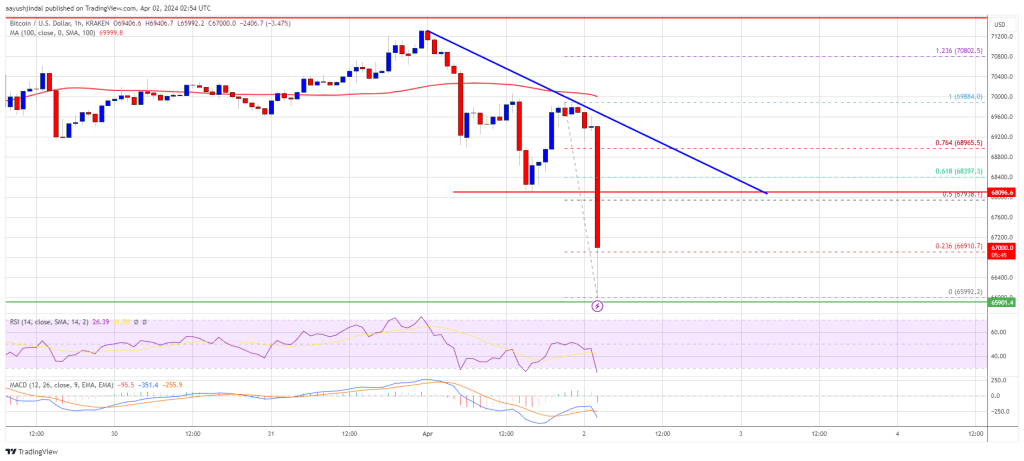
Bitcoin price struggled to settle above the $70,000 resistance zone. BTC reacted to the downside after it broke the $69,200 support zone. There was a sharp move below the $68,500 level.

The price even declined below the $67,000 level. Finally, it tested the $66,000 with a bearish angle. A low was formed near $65,992 and the price is now attempting a recovery wave. There was a move above the $66,800 level.

The price moved above the 23.6% Fib retracement level of the downward move from the $69,884 swing high to the $65,992 low. However, Bitcoin is now trading below $68,500 and the 100 hourly Simple moving average. There is also a key bearish trend line forming with resistance near $68,400 on the hourly chart of the BTC/USD.

Immediate resistance is near the $68,000 level. It is close to the 50% Fib retracement level of the downward move from the $69,884 swing high to the $65,992 low. The first major resistance could be $68,500 and the trend line. If there is a clear move above the $68,500 resistance zone, the price could start a fresh increase.

Bitcoin Price

Source: BTCUSD on TradingView.com

In the stated case, the price could rise toward the $70,000 resistance zone in the near term. The next major resistance is near the $71,500 zone.

More Losses In BTC?

If Bitcoin fails to rise above the $68,000 resistance zone, it could continue to move down. Immediate support on the downside is near the $66,000 level.

The first major support is $65,000. The next support sits at $64,000. If there is a close below $64,000, the price could start a drop toward the $62,500 level. Any more losses might send the price toward the $60,500 support zone in the near term.

Technical indicators:

Hourly MACD – The MACD is now gaining pace in the bearish zone.

Hourly RSI (Relative Strength Index) – The RSI for BTC/USD is now below the 50 level.

Major Support Levels – $66,000, followed by $65,000.

Major Resistance Levels – $68,000, $68,500, and $70,000.

Bitcoin Price Consolidates Above $70K, Can Bulls Pump BTC To $75K?

Bitcoin price is consolidating above the $70,000 resistance zone. BTC might remain in a range for some time before the bulls attempt a move toward $75,000.

  • Bitcoin price is struggling to gain pace above the $71,500 resistance zone.
  • The price is trading above $70,500 and the 100 hourly Simple moving average.
  • There is a short-term rising channel forming with support at $70,750 on the hourly chart of the BTC/USD pair (data feed from Kraken).
  • The pair could soon start a fresh rally if it clears the $71,500 resistance zone.

Bitcoin Price Remains In Range

Bitcoin price formed a base above the $69,000 resistance zone. BTC climbed higher the $70,000 resistance zone to move again into a positive zone.

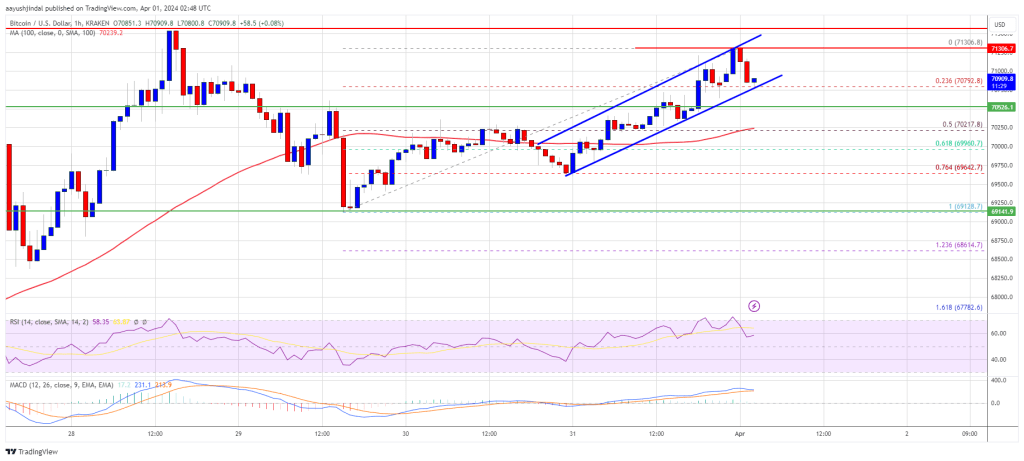
The price broke the $71,000 level but the bears were active below the $71,500 resistance. The recent high was formed near $71,306 and the price is now consolidating gains. It is trading near the 23.6% Fib retracement level of the upward move from the $69,128 swing low to the $71,306 high.

Bitcoin is now trading above $70,500 and the 100 hourly Simple moving average. There is also a short-term rising channel forming with support at $70,750 on the hourly chart of the BTC/USD pair.

Bitcoin Price

Source: BTCUSD on TradingView.com

Immediate resistance is near the $71,300 level. The first major resistance could be $71,500. If there is a clear move above the $71,500 resistance zone, the price could start a strong increase. In the stated case, the price could even clear the $72,500 resistance zone in the near term. The next major resistance is near the $73,500 zone.

Another Drop In BTC?

If Bitcoin fails to rise above the $71,200 resistance zone, it could start another decline. Immediate support on the downside is near the $70,750 level and the channel trend line.

The first major support is $70,200 and the 50% Fib retracement level of the upward move from the $69,128 swing low to the $71,306 high. The next support sits at $70,000. If there is a close below $70,000, the price could start a drop toward the $69,120 level. Any more losses might send the price toward the $68,500 support zone in the near term.

Technical indicators:

Hourly MACD – The MACD is now losing pace in the bullish zone.

Hourly RSI (Relative Strength Index) – The RSI for BTC/USD is now above the 50 level.

Major Support Levels – $70,750, followed by $70,200.

Major Resistance Levels – $71,200, $71,500, and $73,500.