Bitcoin price found support near $67,500. BTC started a fresh increase and might soon revisit the $72,500 resistance zone in the near term.
- Bitcoin retested the $67,500 support zone before it started a fresh increase.
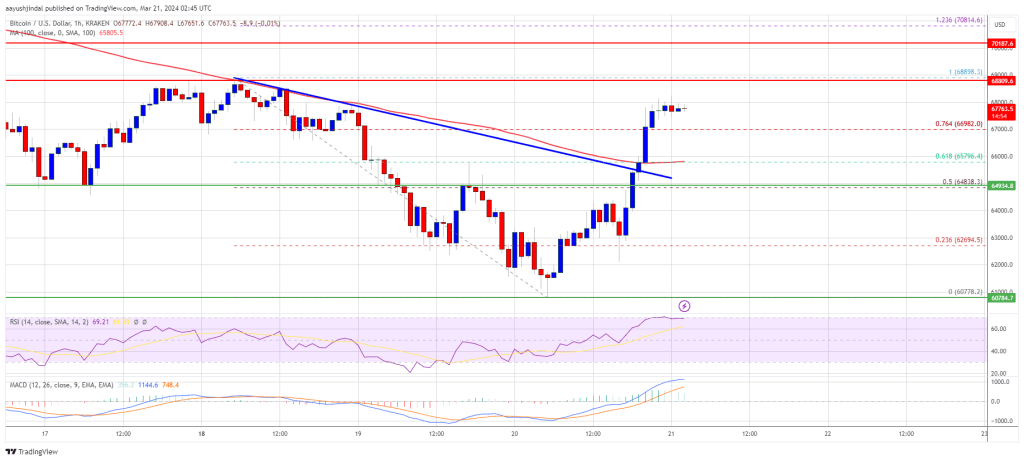
- The price is trading above $70,000 and the 100 hourly Simple moving average.
- There was a break above a key bearish trend line with resistance at $69,600 on the hourly chart of the BTC/USD pair (data feed from Kraken).
- The pair could gain bullish momentum if it clears the $71,400 resistance zone.
Bitcoin Price Holds Support
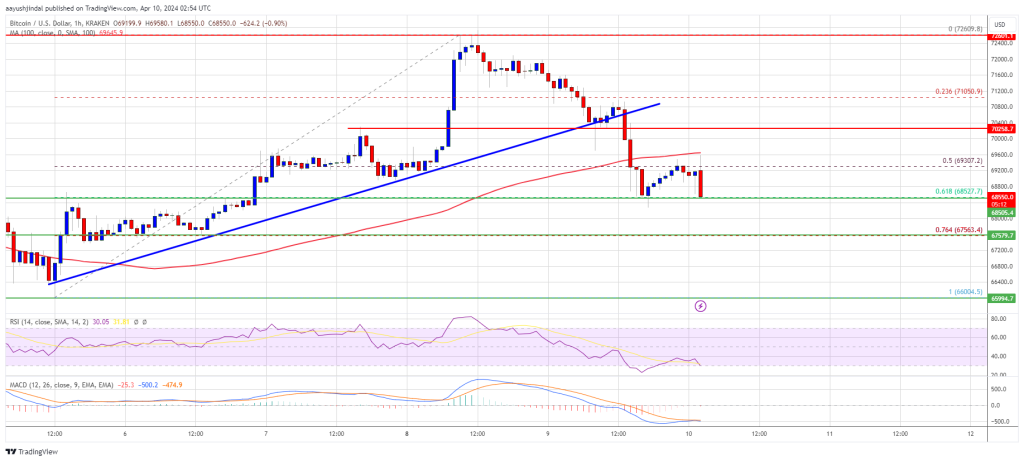
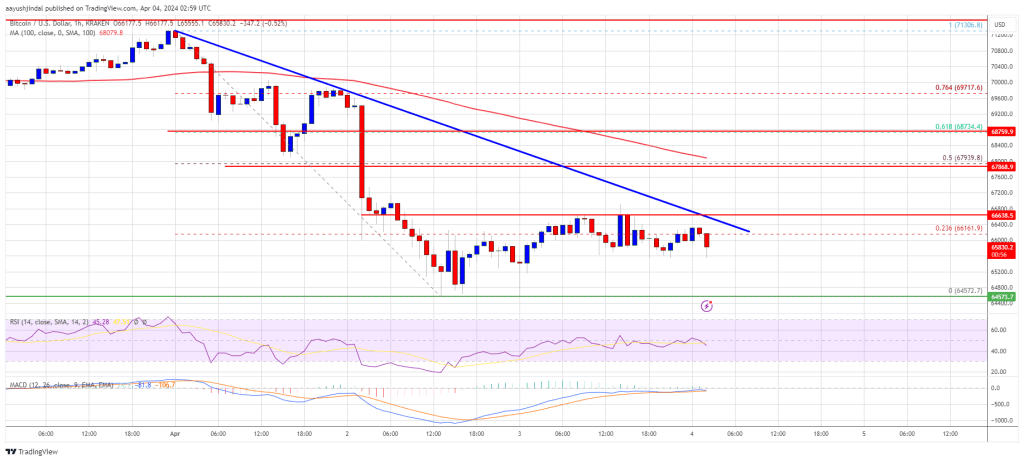
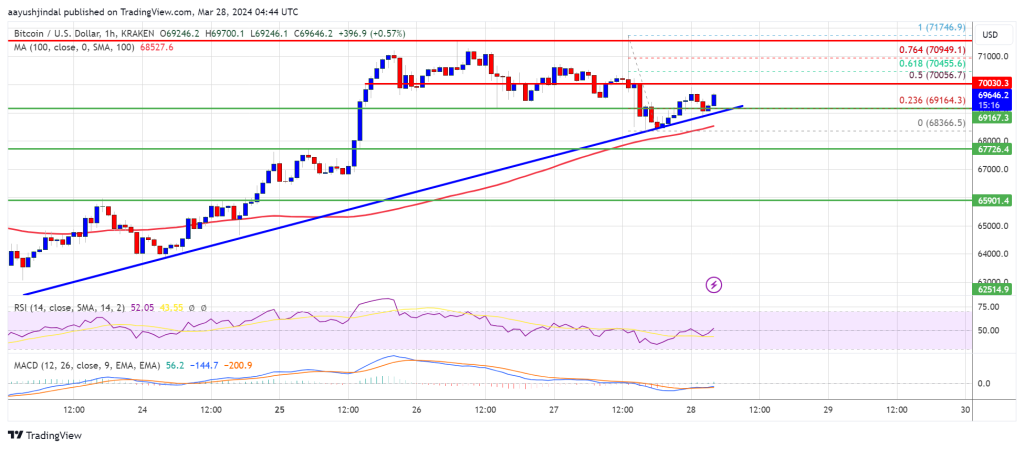
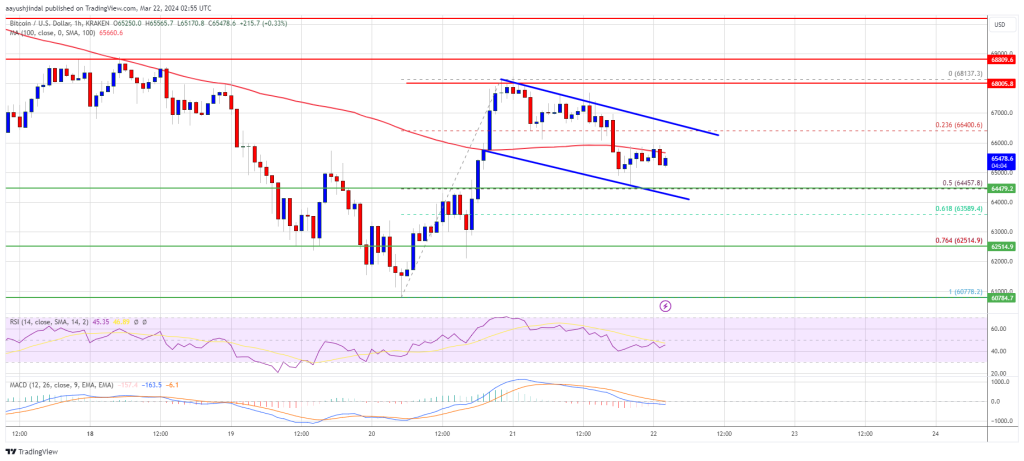
Bitcoin price saw another decline below the $70,000 zone. BTC even dived below the $68,500 level after the US CPI increased more than expected. However, the bulls were active near the $67,500 support.
A low was formed at $67,500 and the price started a fresh increase. There was a move above the $69,200 and $69,500 resistance levels. The price cleared the 50% Fib retracement level of the downward move from the $72,597 swing high to the $67,500 low.
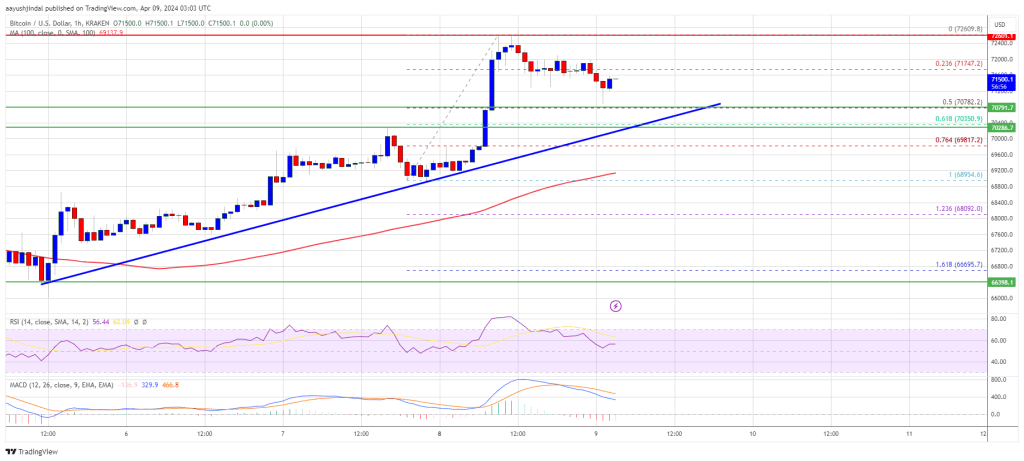
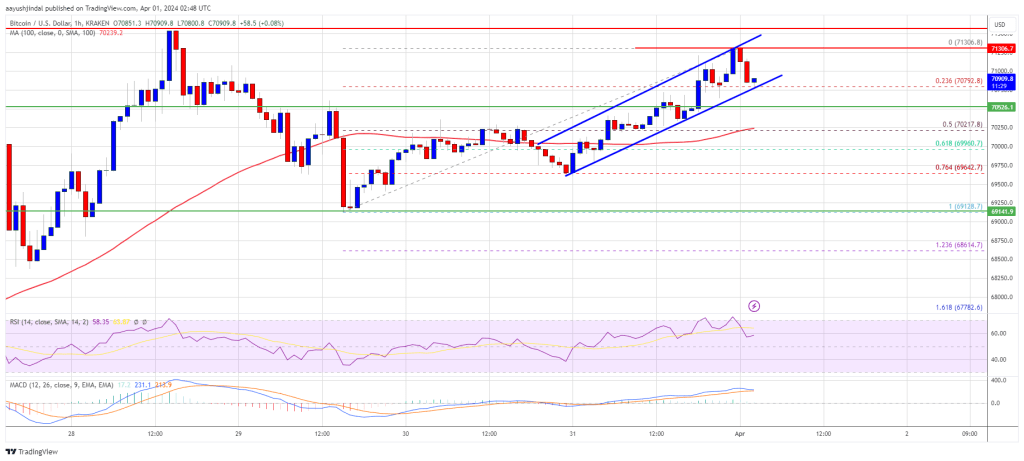
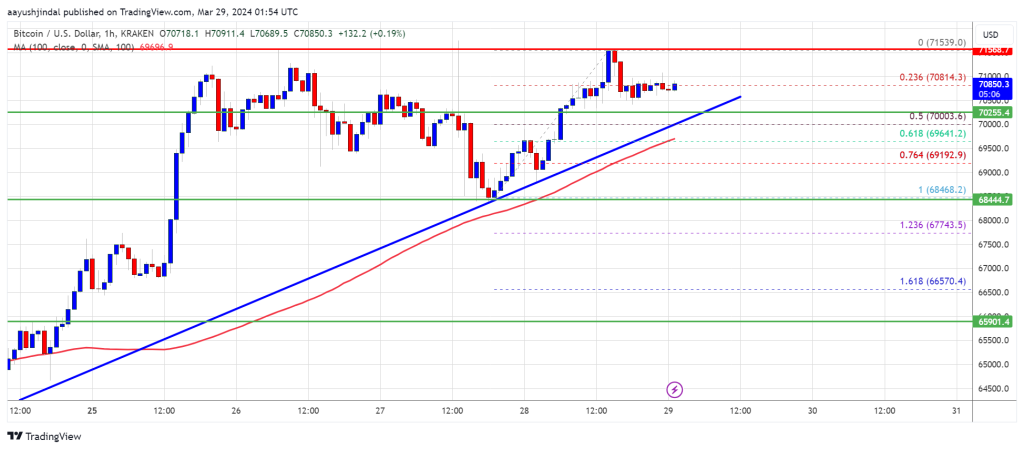
There was a break above a key bearish trend line with resistance at $69,600 on the hourly chart of the BTC/USD pair. Bitcoin is now trading above $70,000 and the 100 hourly Simple moving average.
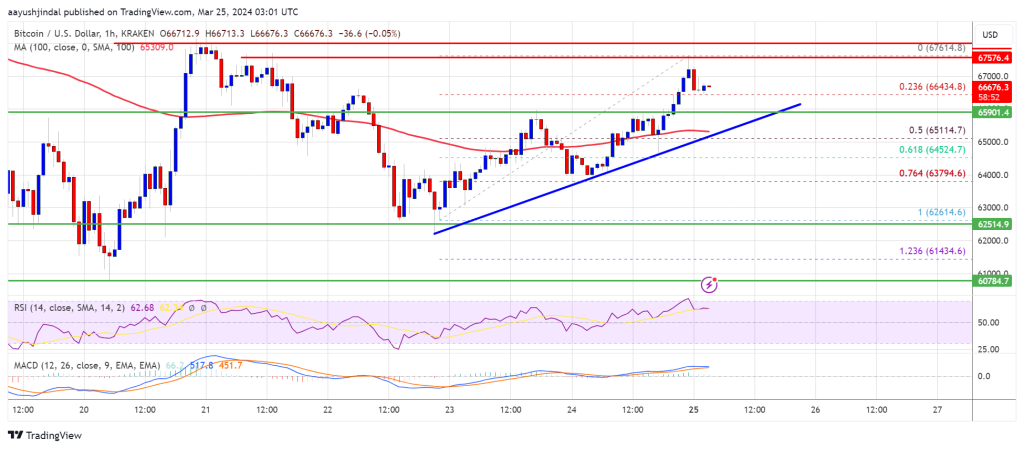
Immediate resistance is near the $71,400 level or the 76.4% Fib retracement level of the downward move from the $72,597 swing high to the $67,500 low. The first major resistance could be $72,500. The next resistance now sits at $72,800. If there is a clear move above the $72,800 resistance zone, the price could continue to move up.
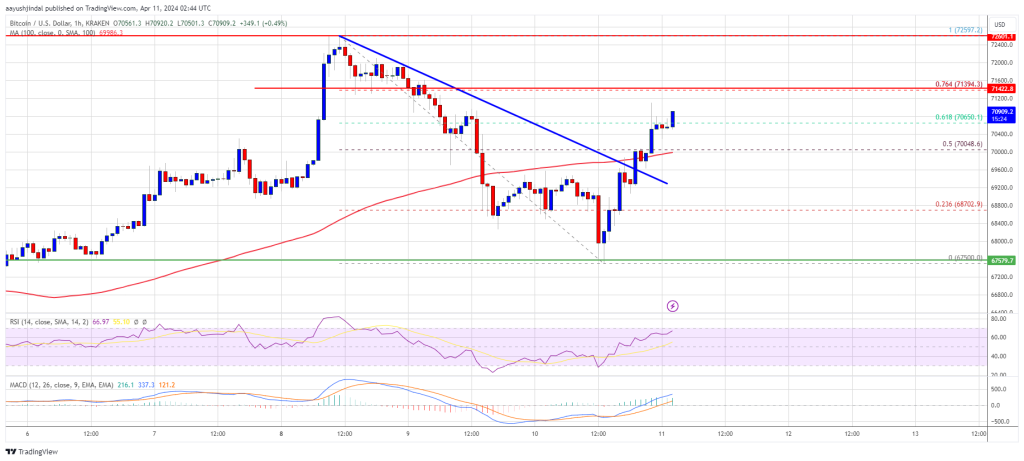
Source: BTCUSD on TradingView.com
In the stated case, the price could rise toward $73,200. The next major resistance is near the $73,500 zone. Any more gains might send Bitcoin toward the $75,000 resistance zone in the near term.
Another Decline In BTC?
If Bitcoin fails to rise above the $71,400 resistance zone, it could start another decline. Immediate support on the downside is near the $70,000 level and the 100 hourly SMA.
The first major support is $69,200. If there is a close below $69,200, the price could start a drop toward the $68,500 level. Any more losses might send the price toward the $67,500 support zone in the near term.
Technical indicators:
Hourly MACD – The MACD is now gaining pace in the bullish zone.
Hourly RSI (Relative Strength Index) – The RSI for BTC/USD is now above the 50 level.
Major Support Levels – $70,000, followed by $69,200.
Major Resistance Levels – $71,400, $72,500, and $73,500.