Bitcoin price failed to recover above the $68,000 resistance zone. BTC is sliding and might decline again toward the $62,000 support zone.
- Bitcoin price started a decent increase but struggled near the $68,000 zone.
- The price is trading below $66,000 and the 100 hourly Simple moving average.
- There is a short-term declining channel or a bullish flag forming with resistance at $66,200 on the hourly chart of the BTC/USD pair (data feed from Kraken).
- The pair must clear the $66,200 resistance zone to start a fresh increase.
Bitcoin Price Faces Hurdles
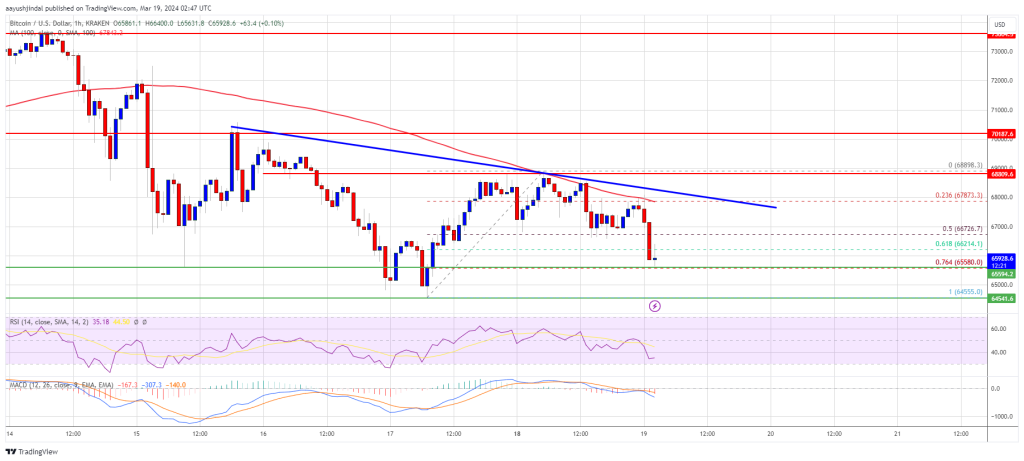
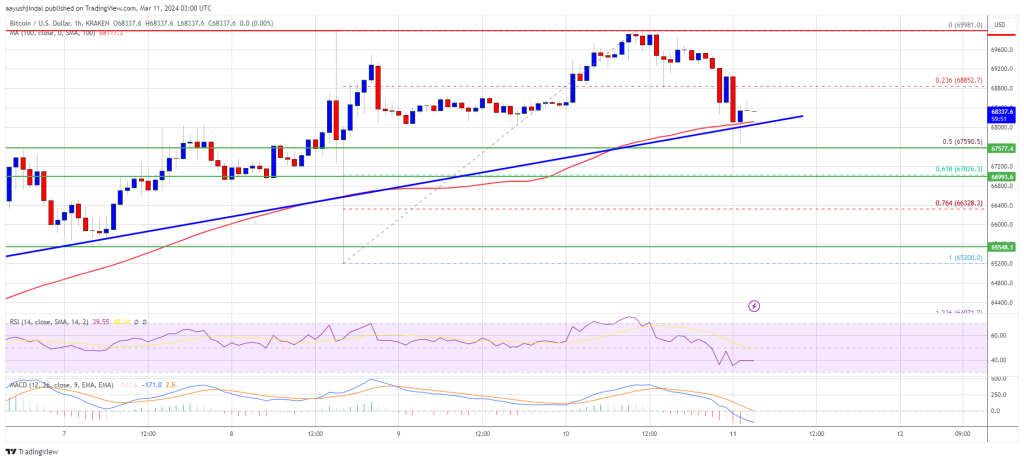
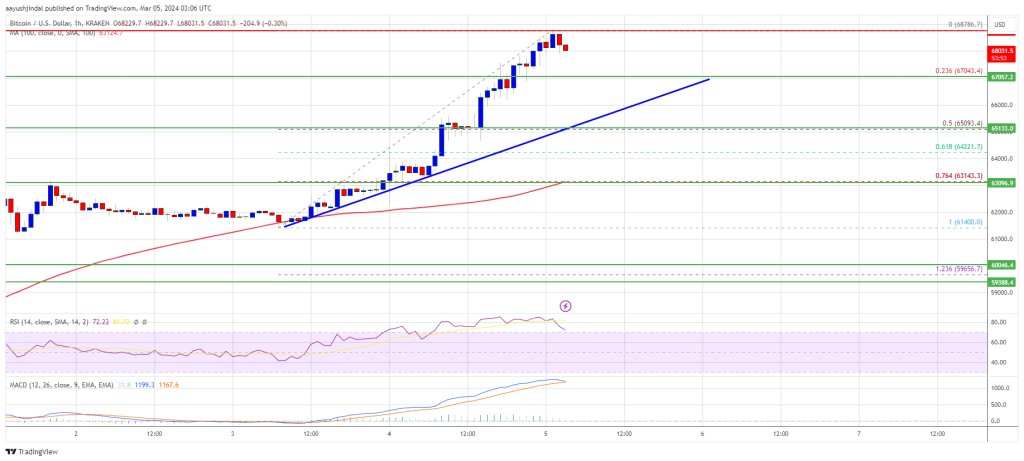
Bitcoin price attempted a decent recovery wave above the $65,000 resistance zone. BTC climbed above the $66,000 and $67,000 levels. However, the bears were active near the $68,000 level.
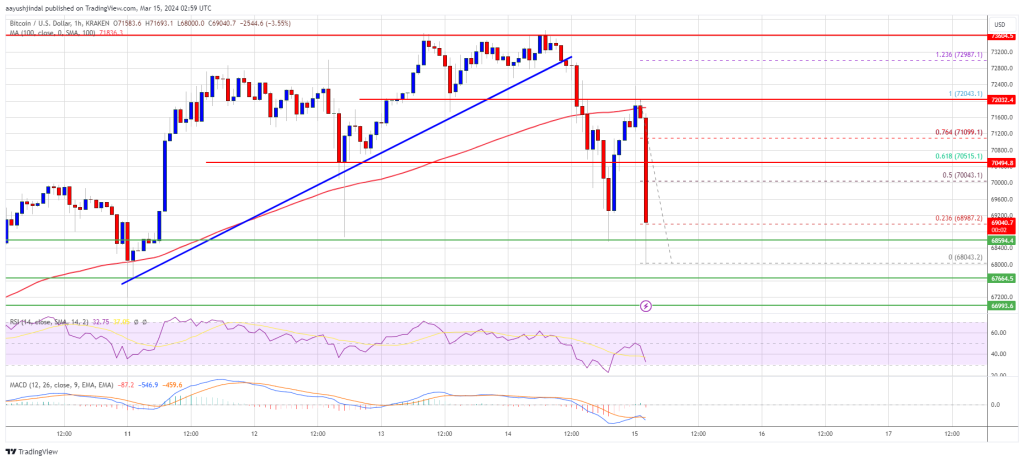
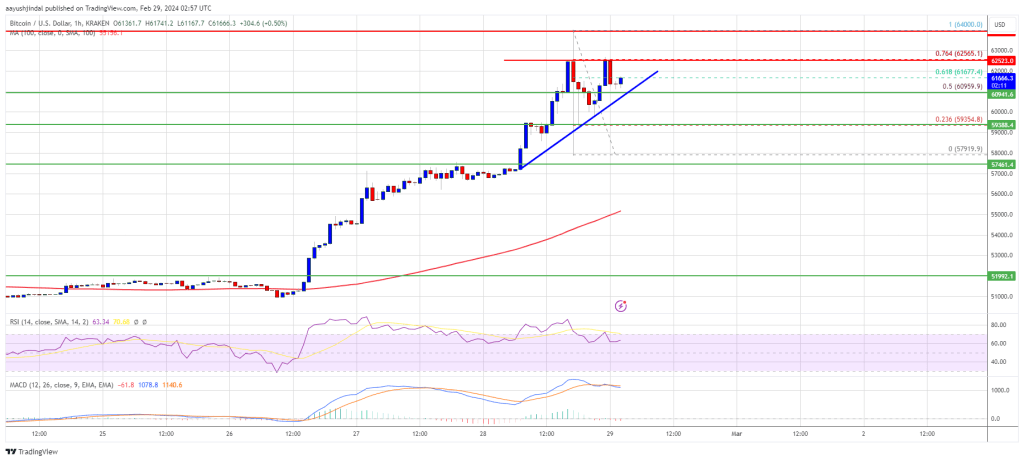
A high was formed at $68,137 and the price is now moving lower. There was a break below the $66,000 support level. The price declined below the 23.6% Fib retracement level of the recovery wave from the $60,778 swing low to the $68,137 high.
Bitcoin is now trading below $66,000 and the 100 hourly Simple moving average. The bulls are now trying to protect the 50% Fib retracement level of the recovery wave from the $60,778 swing low to the $68,137 high at $64,500.
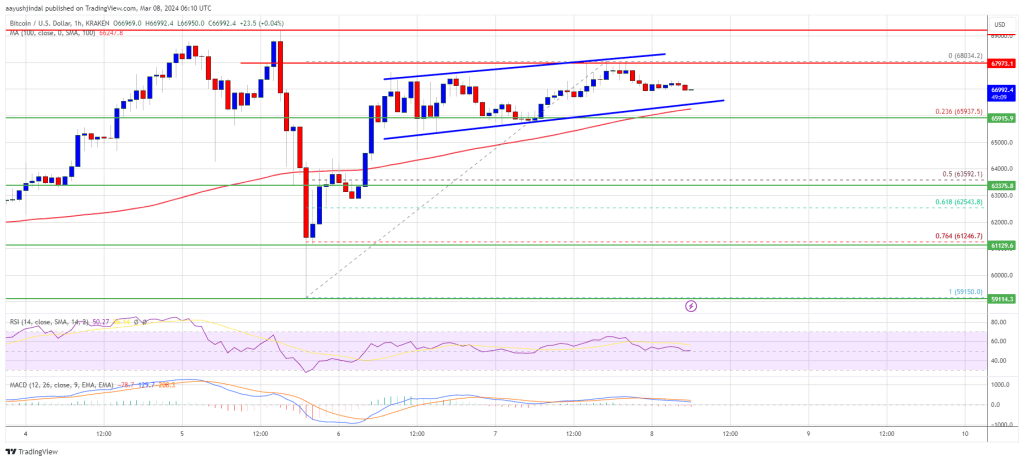
Immediate resistance is near the $66,000 level. There is also a short-term declining channel or a bullish flag forming with resistance at $66,200 on the hourly chart of the BTC/USD pair. The first major resistance could be $67,000.
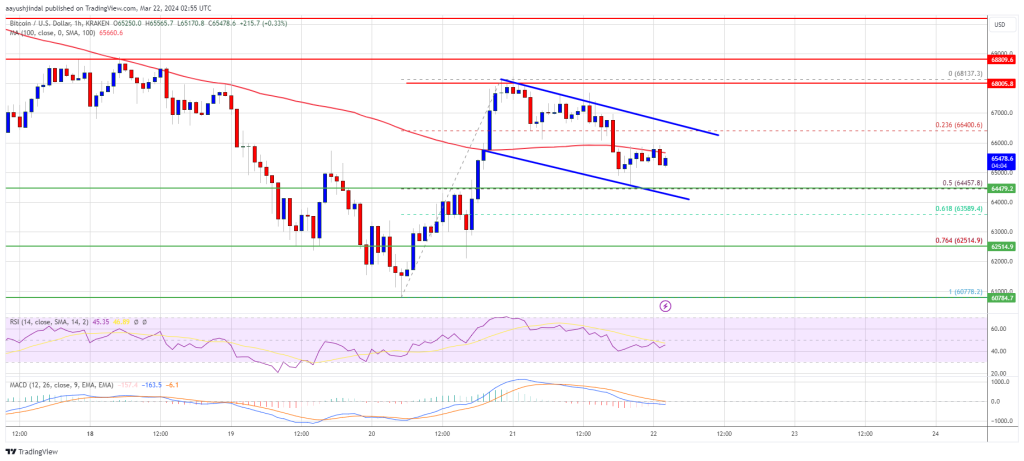
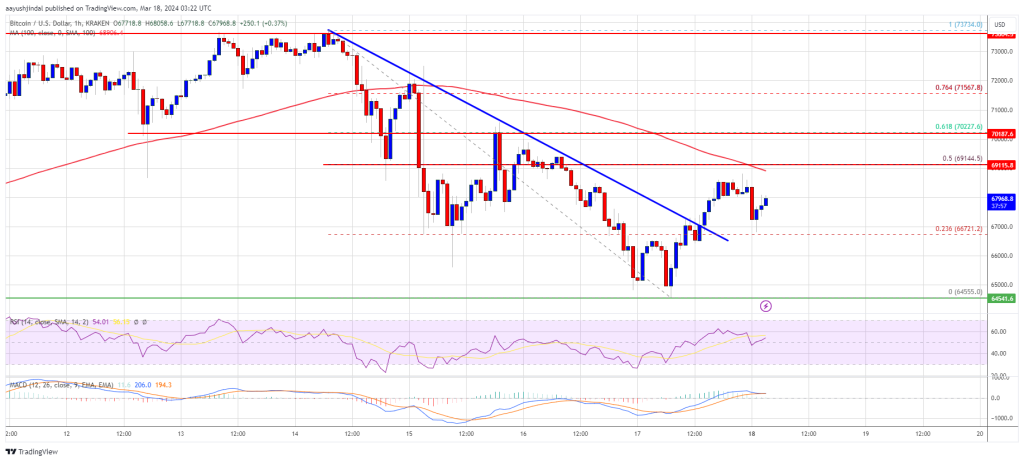
Source: BTCUSD on TradingView.com
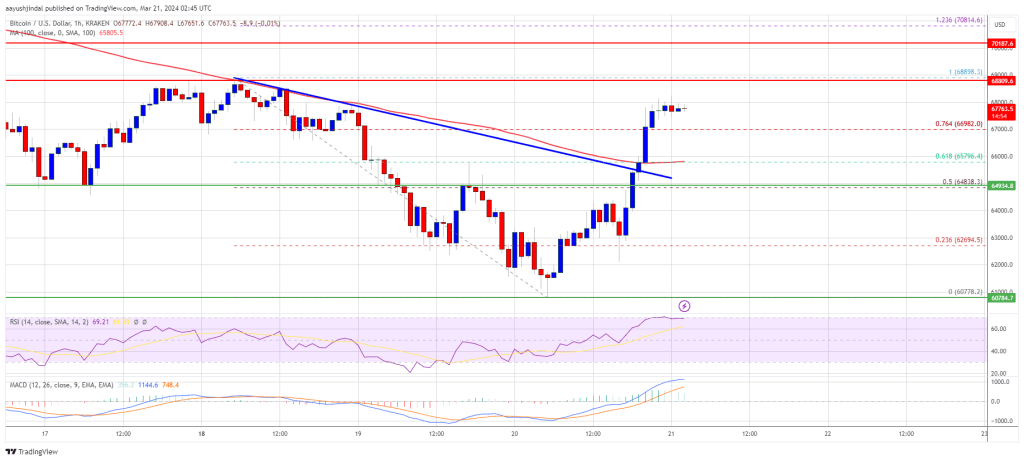
If there is a clear move above the $67,000 resistance zone, the price could continue to gain strength. In the stated case, the price could even clear the $68,000 resistance zone in the near term. The next key resistance sits at $70,000.
More Losses In BTC?
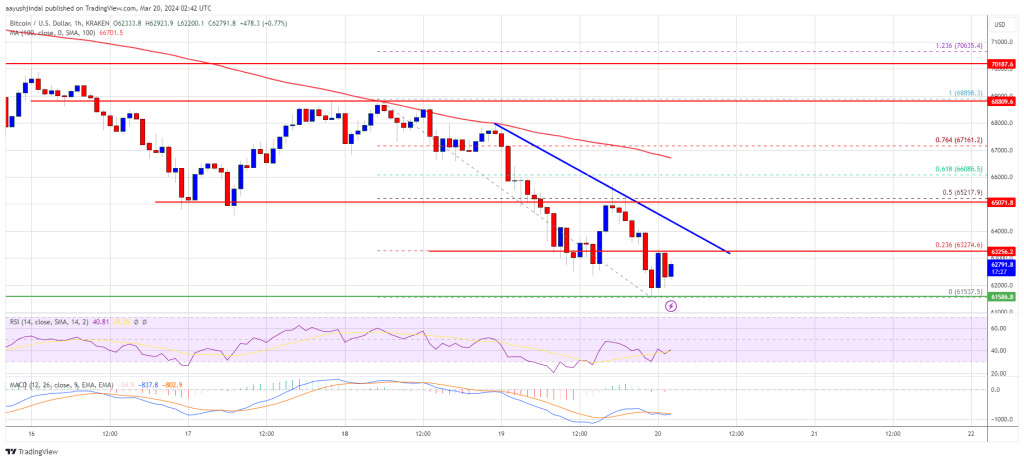
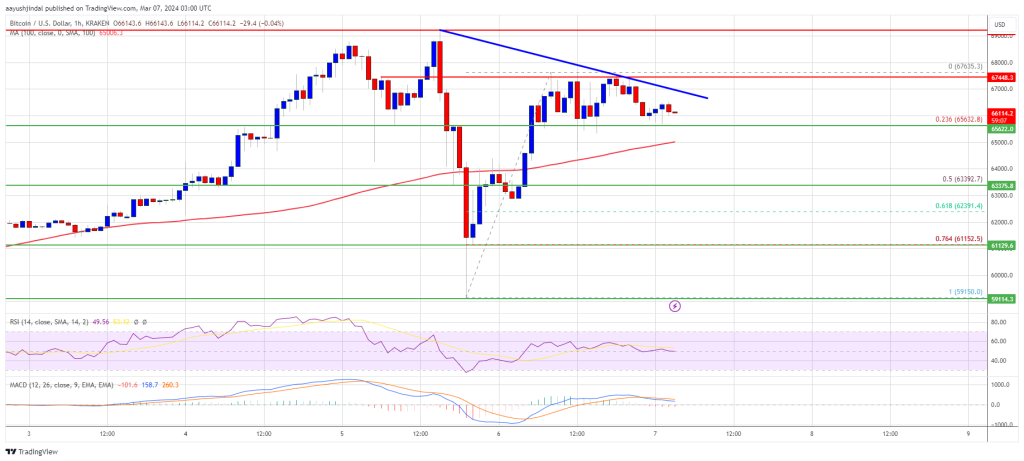
If Bitcoin fails to rise above the $66,000 resistance zone, it could continue to move down. Immediate support on the downside is near the $64,500 level.
The first major support is $63,500. The next support sits at $62,000. If there is a close below $62,000, the price could start a drop toward the $61,200 level. Any more losses might send the price toward the $60,500 support zone in the near term.
Technical indicators:
Hourly MACD – The MACD is now gaining pace in the bearish zone.
Hourly RSI (Relative Strength Index) – The RSI for BTC/USD is now below the 60 level.
Major Support Levels – $64,500, followed by $63,500.
Major Resistance Levels – $66,000, $67,000, and $68,000.