Bitcoin price is struggling to settle above the $68,000 resistance. BTC is now consolidating and might decline toward the $63,400 support zone.
- Bitcoin price is struggling to gain pace for more gains above the new all-time.
- The price is trading above $65,000 and the 100 hourly Simple moving average.
- There is a short-term bearish trend line forming with resistance near $67,000 on the hourly chart of the BTC/USD pair (data feed from Kraken).
- The pair could extend losses and revisit the $63,400 support zone.
Bitcoin Price Faces Hurdles
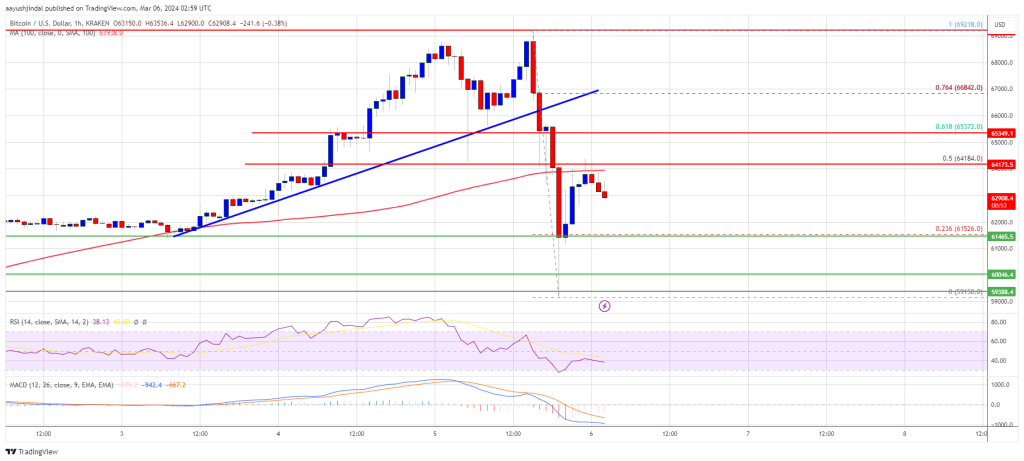
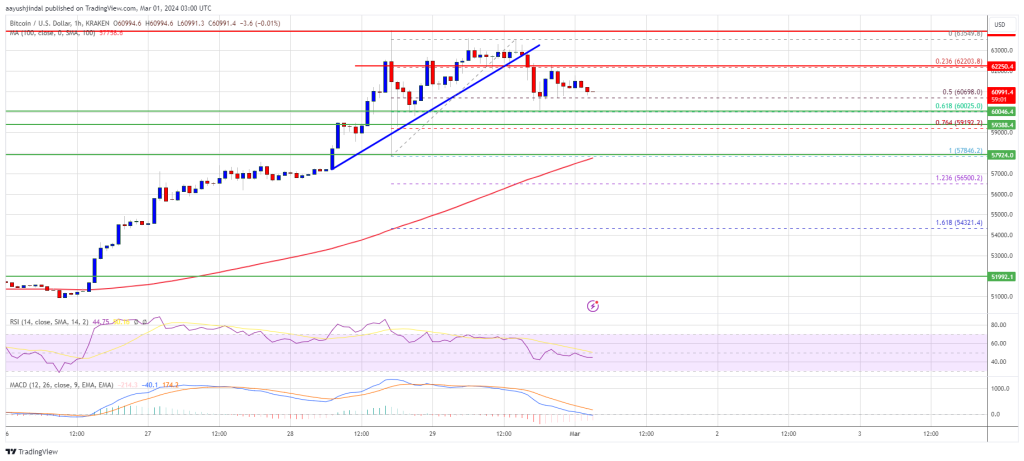
Bitcoin price started a nasty decline from the new all-time high of $69,218. BTC crashed to $59,150 before it trimmed losses. It climbed back above $65,000, but the bears are now protecting more upsides above the $67,500 level.
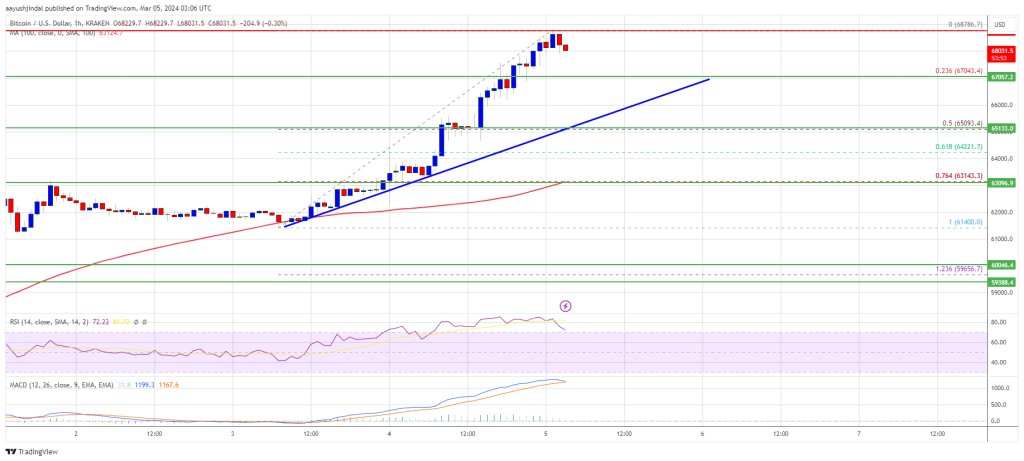
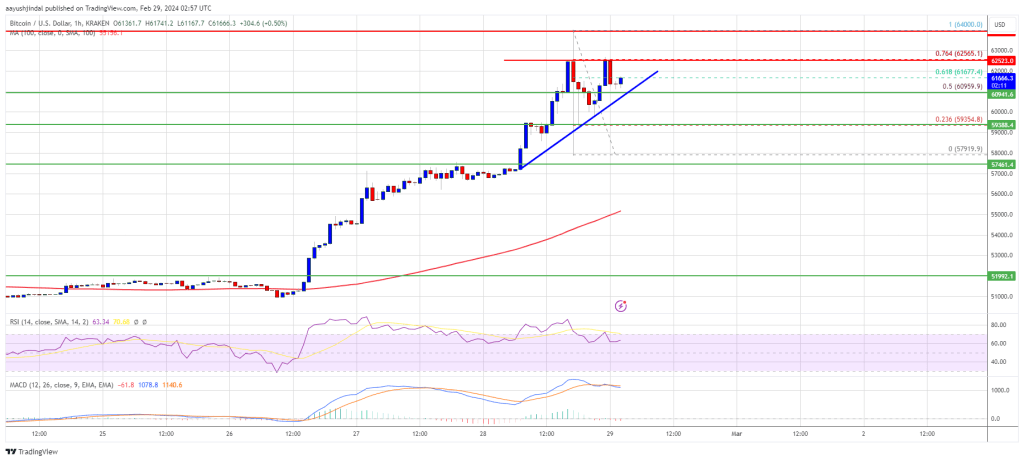
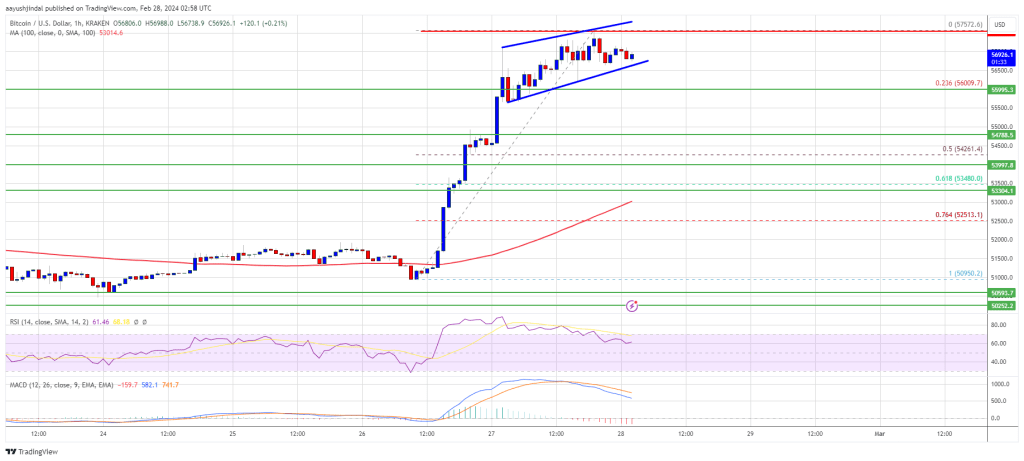
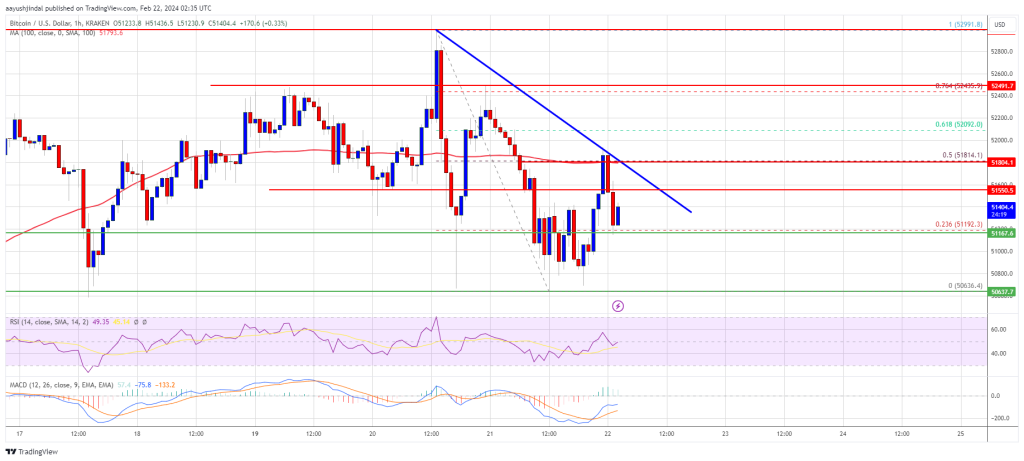
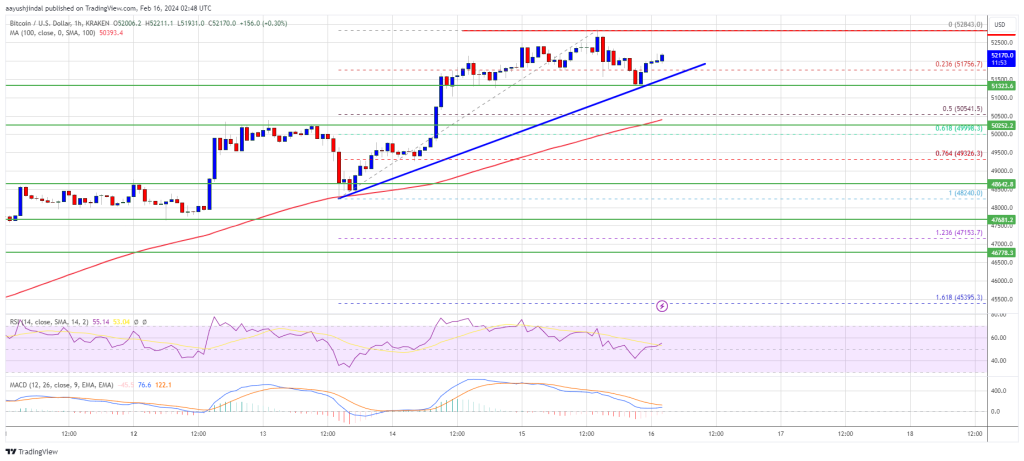
A high was formed at $67,635 and the price is now consolidating. It is trading above the 23.6% Fib retracement level of the upward move from the $59,150 swing low to the $67,635 high.
Bitcoin is still trading above $65,000 and the 100 hourly Simple moving average. Immediate resistance is near the $67,000 level. There is also a short-term bearish trend line forming with resistance near $67,000 on the hourly chart of the BTC/USD pair.
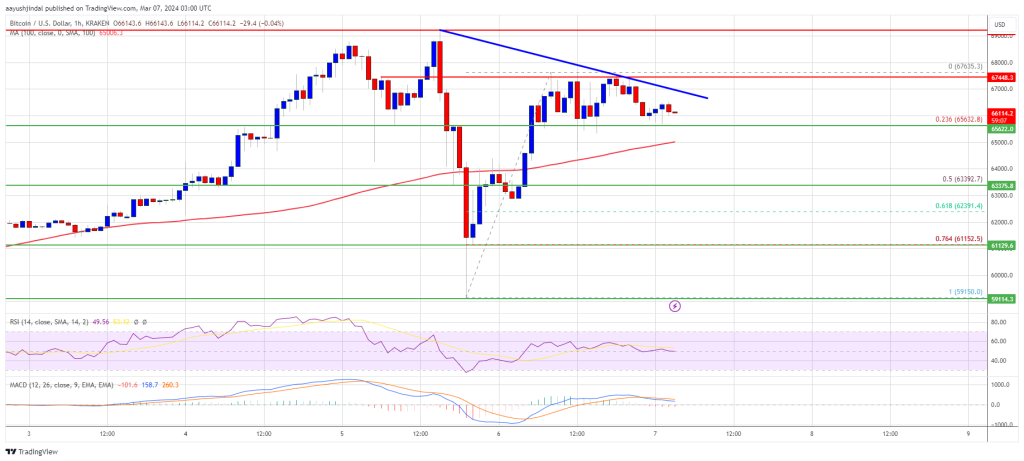
Source: BTCUSD on TradingView.com
The next key resistance could be $68,000, above which the price could rise toward the $69,200 resistance zone. If there is a clear move above the $69,200 resistance zone, the price could rise toward the $70,000 level. Any more gains might send the price toward the $72,000 level.
Another Decline In BTC?
If Bitcoin fails to rise above the $67,000 resistance zone, it could start another downside correction. Immediate support on the downside is near the $66,650 level.
The first major support is $65,000. If there is a close below $65,000, the price could start a decent pullback toward the 50% Fib retracement level of the upward move from the $59,150 swing low to the $67,635 high at $63,400. Any more losses might send the price toward the $62,500 support zone.
Technical indicators:
Hourly MACD – The MACD is now gaining pace in the bearish zone.
Hourly RSI (Relative Strength Index) – The RSI for BTC/USD is now near the 50 level.
Major Support Levels – $65,000, followed by $63,400.
Major Resistance Levels – $67,000, $68,000, and $69,200.