TA: Bitcoin Forms Bullish Pattern, Why BTC Could Climb Above $58K

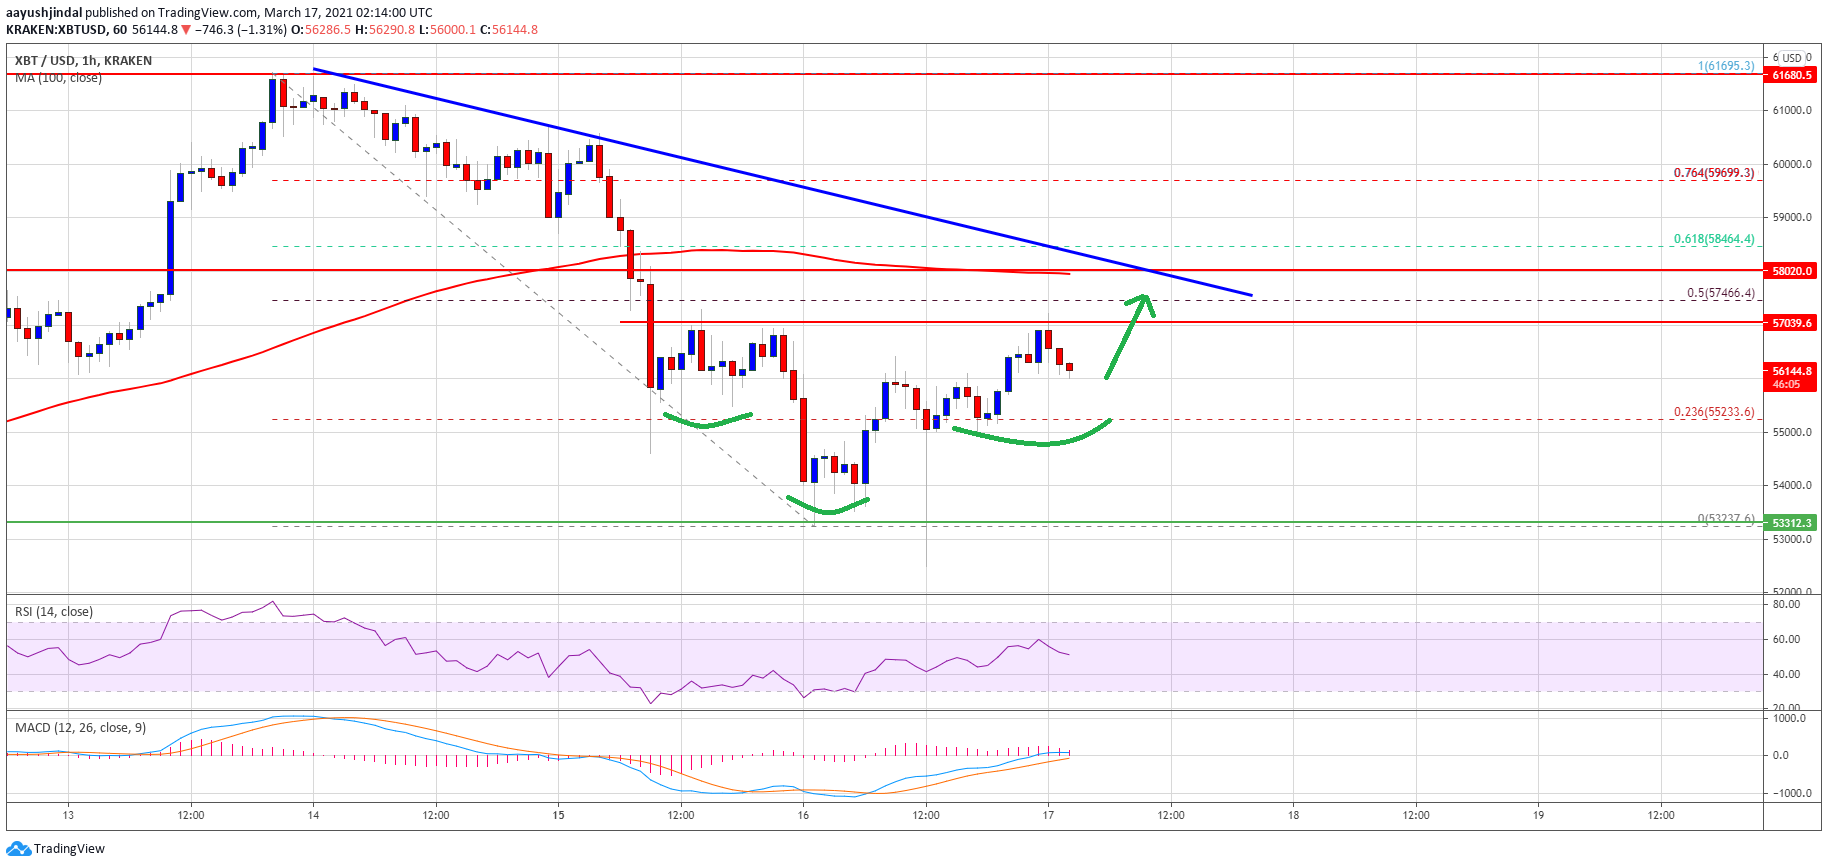
Bitcoin price started a fresh increase after a drop towards $53,000 against the US Dollar. BTC is now forming an inverse head and shoulders, with chances of a break above $58,000.

  • Bitcoin is showing positive signs above the $55,000 support zone.
  • The price is now facing resistance near $58,000 and the 100 hourly simple moving average.
  • There is a key bearish trend line forming with resistance near $58,000 on the hourly chart of the BTC/USD pair (data feed from Kraken).
  • The pair is likely setting up for an upside break above the $58,000 resistance.

Bitcoin Price is Recovering

After a sharp decline, bitcoin found support above the $53,000 level. BTC traded as low as $53,222 and recently started a fresh increase. It cleared the $54,200 and $55,000 resistance levels.

There was a recovery above the 23.6% Fib retracement level of the downward move from the $61,695 high to $53,220 low. The price even climbed above the $56,000 level. However, the price is facing resistance near $58,000 and the 100 hourly simple moving average.

It seems like there is a possible inverse head and shoulders pattern forming with resistance near the $57,000 level. There is also a key bearish trend line forming with resistance near $58,000 on the hourly chart of the BTC/USD pair.

Bitcoin Price

Source: BTCUSD on TradingView.com

The trend line is close to the 50% Fib retracement level of the downward move from the $61,695 high to $53,220 low. A successful break above the trend line resistance could open the doors for a decent increase towards the $58,800 and $60,000 levels.

Fresh Dip in BTC?

If bitcoin fails to correct higher above the $57,000 and $58,000 resistance levels, it could start a fresh decline. The first key support on the downside is near the $55,000 level.

The next key support is near the $54,200 level. If there is a clear break below the $54,200 level, the price is likely to continue lower in the coming sessions. The next major support is near $53,200, below which the bears might aim a test of the $50,000 support level.

Technical indicators:

Hourly MACD – The MACD is slowly gaining momentum in the bullish zone.

Hourly RSI (Relative Strength Index) – The RSI for BTC/USD is struggling to stay above the 50 level.

Major Support Levels – $55,000, followed by $54,200.

Major Resistance Levels – $57,000, $57,500 and $58,000.
Following Bitcoin “Reset,” It’s “Off To The Races Again”

Even with an ongoing bull trend and another round of stimulus money rolling out, Bitcoin price has pulled back from highs set over the weekend.

According to one crypto analyst, this could be the start of a more significant “reset” before its” off to the races” once again for the scarce digital currency. Here’s a look at the analyst’s chart and the factors backing up their contrarian theory.

Bitcoin Peak Is Nigh, Massive “Reset” Could Be Incoming

By all definitions of the term, Bitcoin is in an uptrend, and the greater cryptocurrency market with it. The nascent technology is being adopted by institutions and investors at a rapidly expanding rate, all while the dollar itself is devalued due to inflation.

Related Reading | Bitcoin Could Close March With First Ever Quarterly Bear Signal

The environment has been the perfect storm for the cryptocurrency to thrive, given its hard-capped supply of only 21 million BTC. Even less are circulating and millions are lost or locked away forever.

While there’s no arguing that Bitcoin’s long-term value should bring it to prices of hundreds of thousands per coin, according to one crypto analyst, a great “reset” could be coming for the top cryptocurrency by market cap.

bitcoin Dave the wave

The analyst expects a fall back to the "zero-line" on the MACD | Source: BTCUSD on TradingView.com

How Long Before Cryptocurrency Bulls Are Back Off To The Races Again?

According to cryptocurrency analyst Dave the Wave, who has supplied accurate analysis to the community through his Twitter soapbox for years now, Bitcoin could be looking at a strong “reset.”

Things might have taken off too quickly and too powerfully for Bitcoin price this time around, causing the LMACD to become overextended and brushing up against a long-term trendline. If the weekly MACD crosses down, momentum will take the price per coin plunging down fast and furious.

Related Reading | Data Shows Bitcoin Peaks Last Roughly 40 Days: When To Sell Your Coins

At the same time, price action is trading at the top of a long-term logarithmic growth channel that has acted as the exact peak of past bull markets.

The pseudonymous analyst is a champion of the log scale, charting crypto assets like Bitcoin using logarithmic growth curves and a logarithmic version of the MACD.

A potential fall to the LMACD’s “zero-line” could be in the cards, immediately followed by the crypto asset being back “off to the races” once again.

How long the reset takes, where it goes, and if it happens at all is only speculation, and one theory of many that exist calling for higher prices.  However, in the past, the analyst’s accuracy makes this contrarian take one that cannot be ignored.

Featured image from Deposit Photos, Charts from TradingView.com

Bloody Monday: Yesterday’s Bitcoin Selloff Saw Record $1.6B In Liquidations

Bitcoin price fell yesterday by over 10%, and price action has been on a downward descent since. The selloff was in response to a variety of factors, including the introduction of a new ban in India, a CFTC probe into Binance, and a debate over what was thought to be whale moving a billion in BTC.

During the correction, the second-highest record ever was set for largest amount of money liquidated in long positions. Interestingly, the last major correction was far deeper, but saw a similar level of liquidations. Here’s what that means for market sentiment, and how that could impact Bitcoin price action in the days ahead.

bitcoin selloff

The second highest ever total long liquidations happened during yesterday's blood bath | Source: BTCUSD on TradingView.com

Monday Bitcoin Bloodbath Results In Second-Largest Purge Of Longs Ever

During most of 2020 aside from the initial onset of the pandemic, Bitcoin price was immune to any negative news, and kept on climbing against all odds.

The asset’s perfect storm macro environment has propelled it into the limelight of the finance industry, and to a price beyond $60,000 per coin over this weekend’s high.

Related Reading | Bitcoin Could Close March With First Ever Quarterly Bear Signal

Whether its due to technicals being overheated, a string of bad news, or the fact that traders were so heavily overleveraged, a selloff cut the price per BTC back by 10% starting late Sunday night into Monday afternoon.

The selling continues, though bulls are showing signs of building support. During the madness, some $1.6 billion of margin longs were liquidated, according to data from Arcane Research.

More than $1.6 billion in over leveraged traders were liquidated on Monday | Source: Arcane Research

Why Did The Correction Wipe Out So Many Cryptocurrency Traders?

Bitcoin is in a bull market, and whenever the trading range makes a clean breakout, the asset has been traveling at the rate of tens of thousands per month.

The trend has been “only up” resulting in very few pullbacks aside from this latest one, and two other sizable corrections. The largest ever recorded, according to Arcane Research, was only a mere few million higher than the most recent crash, even despite a significantly less severe decrease in the same timeframe.

Related Reading | Data Shows Bitcoin Peaks Last Roughly 40 Days: When To Sell Your Coins

Clearly, sentiment is overly bullish, and that has left some bulls too eager to get into position for the next move higher. Many in Bitcoin could also now be in enormous profit, much more willing to take a gamble at current levels than before.

Whatever the reason, the traders have been targeted, and could act as a floodgate of liquidity until the leverage across the market decreases, and prices can rise again naturally.

Featured image from Deposit Photos, Charts from TradingView.com

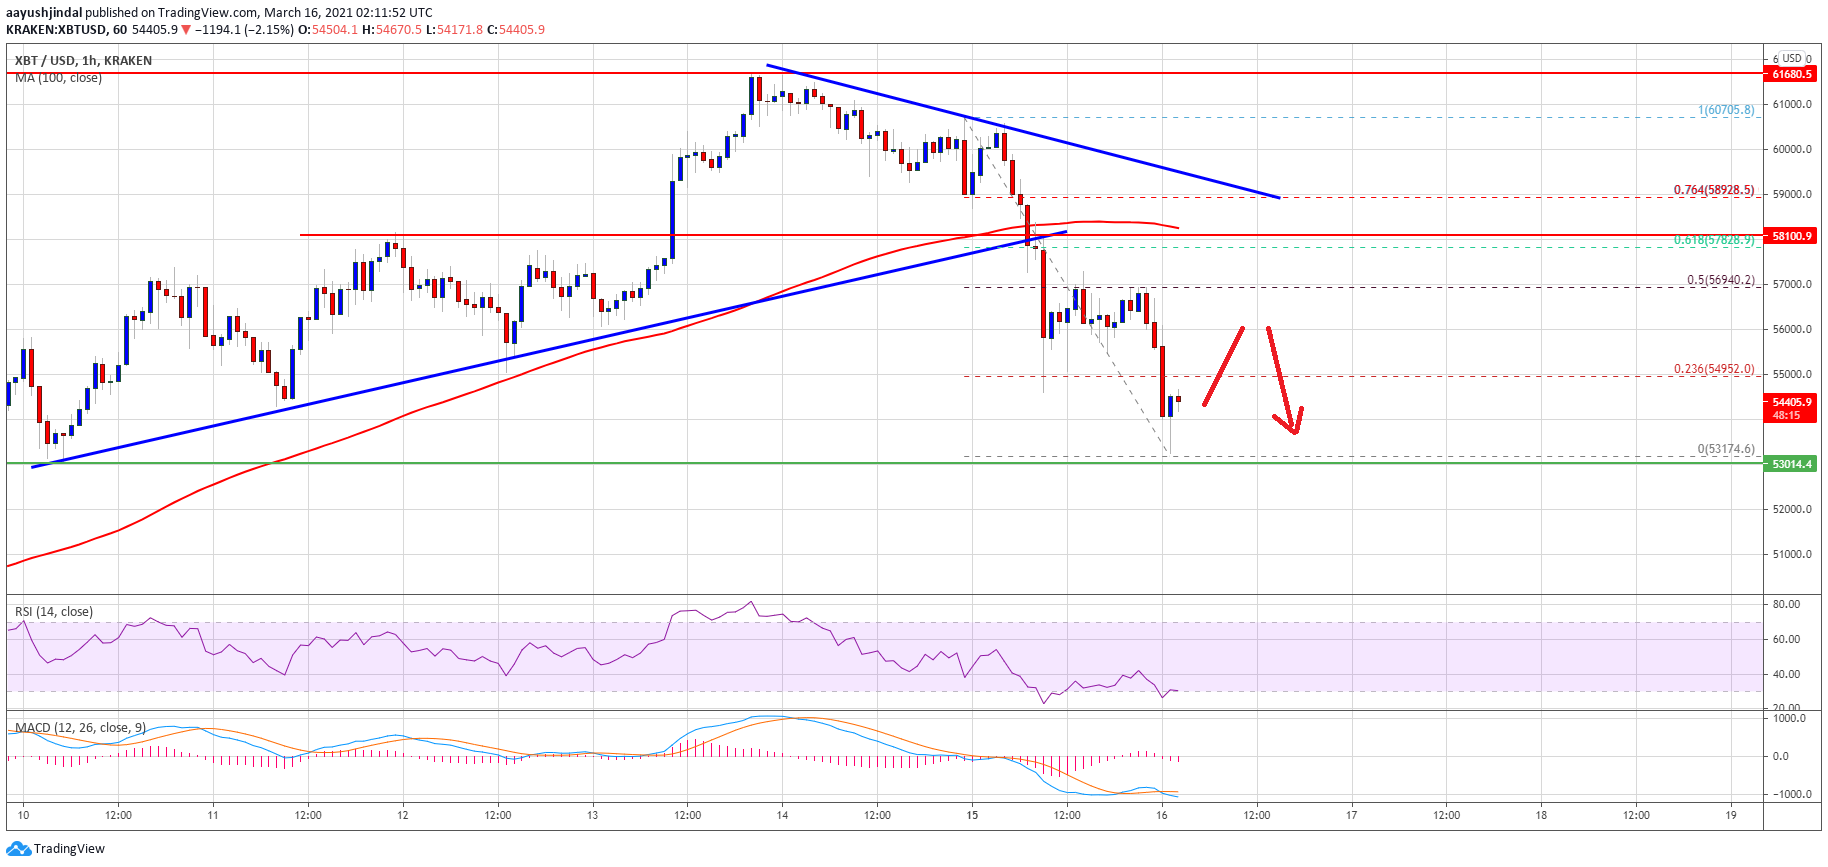
TA: Bitcoin Corrects 10%, Why BTC Could Extend Losses

Bitcoin price started a major downside correction and it traded below $55,000 against the US Dollar. BTC is showing a few bearish signs and it could extend losses towards $52,000.

  • Bitcoin started a major decline and it broke the $58,000 and $55,000 support levels.
  • The price is now trading well below $58,000 and the 100 hourly simple moving average.
  • There was a break below a crucial bullish trend line with support near $58,100 on the hourly chart of the BTC/USD pair (data feed from Kraken).
  • The pair is trading near $53,500 and it could correct higher in the short-term.

Bitcoin Price Declines Sharply

After a rejection above the $60,000 level, bitcoin started a major downside correction. BTC broke many important supports near $58,000 to move into a short term bearish zone.

There was also a break below a crucial bullish trend line with support near $58,100 on the hourly chart of the BTC/USD pair. The pair accelerated its decline below the $55,500 and $55,000 support levels. Finally, it tested the $53,000 support zone and formed a low at $53,174.

It is now trading well below $58,000 and the 100 hourly simple moving average. On the upside, an initial resistance is near the $54,950 level. It is close to the 23.6% Fib retracement level of the downward move from the $60,705 high to $53,174 low.

Bitcoin Price

Source: BTCUSD on TradingView.com

The first major resistance is forming near the $57,000 level. The 50% Fib retracement level of the downward move from the $60,705 high to $53,174 low is also near $57,000. The main resistance is forming near the $58,000 level (the recent breakdown zone). A close above $58,000 is must to move back into a positive zone.

More Losses in BTC?

If bitcoin fails to correct higher above the $56,500 and $57,000 resistance levels, it could further correct lower. The first key support on the downside is near the $53,200 level.

The next key support is near the $52,000 level. If the bulls fail to protect the $52,000 support zone, the price could dive towards the $50,000 support level in the next few sessions.

Technical indicators:

Hourly MACD – The MACD is now gaining momentum in the bearish zone.

Hourly RSI (Relative Strength Index) – The RSI for BTC/USD is well below the 50 level.

Major Support Levels – $53,200, followed by $52,000.

Major Resistance Levels – $55,000, $57,000 and $58,000.

Capital Manager: Bitcoin Holding Above $52K Puts Crypto On Track For $100K

Bitcoin price has retraced by more than 10% following new record highs set over the weekend, however, according to one capital manager, the cryptocurrency holding above $52K would keep price action within a long-term rising bull channel.

If that happens, the first ever cryptocurrency will remain on track for $100K or more in the coming months ahead. Here’s a closer look at the bullish uptrend channel keeping the ongoing rally afloat, and what might happen next.

Bitcoin Must Hold Bull Trend Channel At $52K, Claims Capital Manager

Speculation over Bitcoin price action has turned from blasting toward new highs to correction. The leading cryptocurrency by market cap bled out more than 10% in a sharp move overnight, which could be the start of some deeper downside.

Related Reading | Expert Take: Bitcoin Has Become A Monetary “Manipulation Gauge”

But as long as Bitcoin price holds above $52K, according to Vailshire Capital CEO Jeff Ross, a long-term, parallel bull channel will remain in tact.

The parallel uptrend channel, according to Ross’ chart, began with a breakout above the former all-time high at $20K Since then, price action has ping-ponged within the rising, bullish channel, taking the asset to three-times that former peak.

bitcoin bullish

Bitcoin price is still trading well within the parallel bull trend channel | Source: BTCUSD on TradingView.com

Crypto Correction Within Larger Bull Trend “Confines,” Track To $100K Intact

Ross also says that if this uptrend channel holds, Bitcoin price is well on its way to prices of $100K per coin or higher in the coming months all based on the current technical picture.

Fundamentally, Ross says that on-chain metrics such as address growth and blockchain activity are bullish, and the macro environment is “wildly bullish” for Bitcoin.

Related Reading | Bitcoin Price Could Close March With First Ever Quarterly Bear Signal

The comment is likely in reference to that fact that the US government just issued another trillion dollar stimulus package, in which checks will begin showing up in the accounts of potential crypto investors this week.

Ongoing monetary supply expansion and fresh and free capital ready to flow into the cryptocurrency’s market cap, could keep the price per coin increase coming.

Several technicals are also favoring bears, which could make for an interesting and volatile few weeks ahead and March comes to a close.

Bitcoin is indeed “wildly bullish” by most standards, however, March is the worst month in the asset’s short history, and there are bearish divergences stacking on the quarterly candle closing at the end of the month for the first time ever.

Can the bullish uptrend channel Ross points out withstand the factors above, and can stimulus money keep the macro environment far too bullish for bears to gain an edge?

Featured image from Deposit Photos, Charts from TradingView.com

How Bitcoin Will Become A “Report Card” On The Government

Bitcoin price has pulled back slightly from highs, but the trend has been up for over a year now, and is likely to continue as the nascent technology becomes widely adopted by institutions and traditional market investors.

In the future, the cryptocurrency, according to a top industry figure, will become a “report card” of sorts, scoring the government and its management of monetary policy. Here’s what that means for Bitcoin and why the asset will eventually take on such a role.

Bitcoin To Become Report Card On The Government

The narratives driving Bitcoin these days are nearly endless. There’s the devaluing of precious metals through the digital gold narrative; the currency as the future of collateral; “the stimulus asset”; and much more.

Related Reading | Bitcoin Price Could Close March With First Ever Quarterly Bear Signal

The next narrative and role that the cryptocurrency is will play, according to Galaxy Digital CEO Mike Novogratz, is “report card for how citizens think the government is doing managing their finances.”

These sentiments echo Bitcoin expert Preston Pysh, who recently called the cryptocurrency a “manipulation gauge.” Both comments are in reference to the asset growing rapidly in response to ongoing money supply expansion, driven by government-led stimulus packages.

The United States, for example, has just approved and begun issuing stimulus checks to taxpayers in the amount of $1,400 a piece.

bitcoin black thursday report card

Bitcoin is already working as a report card, giving the government a failing grade | Source: BTCUSD on TradingView.com

Cryptocurrency Will Complete “Secular Shift” Before Making The Grade

Currently, the cryptocurrency is pulling back after a rejection from new highs, but this latest abuse of taxpayer money and a multi-trillion dollar bill that the country’s citizens will foot for years, says that Bitcoin will grow significantly if the report card theory is sound.

When stimulus efforts first began rolling out in 2020, Bitcoin price was still reeling from the Black Thursday panic selloff when the pandemic first struck. The first stimulus checks sent out at $1,200 invested in BTC, would now be worth over $11,000 today.

Related Reading | Expert Take: BTC Has Become A Monetary “Manipulation Gauge”

Those who voted against the government with their dollars that day, now have substantial profits to show for it. The more the government mismanages monetary policy, the larger the cryptocurrency’s market cap will grow, enabling the “report card” effect that Novogratz speaks of.

But before then, he says Bitcoin still has to complete the ongoing “secular shift” in which the asset class has become validated in the eyes of finance, and now every insurance fund, endowment, and more must begin adding it to their portfolio, or risk missing out on capital growth in a disruptive sector.

Featured image from Deposit Photos, Charts from TradingView.com

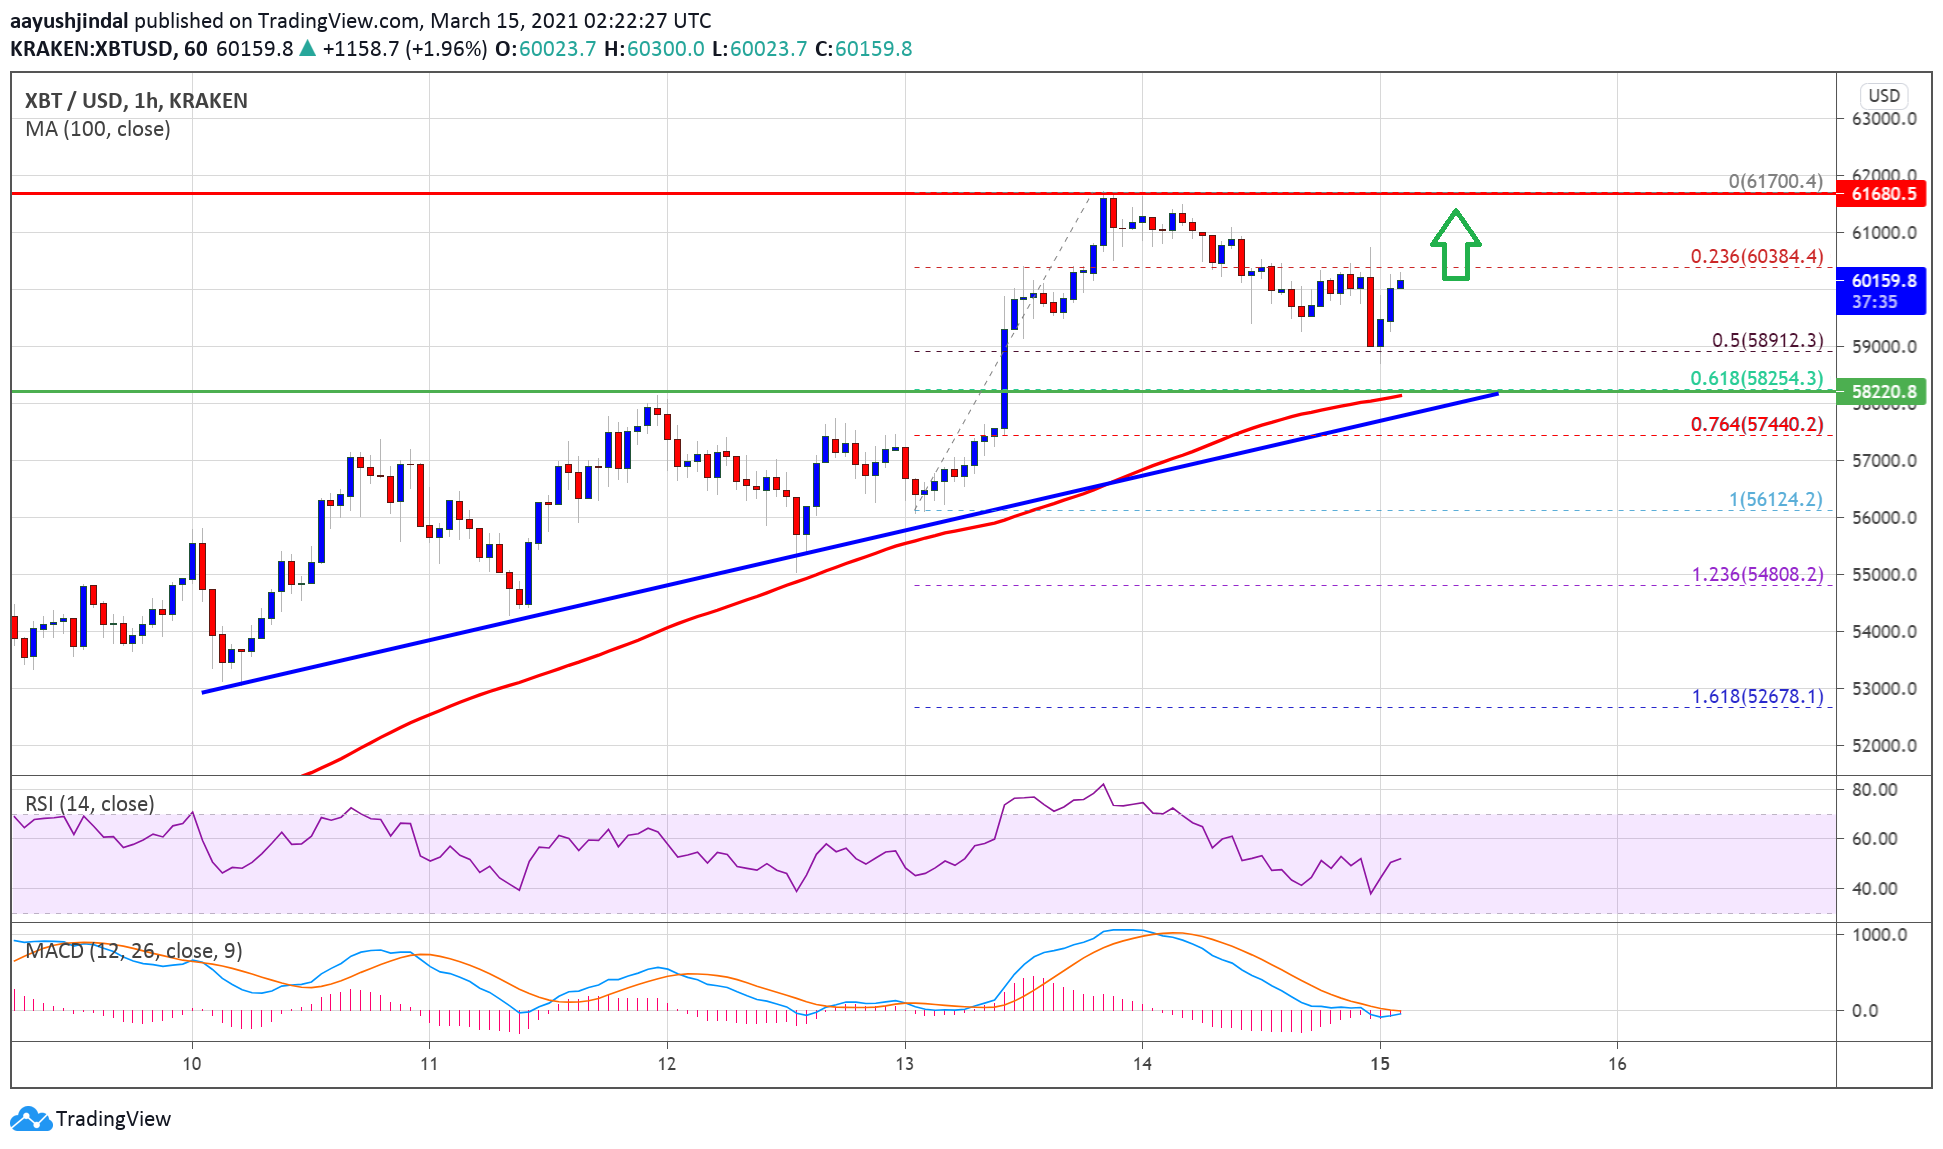
TA: Bitcoin Steadies Near $60K, Why BTC Could Surpass $62K

Bitcoin price started a downside correction from the $61,700 high against the US Dollar. BTC is holding gains above the $58,500 and $58,000 support levels.

  • Bitcoin gained bullish momentum above $60,000 and it even traded above $61,500.
  • The price corrected lower below $60,000, but it is still well above the 100 hourly simple moving average.
  • There is a key bullish trend line forming with support near $58,200 on the hourly chart of the BTC/USD pair (data feed from Kraken).
  • The pair is climbing again and it seems like the bulls are likely to aim a test of $62,000.

Bitcoin Price Remains in a Strong Uptrend

There was a strong increase in bitcoin above the $55,000 and $58,000 resistance levels. BTC even cleared the $60,000 resistance and settled well above the 100 hourly simple moving average.

It traded to a new all-time high near $61,700 before starting a downside correction. There was a break below the $61,000 support level. The price even traded below the 23.6% Fib retracement level of the upward move from the $56,124 swing low to $61,700 high.

However, the bulls were active above the $58,500 and $58,800 levels. There is also a key bullish trend line forming with support near $58,200 on the hourly chart of the BTC/USD pair.

Bitcoin Price

Source: BTCUSD on TradingView.com

Bitcoin also remained stable above the 50% Fib retracement level of the upward move from the $56,124 swing low to $61,700 high. It is now rising and trading nicely above $59,500. An immediate resistance is near the $61,000 level.

The next major resistance is near the $61,700 high. It seems like the price might continue to rise and it could even clear the $62,000 level in the near term.

Dips Supported in BTC?

If bitcoin fails to clear the $61,000 resistance, it could correct lower. The first key support on the downside is near the $59,000 level.

The main support is near the trend line and $58,500. Any more losses might call for a test of the $58,000 support level. If there is a downside break below $58,000, the price could slide towards the $56,200 level in the coming sessions.

Technical indicators:

Hourly MACD – The MACD is now gaining momentum in the bullish zone.

Hourly RSI (Relative Strength Index) – The RSI for BTC/USD is back above the 50 level.

Major Support Levels – $59,000, followed by $58,200.

Major Resistance Levels – $61,000, $61,700 and $62,000.

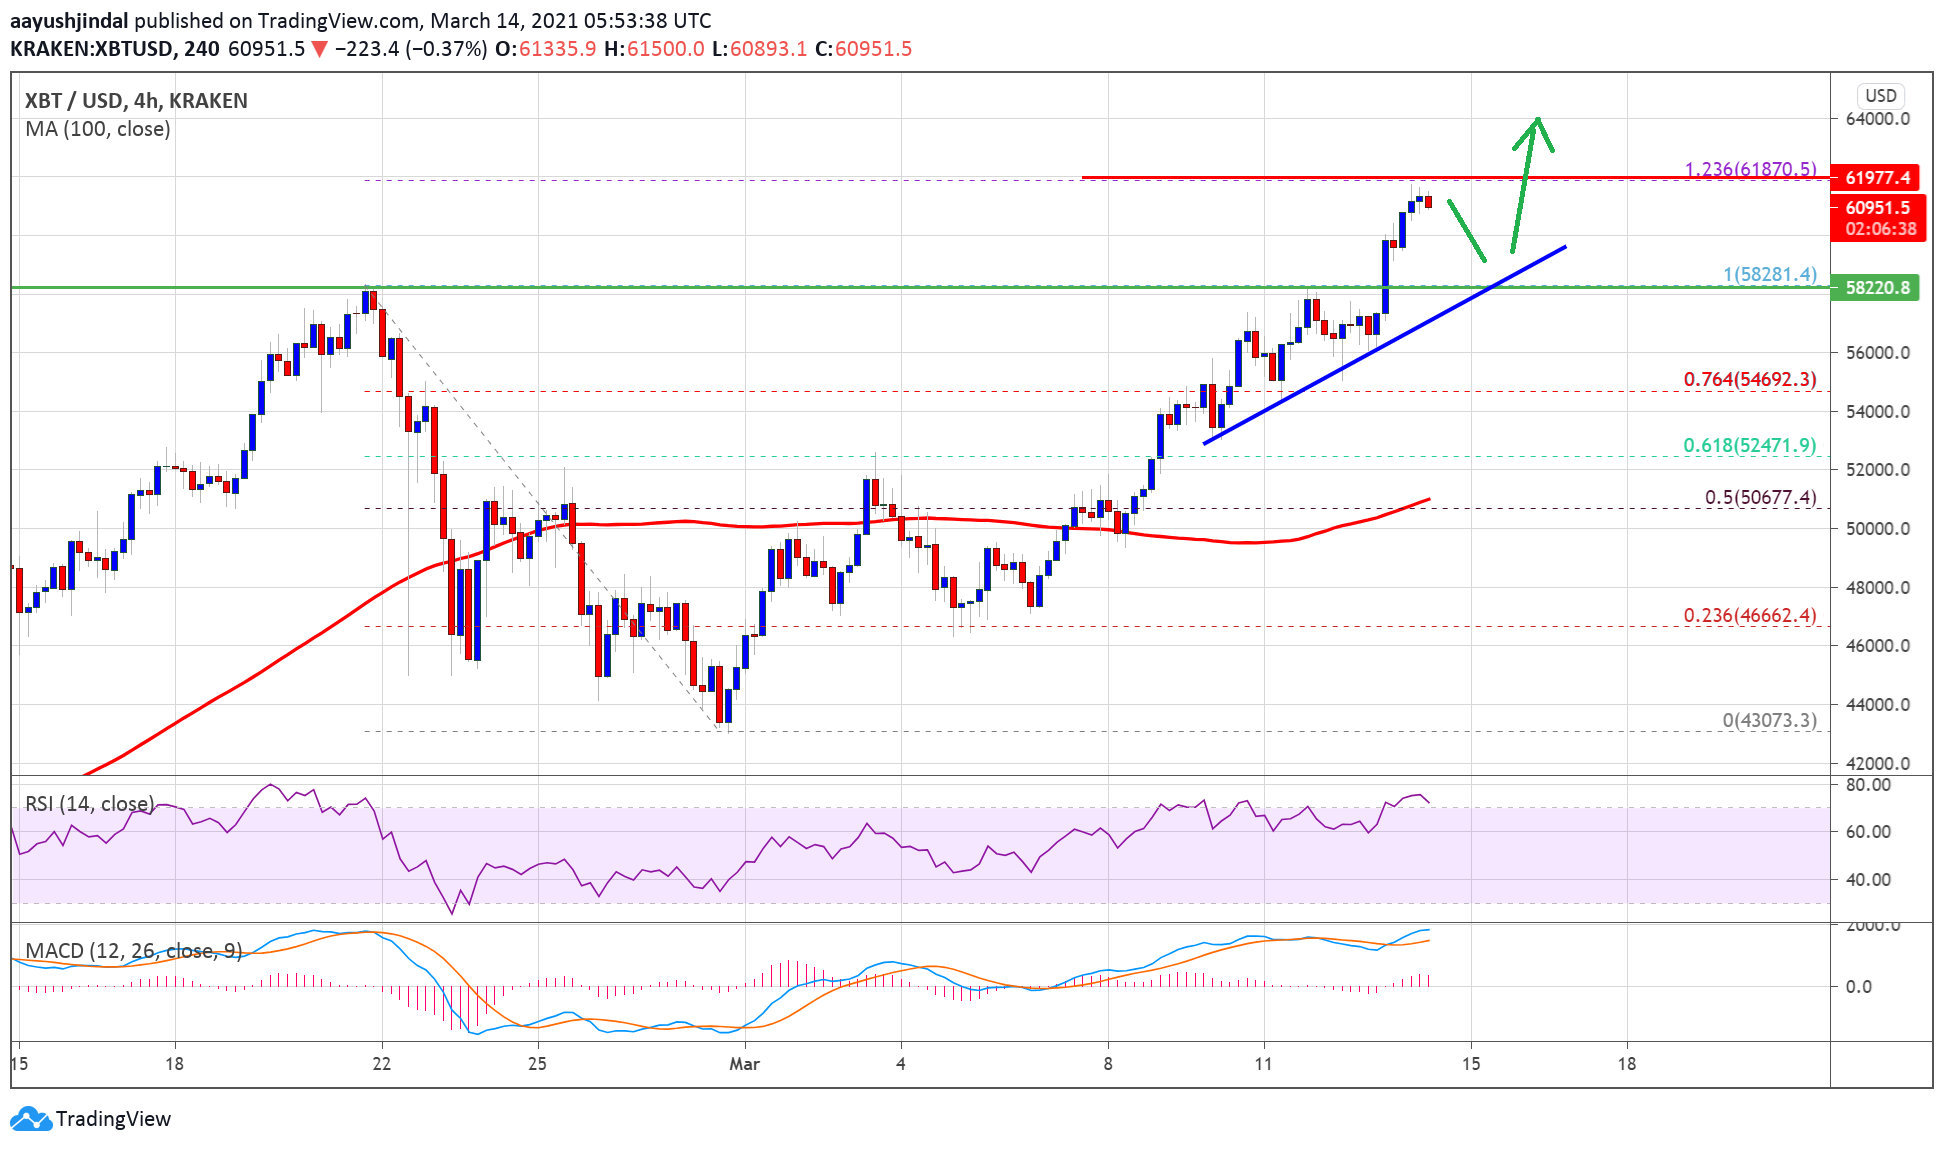
Why Bitcoin Price Could Accelerate To $65K, Dips Likely To Be Limited

Bitcoin price is gaining momentum and it broke the $60,000 resistance against the US Dollar. BTC is showing positive signs and it could continue to rise towards $65,000.

  • Bitcoin rallied above the $60,000 level and traded to a new all-time high near $61,800.
  • The price is now trading nicely above $60,000 and the 100 simple moving average (4-hours).
  • There is a key bullish trend line forming with support near $58,500 on the 4-hours chart of the BTC/USD pair (data feed from Kraken).
  • The pair could correct lower, but dips are likely to be limited below $58,000 in the near term.

Bitcoin Price is Surging

This past week, bitcoin price started a steady increase above the $55,000 resistance against the US Dollar. The BTC/USD pair even broke the $58,000 level and settled above the 100 simple moving average (4-hours).

The upward move gained pace above the 76.4% Fib retracement level of the key downward move from the $58,281 swing high to $40,073 low. There was a strong increase above the $58,500 and $60,000 resistance levels.

It even spiked above the $61,000 level and traded to a new all-time high near $61,800. It seems like bitcoin price faced a strong selling interest near the $61,800. The 1.236 Fib extension level of the key downward move from the $58,281 swing high to $40,073 low.

Bitcoin Price

Source: BTCUSD on TradingView.com

The price is currently correcting lower below the $61,000 level. On the downside, an initial support is near the $60,000 level. There is also a key bullish trend line forming with support near $58,500 on the 4-hours chart of the BTC/USD pair. Any more losses could open the doors for a move towards the $58,000 and $57,200 support levels.

Limited Downsides in BTC?

On the upside, the $61,500 and $61,800 resistance levels are initial hurdles for the bulls. A clear break above $61,800 could open the doors for a move towards the $62,500 level.

The next major resistance is near the $65,000 level. Any more gain could push the price towards the $68,000 and $68,500 resistance levels in the near term.

Technical indicators

4 hours MACD – The MACD for BTC/USD is gaining bullish momentum in the bullish zone.

4 hours RSI (Relative Strength Index) – The RSI for BTC/USD is now well above the 50 level.

Major Support Level – $60,000

Major Resistance Level – $58,500

Data Shows Bitcoin Peaks Last Roughly 40 Days: When To Sell Your Coins

Bitcoin price has been an uptrend for a year now, and given the strength of the move and the fact the asset is now at more than $50,000 per coin, begins to bring up the question: when to start selling your coins?

According to past crypto bull market data, the final push to the peak and remaining third of the bullish impulse, lasts for a period of only forty days before it is all over. But is it possible to know when this is happening or when it is about to end?

Velocity And Volatility At The Top Gets Fast And Furious

The cryptocurrency asset class is highly speculative in nature, but is beginning to become more fundamentally sound as adoption takes place and proof of concepts become working products.

However, thanks to Bitcoin’s block reward halving recurring every four years, thus far, crypto market cycles can be timed with some accuracy.

Related Reading | Bitcoin Could Close March With First Ever Quarterly Bear Signal

Following each halving, it is time to stop trading Bitcoin, and instead hold for the next phase of markup. Timing the top, however, isn’t so simple.

Each move when measured and divided into thirds, sees the fastest and most violent move in the final third. According to data, these periods and the final one-third stretch of the bull run, happen within a timeframe of only forty days and forty nights.

bitcoin btcusd

Both cycles the top cryptocurrency only spent forty days in the top third. | Source: BTCUSD on TradingView.com

Timing Bitcoin Peaks And Crypto Market Cycles: When To Sell Your Coins

Within those forty days, Bitcoin price completes its final parabolic push, and sees the first break of that advance that it cannot recover from.

Missing this final one third stretch, results in significant losses – as much as 50% off the asset’s peak almost immediately.

Data also says that assets that have gone parabolic, once broken, retrace 80% or more. Iconic commodities trader Peter Brandt accurately called for the cryptocurrency’s bottom range nearly a full year in advance using these reliable metrics.

During the last bull market, Bitcoin price dropped from $20,000 to only $3,000 – leaving many investors stuck holding for another cycle to cash out in profit.

Related Reading | Bitcoin “Cheat Sheet” Calls For Next Leg Up To $77K

The cycle before it, Bitcoin price also retraced 80% and it will do it again when this cycle has concluded. Regardless of this risk, investors still get in and try to get out at the right time.

Past cycle tops have almost always historically happened in November and December, which is has historically been a time when markets reach their cyclical peaks. It is not entirely clear why this is, but due to this being a widely known fact, any peaks could be front run during this bull run.

Other ways to potentially time the top, is to watch for the monthly RSI to reach highs from past bull cycles, and only then its playing a guessing game as to when the top is actually in.

Featured image from Deposit Photos, Charts from TradingView.com

Digital Silver: Why Litecoin Is Poised To Bounce Versus Bitcoin

Litecoin has had a brutal “bull market” if you can even call it that for the once popular cryptocurrency built on Bitcoin’s code. However, that all might soon turn around, as a massive bounce is brewing on the LTCBTC trading pair.

A reversal on the trading pair could help Litecoin catch up to the rest of the market, which has already set new all-time highs and then some. If and when LTC recovers against BTC, the upside could be swift and violent. Here’s why.

How Long It’s Been Lights Out For This Altcoin’s Bull Market

Comparing Litecoin’s chart next to the likes of Dogecoin, Ethereum, Bitcoin, Binance Coin, and several others, shows just how dark the depths of the crypto winter got for the altcoin.

Litecoin was an incredible performer at the height of the last bull market, rising to beyond $360 per LTC in a flash.

The altcoin also led the charge in the 2019 crypto market recovery, fueled by buzz surrounding the protocol’s block reward halving.

Related Reading | Why Litecoin Is The Next Crypto To “Teleport” Like Dogecoin

Litecoin’s code is very similar to Bitcoin’s, giving it several key similarities that should be benefiting the “digital silver” counterpart currently, such as hard-coded scarcity.

Only 84 million LTC exist, a mere four times the amount of the BTC supply. And if scarcity is driving the demand behind Bitcoin, the fact that Litecoin isn’t at all following is confusing.

But a bounce is due, according to one crypto analyst‘s interpretation of the LTCBTC price chart.

litecoin ltcbtc

A hidden dull div on the OBV could trigger a breakout of the falling wedge | Source: LTCBTC on TradingView.com

Smart Money Signals That Litecoin Is Ready To Bounce Against Bitcoin

The trader who shared the above chart says that LTCBTC is currently at long-term support of a falling wedge, coinciding with a bullish divergence on the on-balance volume indicator (OBV).

The OBV is often regarded as the “smart money indicator” – named as such for its ability to pick up signals of movements before they begin to take effect in price action.

These signals represent “smart money” taking positions early before markup. Fractals from the last bull market suggest that a breakout is near, but holders of the coin are taking their time.

Related Reading | This LTC Fractal Says Time Is Running Out To Accumulate At Low Prices

Losing support would take LTCBTC to the lowest levels yet, but a full reversal here could take the altcoin back to highs on its ratio against Bitcoin.

Litecoin is one of the oldest cryptocurrencies and one of the few to hang onto the top ten assets by market cap for several years at a time, even despite an inability to reclaim its former price record.

Will Litecoin finally bounce against Bitcoin and make a full recovery?

Featured image from Deposit Photos, Charts from TradingView.com

Bitcoin Slides 5% From Recent Highs Amidst Binance CFTC Probe Revelation

Bitcoin price just pulled back 5% from the now rejected retest of the asset’s current-standing all-time high. The leading cryptocurrency by market cap was struggling with resistance as it was, but news breaking that Binance is the focus of a CFTC probe caused the pullback to worsen sharply.

Here’s a brief breakdown of what’s going on in this developing situation, and what this could mean for the cryptocurrency’s ongoing uptrend.

Breaking: Commodity Futures Trading Commission Opens Investigation Into Binance

According to a breaking report circulating from Bloomberg News, leading cryptocurrency exchange Binance is the subject of an ongoing CFTC probe. The Commodity Futures Trading Commission is investigating if Binance served US customers, allowing them to trade cryptocurrency derivatives trading products that are in violation of US regulations.

Related Reading | Bitcoin “Cheat Sheet” Calls For Next Leg Up To $77K

The CFTC is among the chief regulatory enforcers in the United States, alongside the Securities and Exchange Commission, and have launched investigations into BitMEX and Tether in the past.

Binance commands a lion’s share of the total cryptocurrency market trading volume, and its footprint extends into CoinMarketCap, and just about everywhere else the industry touches. The significance of the breaking news caused Bitcoin to add to its now 5% pullback from recent highs.

bitcoin btc binance cftc probe

Bitcoin price has retraced by 5% so far, but could more downside be coming? | Source: BTCUSD on TradingView.com

Could Negative News Turn Sentiment And Derail The Bitcoin Bull Run?

Bitcoin price is undeniably overheated by most standards. Technicals have issued bearish divergences for months on end, overbought conditions are prominent on most timeframes, yet pullbacks have lasted only briefly as dip buyers scoop up BTC at whatever price they can get.

But with technicals this overheated, what could start as a small 5% correction on negative news could have a butterfly effect that causes a reset in price action and sentiment.

Related Reading | Bitcoin Could Close March With First Ever Quarterly Bear Signal

Bitcoin has gone nearly a full year in an uptrend with very little time spent correcting. On the anniversary of the catastrophic Black Thursday selloff, a certain panic could still be in the air that causes a domino effect and sends Bitcoin toppling further.

For now, support at $55,000 is holding, but losing it could cause another drop to $50,000 where support will need to hold, or risk a larger scale reversal.

Featured image from Deposit Photos, Charts from TradingView.com