The announcement follows a government rule change to require social media influencers to display their real names.
China to Verify Citizens’ Identities With New Blockchain-Based Platform
The announcement follows a government rule change to require social media influencers to display their real names.
XRP Price Could Regain Strength If It Clears This Key Barrier
XRP price is eyeing a fresh increase from the $0.600 support. The price could gain bullish momentum if it clears the $0.625 resistance zone.
- XRP is slowly moving higher above the $0.612 level.
- The price is now trading below $0.625 and the 100 simple moving average (4 hours).
- There was a break below a key bullish trend line with support near $0.628 on the 4-hour chart of the XRP/USD pair (data source from Kraken).
- The pair start a fresh rally if it clears the $0.625 and $0.628 resistance levels.
XRP Price Aims Fresh Increase
After a major increase, XRP faced sellers near the $0.700 zone. The bulls lost control and the price started a major decline below the $0.650 support, like Bitcoin and Ethereum.
There was a break below a key bullish trend line with support near $0.628 on the 4-hour chart of the XRP/USD pair. The pair even declined below the $0.612 support. A low was formed near $0.6010, and the price is now attempting a fresh increase.
There was a move above the $0.612 resistance. However, XRP is now trading below $0.625 and the 100 simple moving average (4 hours). On the upside, immediate resistance is near the $0.625 zone. It is close to the 23.6% Fib retracement level of the downward move from the $0.7000 swing high to the $0.6010 swing low.
The first major resistance is near the $0.628 zone. A close above the $0.628 resistance zone could spark a steady increase. The next key resistance is near $0.650 or the 50% Fib retracement level of the main decline from the $0.720 swing high to the $0.5720 swing low.
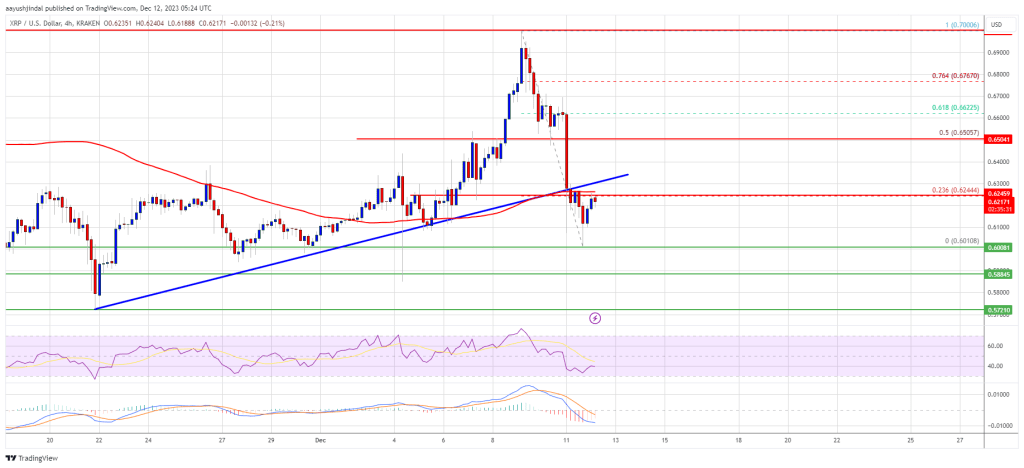
Source: XRPUSD on TradingView.com
If the bulls remain in action above the $0.650 resistance level, there could be a rally toward the $0.700 resistance. Any more gains might send the price toward the $0.720 resistance.
Another Decline?
If XRP fails to clear the $0.625 resistance zone, it could start a fresh decline. Initial support on the downside is near the $0.612 zone.
The next major support is at $0.600. If there is a downside break and a close below the $0.600 level, XRP price might accelerate lower. In the stated case, the price could retest the $0.572 support zone.
Technical Indicators
4-Hours MACD – The MACD for XRP/USD is now losing pace in the bearish zone.
4-Hours RSI (Relative Strength Index) – The RSI for XRP/USD is now below the 50 level.
Major Support Levels – $0.612, $0.600, and $0.572.
Major Resistance Levels – $0.625, $0.628, and $0.650.
Ethereum Price Consolidates Below Hurdle, What Could Trigger Fresh Increase
Ethereum price started a consolidation phase after a sharp decline. ETH must clear the $2,275 resistance to start a fresh increase in the near term.
- Ethereum recovered losses after testing the $2,000 support zone.
- The price is trading below $2,320 and the 100-hourly Simple Moving Average.
- There is a key bearish trend line forming with resistance near $2,240 on the hourly chart of ETH/USD (data feed via Kraken).
- The pair could gain bullish momentum if it clears the $2,250 and $2,275 resistance levels.
Ethereum Price Eyes Fresh Increase
Ethereum price started a sharp decline below the $2,300 pivot level, like Bitcoin. ETH declined heavily below the $2,220 and $2,200 levels. Finally, it tested the $2,000 support before the bulls emerged.
A low was formed near $1,980 and the price is now attempting a recovery wave. There was a move above the $2,120 and $2,150 resistance levels. The bulls pushed the price above the 50% Fib retracement level of the downward wave from the $2,400 swing high to the $1,980 low.
Ethereum is now trading below $2,320 and the 100-hourly Simple Moving Average. On the upside, the price is facing resistance near the $2,250 zone. There is also a key bearish trend line forming with resistance near $2,240 on the hourly chart of ETH/USD.
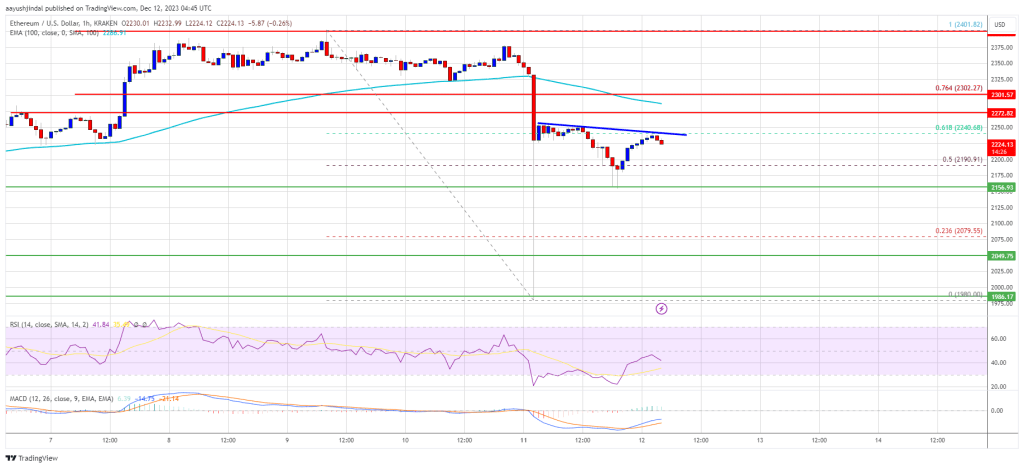
Source: ETHUSD on TradingView.com
The next key resistance is near the $2,275 level or the 76.4% Fib retracement level of the downward wave from the $2,400 swing high to the $1,980 low. A clear move above the $2,300 zone could send the price toward the $2,400 level. The next resistance sits at $2,450. Any more gains could start a wave toward the $2,500 level.
More Losses in ETH?
If Ethereum fails to clear the $2,275 resistance, it could start another decline. Initial support on the downside is near the $2,155 level.
The next key support is $2,120. The main support is now near $2,100. A downside break below $2,100 might start another major decline. In the stated case, Ether could revisit the $2,000 support. Any more losses might call for a test of the $1,880 support zone in the near term.
Technical Indicators
Hourly MACD – The MACD for ETH/USD is losing momentum in the bearish zone.
Hourly RSI – The RSI for ETH/USD is now below the 30 level.
Major Support Level – $2,155
Major Resistance Level – $2,275
IRS tax bill will swipe creditors of any ‘meaningful recovery,' says FTX

FTX Trading said the firm “never earned anything anywhere near the amount” that would justify a $24 billion tax bill.
Avalanche was ‘undervalued’ before posting 79% weekly gain: Analysts

AVAX surged while other tokens plunged, with analysts pegging its outperformance on being relatively undervalued while forging new partnerships with JPMorgan and Citi.
Bitcoin Price Holds Key Support, Can Bulls Overcome This Key Hurdle?
Bitcoin price dived again and retested the $40,000 support zone. BTC is rising, but it must clear $42,350 to move into a positive zone.
- Bitcoin is attempting a fresh increase from the $40,000 support zone.
- The price is trading below $43,600 and the 100 hourly Simple moving average.
- There was a break above a connecting bearish trend line with resistance near $41,300 on the hourly chart of the BTC/USD pair (data feed from Kraken).
- The pair could gain bullish momentum once it clears the $42,350 resistance zone.
Bitcoin Price Remains Supported
Bitcoin price dropped heavily below the $43,500 and $43,200 support levels. BTC even dived below the $41,200 support before the bulls emerged. A low was formed near $39,999 and the price is now attempting a fresh increase.
The price climbed above the 23.6% Fib retracement level of the downward move from the $44,699 swing high to the $39,999 low. Besides, there was a break above a connecting bearish trend line with resistance near $41,300 on the hourly chart of the BTC/USD pair.
However, Bitcoin is still trading below $43,600 and the 100 hourly Simple moving average. On the upside, immediate resistance is near the $42,000 level. The first major resistance is forming near $42,350. It is near the 50% Fib retracement level of the downward move from the $44,699 swing high to the $39,999 low.
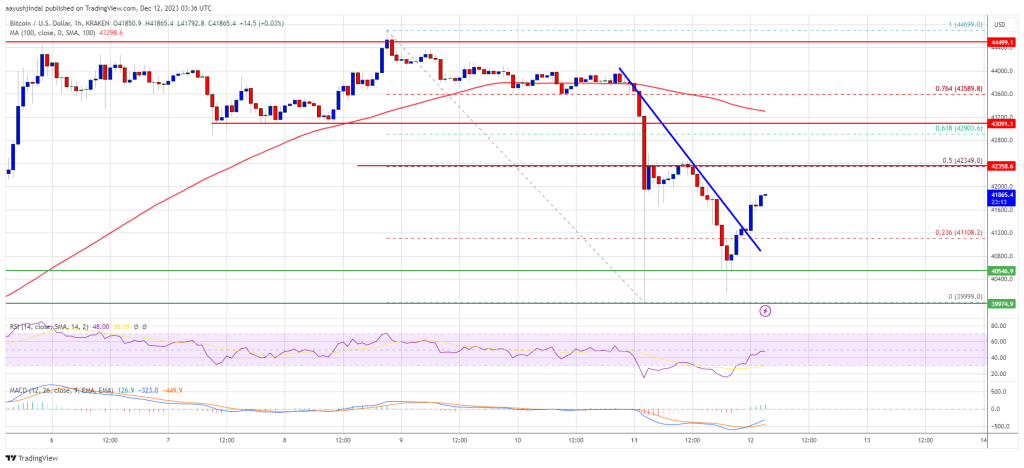
Source: BTCUSD on TradingView.com
A close above the $42,350 resistance might start a steady increase. The next key resistance could be near $43,000, above which BTC could rise toward the $44,000 level. A clear move above the $44,000 level could set the pace for a test of $45,000.
Dips Present Buying Opportunity In BTC?
If Bitcoin fails to rise above the $42,350 resistance zone, it could start another decline. Immediate support on the downside is near the $41,200 level.
The next major support is near $40,550, below which the price might test the $40,000 zone. If there is a move below $40,000, there is a risk of a sharp decline. In the stated case, the price could drop toward the $38,500 support in the near term.
Technical indicators:
Hourly MACD – The MACD is now gaining pace in the bearish zone.
Hourly RSI (Relative Strength Index) – The RSI for BTC/USD is now below the 30 level.
Major Support Levels – $41,200, followed by $40,000.
Major Resistance Levels – $42,400, $43,200, and $44,200.
Don’t panic: Only 11 of 330 Elizabeth Warren’s bills have ever passed

Support for the Digital Asset Anti-Money Laundering Act is growing in Congress, but most bills sponsored by legislators never become law.
World’s First Bitcoin Bonds Receive Regulatory Approval in El Salvador
The bonds are expected to launch in Q1 of 2024, several posts amplified on social platform X by President Nayib Bukele suggest.
Bitcoin “Washout” Completed, BTC Ready For $48,000—And Higher
Earlier today, Bitcoin (BTC) flash crashed to as low as $40,400 before rebounding to spot levels. This sudden drop triggered what Mike Alfred, a crypto value investor, said was a “textbook washout” necessary to liquidate speculators.
The drop and bounce, Alfred further explained, has “wiped out open interest and is exactly what you want to see” before prices recover, possibly edging to $48,000 in the coming sessions.
Bitcoin Drops, Over $120 Million Liquidated
The washout, if past even guides, might have dented sentiment, forcing inexperienced holders and traders to take profit, allowing HOLDers more control. If that’s the case, considering that the uptrend remains when Bitcoin’s price action is analyzed from a top-down preview, it could be the foundation for further gains in the days ahead.
Besides the heightened volatility and likelihood of potential profit-taking volatility, the resulting correction also led to some liquidation. According to Coinglass data on December 11, the flash crash saw over $105 million of leveraged long positions liquidated.
Conversely, more than $15 million in short positions forcefully closed as prices quickly recovered, going against some traders’ positions.
While responding to Alfred’s preview, some observers noted that liquidating high-leveraged long positions has effectively removed bearish elements from the market. In turn, this has positively paved the way for more price gains in the days ahead.
Will BTC Float To New All-Time Highs?
Looking at the Bitcoin daily price chart, the uptrend remains even with the coin consolidating in lower time frames. Whether today’s sell-off will be confirmed in the next 24 hours remains to be seen.
However, from the candlestick arrangement in the daily chart, the long lower wick suggests that lower lows are being rejected. Notably, the coin has support at the 20-day moving average, highlighting the importance of this dynamic line.
The price chart shows that the $45,000 level is critical resistance. If there is a solid, high volume growth above this level, BTC might not only expand above $48,000 and $50,000, but it could anchor the leg up towards $69,000 in the next coming weeks.
Market participants view the potential approval of the first Bitcoin ETF in early January 2024 by the Securities and Exchange Commission (SEC) as a bullish catalyst for BTC bulls.
Amid evolving crypto regulations in the US, Europe, and beyond, a regulated ETF would provide institutional investors with a more accessible way to gain exposure to Bitcoin, potentially driving demand and pushing prices higher.
El Salvador's Volcano Bond gets regulatory approval, targets Q1 launch

The Volcano Bond was approved by the country’s Digital Assets Commission on Dec. 11, with issuance expected in Q1, 2024.
Bitcoin, Ether Drop Spurs $500M in Liquidations, But BTC Entering “Never Seen Before” Era
“Due to the rise of Ordinals and Bitcoin L2s, there are reasons to be bullish on the Bitcoin ecosystem. We are entering an era of Bitcoin that we have never seen before,” one market watcher told CoinDesk.
Crypto Market Crashes: Traders React With “Buy The Dip” Calls
The crypto market has seen a plunge today, and it would appear that social media users have reacted by calling to buy this “dip.”
Coins Across The Crypto Sector Are In The Red Today
According to data from the on-chain analytics firm Santiment, social media mentions of “buy the dip” have gone up following the latest tumble that the crypto market has experienced.
The relevant indicator here is the “social volume,” which keeps track of the number of unique posts/threads/messages on the various social media platforms that mention a specific topic.
The metric counts the posts themselves instead of the mentions because this method provides a more accurate representation of the behavior among social media users as a whole.
Consider two scenarios: one where a large number of mentions are happening over a few posts and another where mentions are also taking place but are spread out over a large number of posts.
In the first, discussion is limited to a specific group of users, but going by the mentions, this case would have as much interest in the topic as the latter when it’s not the case.
Now, to find whether “buy the dip” is gaining traction among crypto investors, what Santiment has done is filter out the social volume of crypto first and then search these posts for the mention of terms related to this idea.
Here is a chart that shows the trend in the social volume for this topic over the last month:
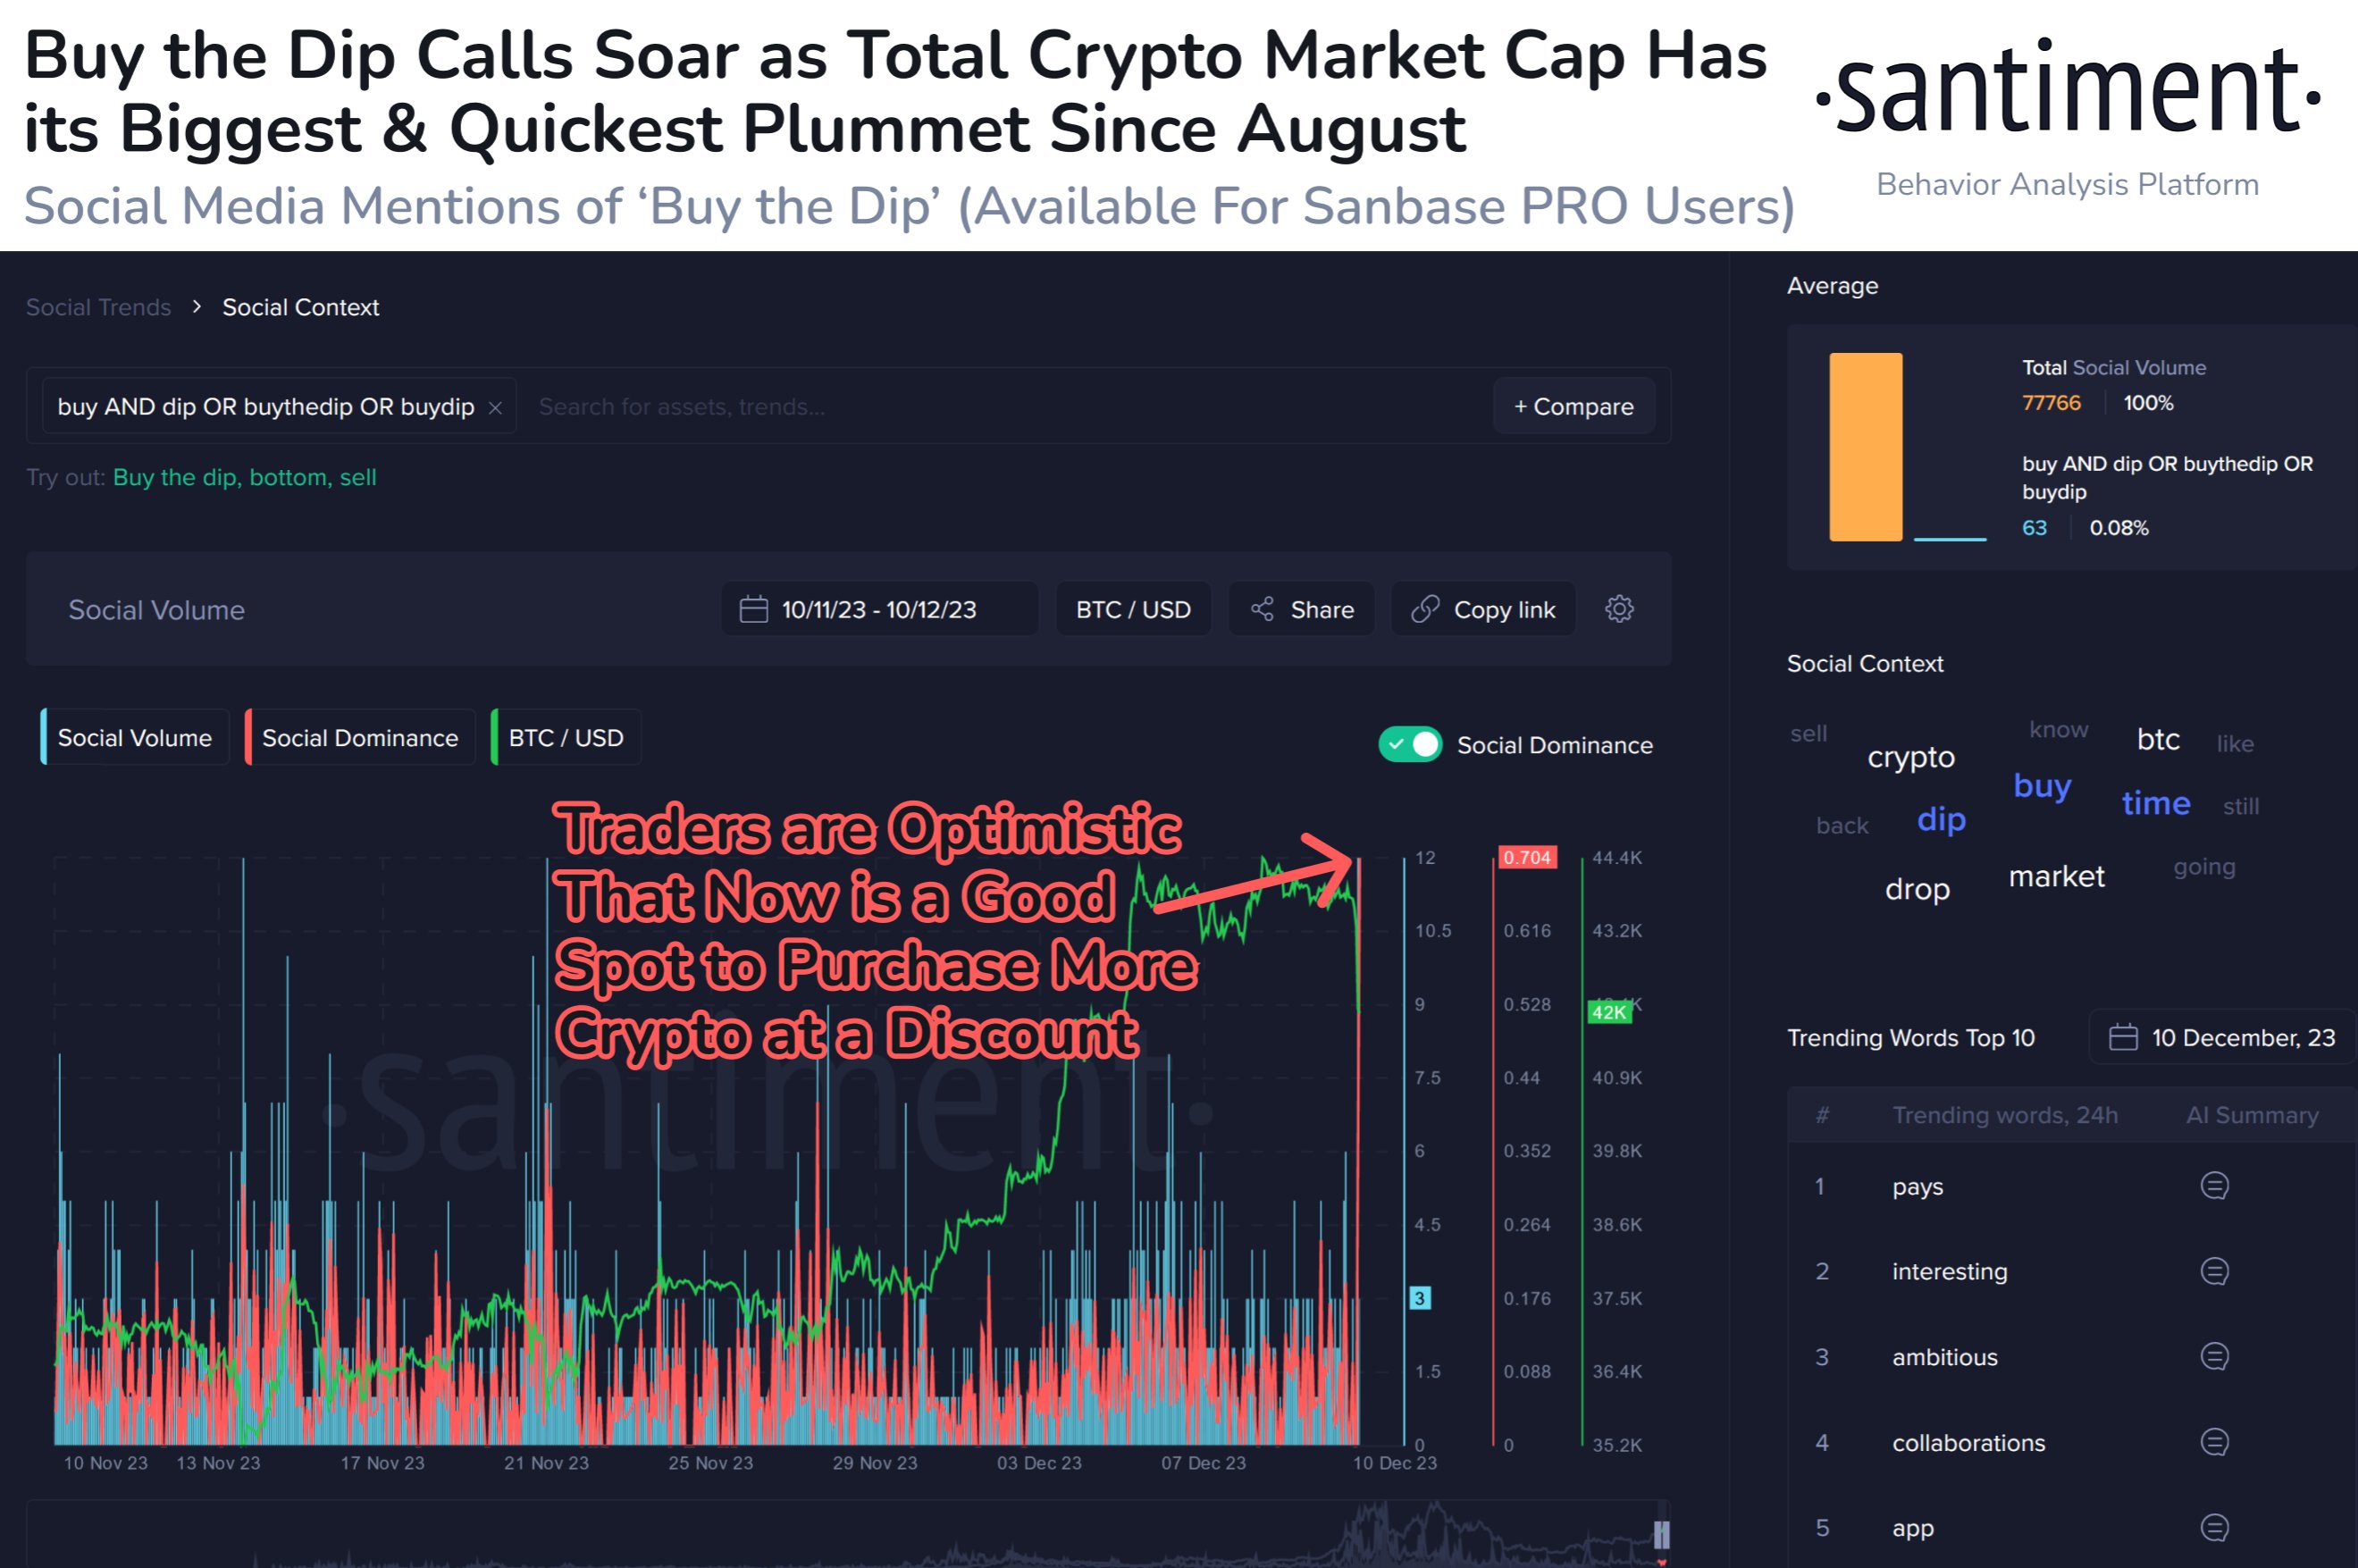
The graph shows that the crypto social volume for terms related to “buy the dip” has shot up after this plummet in the market. In the same chart, the analytics firm has also attached the “social dominance” data, which keeps track of what percentage of these discussions are adding up.
Social dominance has also registered a spike recently, and at the peak of this spike, it seems the metric assumed a value of about 0.7, which means 0.7% of all discussions related to the crypto sector involved this topic.
“Crypto has experienced its fastest drop in 4 months as markets have corrected and caused mild trader concerns,” notes Santiment. “There is a high level of buythedip calls, which typically means that there is a bit of overeagerness and FOMO on these low prices.”
While the market is optimistic about this plunge, too much optimism about things like “bottoms” has historically actually backfired for the assets’ prices. Thus, these mentions aren’t a sign that Bitcoin and others have finished with their decline, and more could potentially be on the way.
BTC Price
Bitcoin had gone under the $41,000 mark during its initial plunge, but it wasn’t long before it made some recovery towards the current price.
Crypto Market Crashes: Traders React With “Buy The Dip” Calls
The crypto market has seen a plunge today, and it would appear that social media users have reacted by calling to buy this “dip.”
Coins Across The Crypto Sector Are In The Red Today
According to data from the on-chain analytics firm Santiment, social media mentions of “buy the dip” have gone up following the latest tumble that the crypto market has experienced.
The relevant indicator here is the “social volume,” which keeps track of the number of unique posts/threads/messages on the various social media platforms that mention a specific topic.
The metric counts the posts themselves instead of the mentions because this method provides a more accurate representation of the behavior among social media users as a whole.
Consider two scenarios: one where a large number of mentions are happening over a few posts and another where mentions are also taking place but are spread out over a large number of posts.
In the first, discussion is limited to a specific group of users, but going by the mentions, this case would have as much interest in the topic as the latter when it’s not the case.
Now, to find whether “buy the dip” is gaining traction among crypto investors, what Santiment has done is filter out the social volume of crypto first and then search these posts for the mention of terms related to this idea.
Here is a chart that shows the trend in the social volume for this topic over the last month:
The graph shows that the crypto social volume for terms related to “buy the dip” has shot up after this plummet in the market. In the same chart, the analytics firm has also attached the “social dominance” data, which keeps track of what percentage of these discussions are adding up.
Social dominance has also registered a spike recently, and at the peak of this spike, it seems the metric assumed a value of about 0.7, which means 0.7% of all discussions related to the crypto sector involved this topic.
“Crypto has experienced its fastest drop in 4 months as markets have corrected and caused mild trader concerns,” notes Santiment. “There is a high level of buythedip calls, which typically means that there is a bit of overeagerness and FOMO on these low prices.”
While the market is optimistic about this plunge, too much optimism about things like “bottoms” has historically actually backfired for the assets’ prices. Thus, these mentions aren’t a sign that Bitcoin and others have finished with their decline, and more could potentially be on the way.
BTC Price
Bitcoin had gone under the $41,000 mark during its initial plunge, but it wasn’t long before it made some recovery towards the current price.
Market Jolt: Bitcoin Falls Below $42,000 As Short Term Holders Rush To Cash In
Bitcoin is currently witnessing a decline in price, with its value dropping below the $42,000 mark. This movement comes on the heels of a significant uptick in the circulating supply of profitable Bitcoin, prompting a wave of profit-taking among investors.
ETC Group’s Head of Research, André Dragosch, highlights this trend, noting an increase in Bitcoin being moved to exchanges for potential sale. Dragosch noted, citing data from Glassnode:
Overall exchange balances for bitcoin have clearly picked up, implying a net inflow of coins to exchanges over the past week. More specifically, around +14k BTC have flown into exchanges on a net basis according to data provided by Glassnode. This will likely exert some downside pressure on prices in the short term.
Bitcoin Short-Term Holders Drive Selling Pressure
According to the ETC Group, the current market scenario presents a landscape where a substantial portion of Bitcoin and Ethereum addresses are profitable. Data from the firm indicates that 88.3% of BTC addresses and 77.6% of ETH addresses are currently profitable, figures hovering near the highest for the year.
This environment of a high percentage of BTC and ETH addresses being in a state of profit has seemingly encouraged a segment of investors, particularly those with a short-term investment perspective, to capitalize on their gains, as indicated by the ETC Group’s analysis.
The ETC group further revealed that these short-term investors, defined as those who have held Bitcoin for less than 155 days, have been transferring their profitable assets to exchanges at a rate not seen since July of this year.
This surge in selling pressure is attributed to a key factor restraining the Bitcoin rally as the market adjusts to the increased availability of the cryptocurrency.
Further illustrating the market’s reaction, the past week marked the first instance of “net outflows” from crypto asset exchange-traded products (ETPs) since early October.
The total amount of these outflows was approximately $18.2 million, with Bitcoin ETPs experiencing the majority of these withdrawals, totaling $13.1 million. In contrast, Ethereum ETPs saw a “net inflow” of $5.8 million, suggesting a diverging investor interest between the two leading crypto.
Market Impact And Trader Liquidations
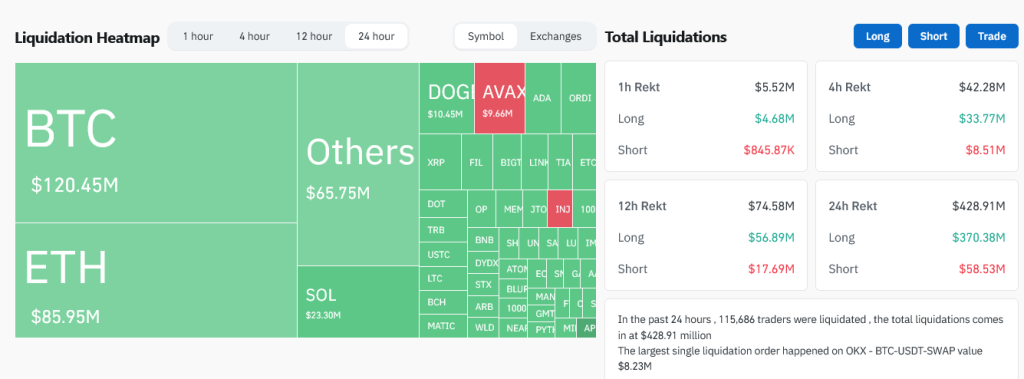
The recent decline in Bitcoin’s price from its previous high of around $44,000 has impacted investor sentiment and resulted in significant trader liquidations. According to data from Coinglass, over the last 24 hours, there have been 115,873 trader liquidations, culminating in roughly $424.67 million in total liquidations.
Bitcoin has led these liquidations, with $105.51 million in long liquidations and $14.95 million in short liquidations. Ethereum follows closely, accounting for $78.53 million in long and $7.41 million in short liquidations.
It is worth noting that these liquidations and the fluctuating market dynamics underscore the division of trader’s fate in the crypto market. While some investors seize the opportunity to realize profits, others face the challenges of rapid market shifts.
Featured image from Unsplash, Chart from TradingView
Crypto Sentiment Index Stays Bullish Despite Corrections, Report Reveals Positive Outlook
In a recent blog post, ETC Group’s Head of Research, Andre Dragosh, provided a comprehensive analysis of the current state of the crypto market. Dragosh’s findings shed light on the market’s performance dynamics, profit-taking activity, and derivative trends.
High-Risk Appetite In Crypto Market
According to Dragosh’s analysis, crypto assets showcased their resilience as they outperformed traditional assets like equities, supported by a significant repricing in monetary policy expectations and short futures liquidations at the beginning of last week.
However, this outperformance encountered some limitations in the short term due to stronger-than-expected US jobs data, which began to dampen the recent rally. The US non-farm payroll growth and unemployment rate surpassed consensus estimates, leading to a reversal in US Treasury yields and a decrease in overall risk appetite across traditional financial markets.
Notably, altcoin outperformance gained momentum during the period, with Avalanche (AVAX) and Cardano (ADA) returning over 50% each. Among the top 10 crypto assets, Avalanche, Cardano, and Polkadot (DOT) stood out as the relative outperformers.
According to Dragosh, this surge in altcoin outperformance compared to Bitcoin (BTC) indicates a “high-risk appetite” within the crypto market. On the other hand, on-chain data for Bitcoin suggests that investors are increasingly taking profits, evidenced by the rising number of coins in profit being sent to exchanges.
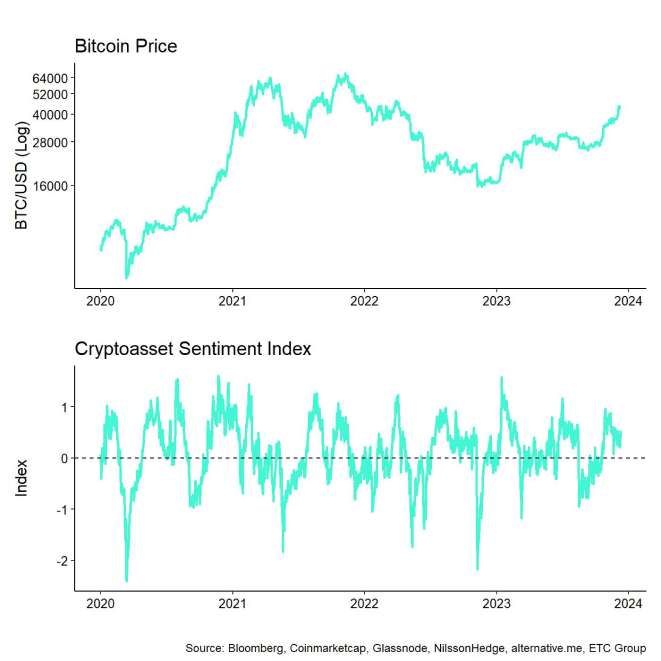
ETC Group’s in-house Crypto Asset Sentiment Index remained relatively elevated compared to the previous week, indicating positive market sentiment. However, major reversals to the downside were observed in the Crypto Dispersion Index and the BTC 25-delta 1-month option skew.
The Crypto Fear & Greed Index continued to reside in “Greed” territory, reflecting ongoing market optimism. Although ETC Group’s Cross Asset Risk Appetite (CARA) measure declined slightly, it remained in positive territory, signaling a decrease in risk appetite in traditional financial markets.
Performance dispersion among digital assets decreased compared to the previous week but remained relatively high. This implies that correlations among crypto assets have decreased, and investments are driven by coin-specific factors, highlighting the importance of diversification among digital assets.
Short-Term Holders Cash In
The market remains in a strong profit environment, with a significant percentage of BTC and ETH addresses in profit. According to Dragosh, profit-taking activity, particularly among short-term holders, has increased as Bitcoin approaches recent highs, leading to higher selling pressure.
Long-term holders have also increased their transfers of profitable coins to exchanges, potentially hindering short-term price increases. However, it is worth noting that there is no evidence of older coins being spent, which would indicate a larger price correction.
On the other hand, aggregate open interest in BTC futures and perpetual remained stable, with notable futures short liquidations recorded. BTC option open interest saw a significant increase, accompanied by relative put-buying and an increase in the put-call open interest ratio.
The 25-delta BTC option skews also increased, indicating higher demand for puts compared to calls. However, overall at-the-money (ATM) implied volatilities did not change significantly.
At the time of writing, BTC has lost its $42,000 support line, trading at $41,600, down 5% in the last 24 hours.
Featured image from Shutterstock, chart from TradingView.com
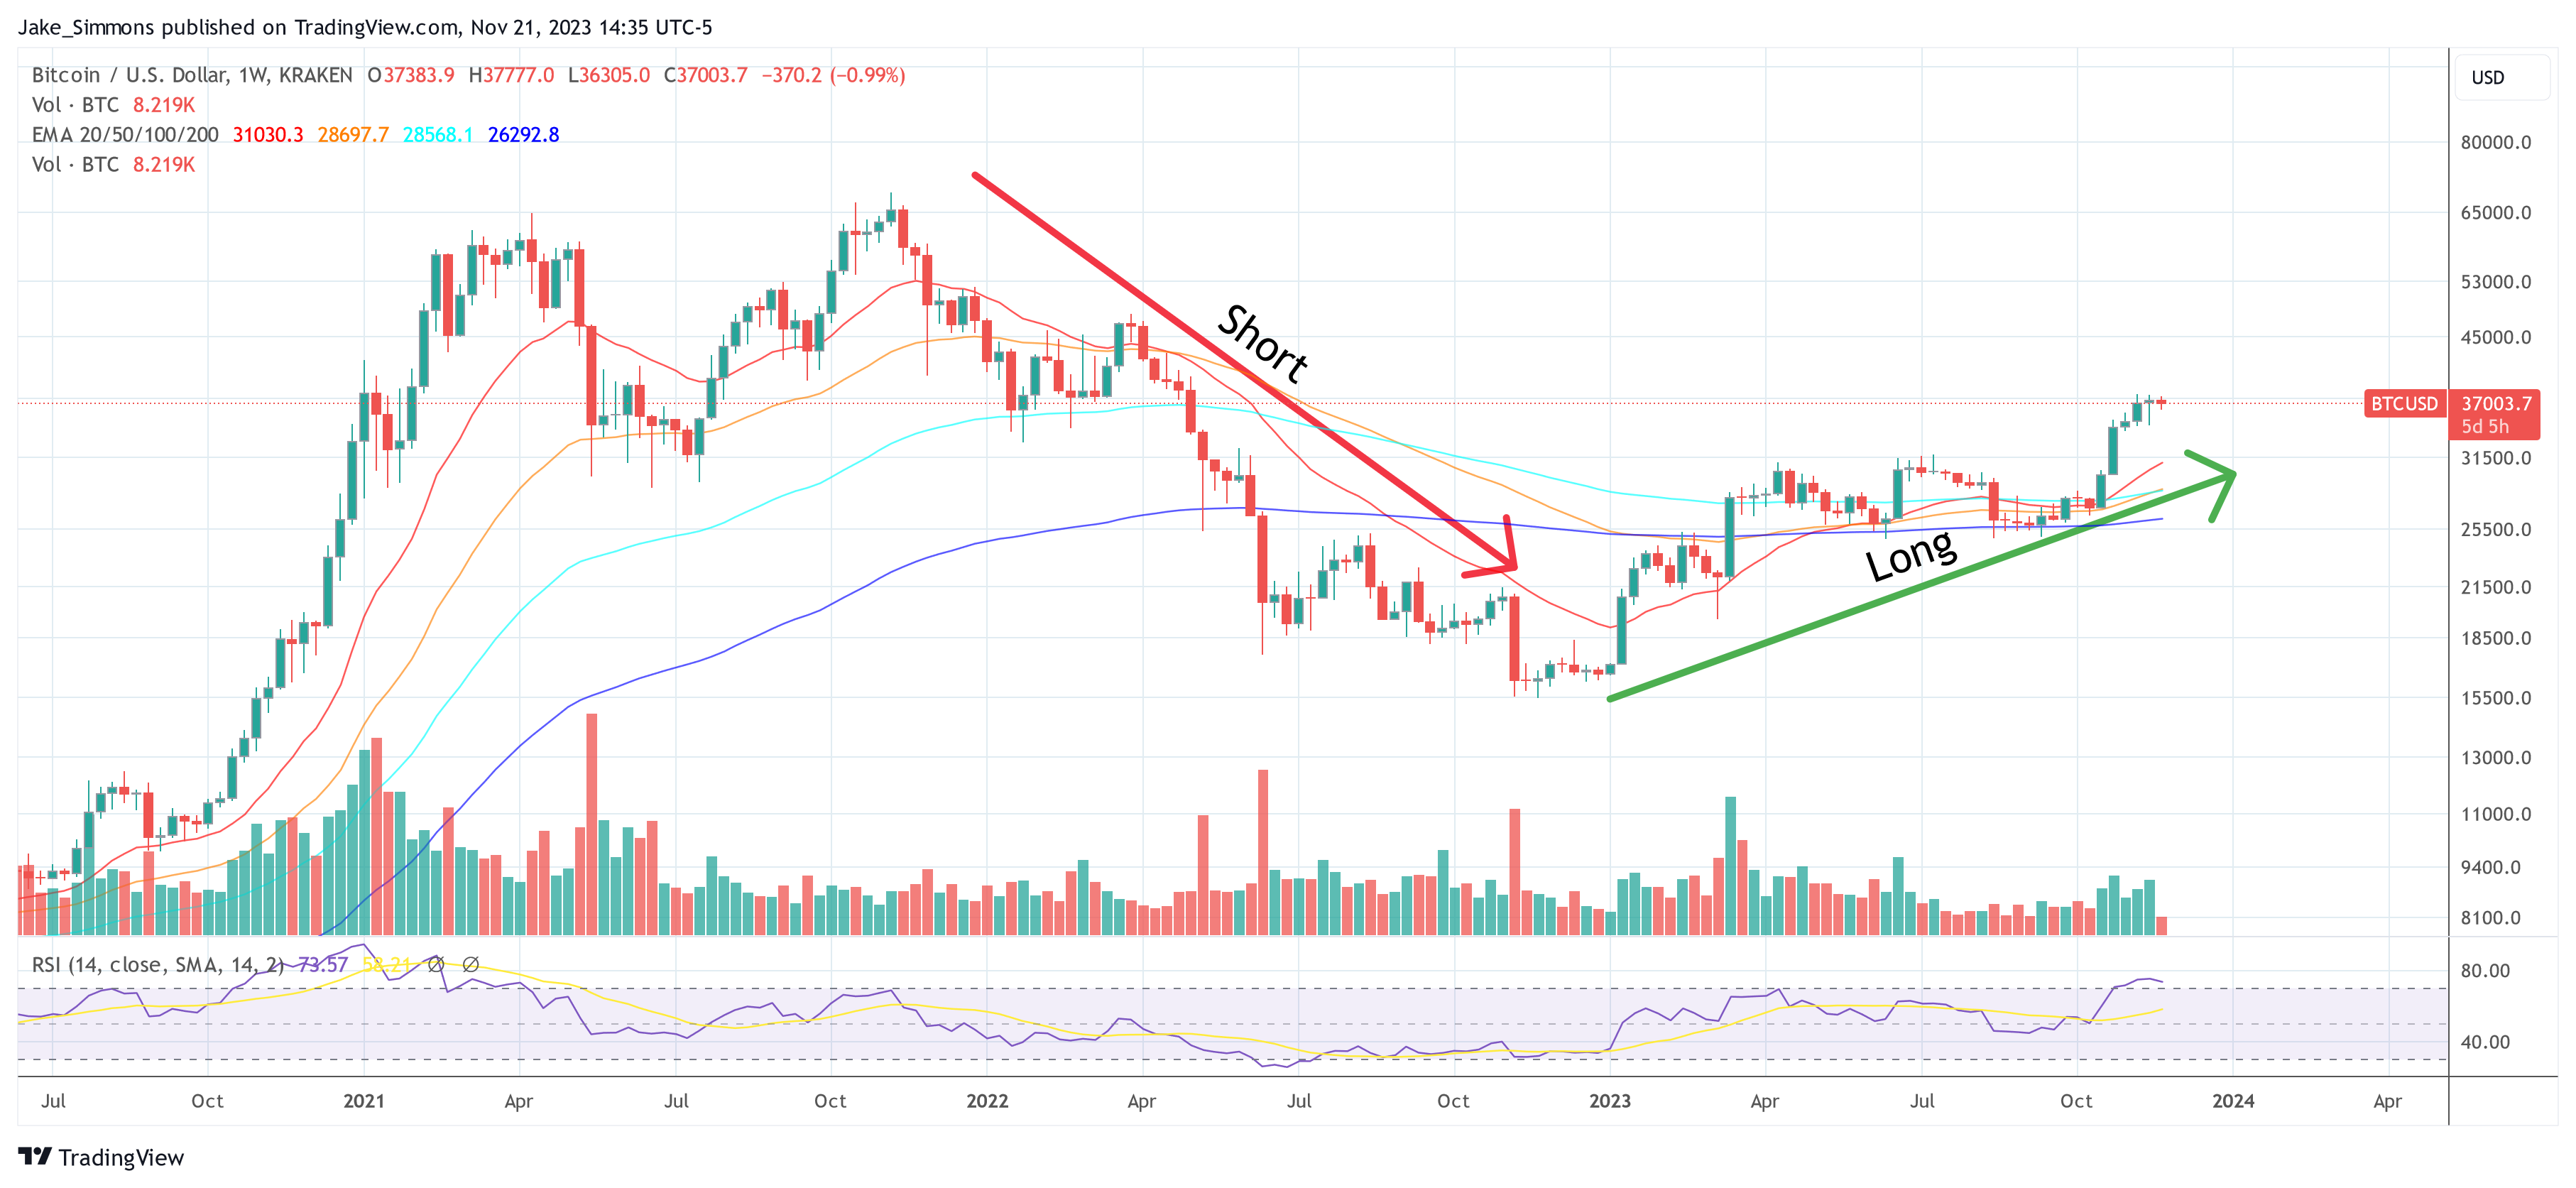
How To Take A Long And Short Position In Crypto
In crypto trading, mastering a long and short position is crucial for success. This guide dives into the essentials like “what is a short position” and “what is covering shorts” as well as strategies for both long & short crypto trading, tailored for traders at all levels. Uncover the strategies behind long positions, aimed at growth and value appreciation, and delve into the subtleties of “going short.”
The Basics Of Long/Short Position Crypto Trading
Before diving into the specific strategies of long and short crypto trading, it’s essential to grasp the fundamental concepts that govern the cryptocurrency market. Crypto trading, at its core, involves the buying and selling of cryptocurrencies like Bitcoin, Ethereum, and others, with the aim of generating profit from market fluctuations. Unlike traditional stock markets, the crypto market operates 24/7, offering continuous opportunities but also presenting unique challenges due to its volatility.
The Market’s Volatility
The cryptocurrency market is known for its high volatility. Prices can dramatically increase or decrease over short periods, making it a potentially lucrative but risky market. This volatility stems from various factors, including market sentiment, regulatory news, technological advancements, and global economic events.
Supply And Demand Dynamics
Just like any market, crypto trading is driven by supply and demand. The limited supply of certain cryptocurrencies, coupled with increasing demand, can lead to price surges. Conversely, oversupply or waning interest can cause prices to plummet. Understanding these dynamics is crucial for any trader aiming to capitalize on market movements.
Trading Platforms And Wallets
Crypto traders can use a variety of online platforms to execute their trades. These platforms vary in terms of security, fees, available cryptocurrencies, and user experience. Additionally, traders can trade Bitcoin and crypto in different forms and on different markets. Options are the spot market, the futures and options market, Exchange Traded Funds (ETFs) and Exchange Traded Products (ETP) as well as Contracts For Difference (CFDs).
Understanding these basic distinctions provides a foundation upon which traders can build more complex strategies, including long and short positions. As we delve deeper into these strategies, keep in mind that crypto trading requires not only an understanding of market trends and behaviors but also a basic technical understanding in order to recognize the value proposition of the respective cryptocurrencies and thus market trends.
What Is A Long Position In Crypto?
A long position in crypto, often simply referred to as “going long,” is a fundamental strategy where traders invest in a cryptocurrency with the expectation that its value will rise over time. This approach is grounded in a positive outlook on the market’s future performance, making it a cornerstone of traditional investment strategies adapted for the crypto world.
When a trader takes a long position, they purchase a cryptocurrency at a certain price, aiming to sell it at a higher price in the future. The difference between the purchase price and the selling price represents the profit. This strategy requires patience and a keen eye for market trends, as the appreciation in value may occur over varying timeframes, from short-term spikes to long-term growth.
Successful long positions often depend on thorough market analysis. Traders need to assess various factors, including technological advancements in blockchain, changes in regulatory landscapes, market sentiment, and broader economic indicators that could influence the price of a cryptocurrency. By understanding these factors, traders can make more informed decisions about when to enter a long position.
While long positions are generally considered less risky than short positions due to the inherent nature of markets to rise over time, they are not without risks. The volatile nature of the crypto market means that long-term investments can be subject to significant fluctuations. Effective risk management strategies, such as setting stop-loss orders and diversifying portfolios, are crucial in mitigating potential losses.
What Is A Short Position In Crypto?
Understanding a short position in crypto trading is crucial for traders looking to capitalize on market declines. This strategy, often referred to as “going short,” involves betting against a cryptocurrency’s value, offering a contrast to the more traditional long position approach.

When traders go short, they sell a cryptocurrency they don’t own with the expectation of buying it back at a lower price. This begins with borrowing the asset and selling it at the current market price. If the price drops as expected, the trader repurchases the cryptocurrency at this lower rate, returns the borrowed amount, and keeps the difference as profit. This process is commonly known as selling short.
The mechanics of a short position are inherently riskier than long positions. The potential for losses is theoretically limitless, as cryptocurrency prices can surge unexpectedly. Thus, short selling demands a deep understanding of market trends and constant vigilance.
Timing is crucial in going short. Traders must accurately predict downturns, which can be influenced by various factors, including market sentiment, technical indicators, or external events. However, the volatile and unpredictable nature of the crypto market makes this a challenging endeavor. Notably, a stop loss is also a key instrument for risk-management.
A short position in the crypto context signifies a trader’s belief in an impending decrease in a cryptocurrency’s value. It’s not just a defensive strategy to hedge against potential losses but also a proactive approach to profit from market downturns. Despite its risks, seasoned traders often employ short positions as part of a diversified trading strategy, enabling them to leverage opportunities in all market conditions.
What Is Covering Shorts?
Covering shorts is a critical concept in crypto trading, particularly for those who engage in short selling. It refers to the process of buying back the borrowed cryptocurrency to close out a short position. This action is taken when a trader believes that the price of the cryptocurrency will no longer continue to decline, or to cut losses if the market moves against their prediction.
When a trader covers their shorts, they are essentially reversing the initial transaction. They buy the same amount of the cryptocurrency they initially borrowed and sold, aiming to do so at a lower price than they sold it for. This transaction concludes the short selling cycle. If the price is indeed lower, the trader profits from the difference; if higher, the trader incurs a loss.
“Market shorts” refer to the collective short positions held in the market. High levels of market shorts can indicate bearish sentiment, suggesting that many traders expect prices to fall. However, this can also lead to a “short squeeze,” where a sudden price increase triggers widespread covering of shorts, further driving up the price.
Long Position Vs. Short Position: When To Take It
Deciding between a long and a short position in crypto trading depends on several factors, including market analysis, risk tolerance, and investment horizon.

Traders should consider the current market trends and potential future developments. A long position might be more suitable in a bullish market or when positive developments are expected in the cryptocurrency space. On the other hand, a short position could be more effective during bearish market conditions or when negative news or trends are anticipated.
Short positions generally carry more risk due to the potential for unlimited losses. Traders with a lower risk tolerance may prefer long positions. Conversely, those willing to take on higher risk for potentially greater rewards might opt for short positions.
The choice between long and short positions also depends on the trader’s investment timeframe. Long positions are typically associated with a longer-term outlook, while short positions are often suited for short-term trading strategies.
Risk Management When Going Short
Risk management is particularly crucial when engaging in short selling due to the inherently high-risk nature of this strategy.
- Stop-Loss-Orders: One of the most important tools in managing risk while short selling is the use of stop-loss orders. These orders can help limit potential losses by automatically closing out a position if the cryptocurrency’s price moves unfavorably to a certain point.
- Hedging: Traders may also employ hedging strategies to mitigate risks associated with going short. This might involve diversifying their investment portfolio or using financial instruments like options or futures to provide a safety net against potential losses.
- Capital Management: Effective capital management is essential. This involves only allocating a portion of one’s capital to high-risk strategies like short selling, ensuring that a single bad trade does not significantly impact the overall trading capital.
Long/Short Strategies
In the volatile arena of crypto trading, long/short strategies are essential for traders to understand. These strategies, which involve navigating between long and short positions, are key to leveraging market movements and managing risk effectively.
Comparison: Long Position Vs Short Position In Trading
The decision to go long or short in crypto trading fundamentally depends on a trader’s market outlook and strategy.
- Long Vs. Short Position: A long position is taken with the expectation of a cryptocurrency’s price rising, reflecting a bullish outlook. In contrast, a short position is based on the anticipation of a price decline, indicative of a bearish market perspective.
- Risk Tolerance: The risk profiles of these positions differ significantly. Long positions, subject to market downturns, have a maximum loss limit (the asset can only drop to zero). Short positions, however, carry potentially unlimited risk, as there’s no cap on how high a cryptocurrency’s price can climb.
- Shorts vs Longs: The proportion of short positions versus long positions in the market can offer insights into overall market sentiment. A dominance of short positions might indicate bearish sentiment, whereas a prevalence of long positions suggests a bullish market.
Leverage When Going Short And Long
Leverage is a critical concept in crypto trading, especially when implementing long or short strategies. It allows traders to amplify their trading position beyond their actual capital, potentially increasing profits. However, it also escalates the risks, including the risk of liquidation.
Leverage in crypto trading means using borrowed funds to increase a trade’s exposure. For instance, using 10x leverage, a trader can open a position ten times the value of their actual investment. This can significantly amplify profits if the market moves in the trader’s favor. However, it also means that losses are magnified if the market moves against them.
A key risk when using leverage is liquidation. Liquidation occurs when the market moves against the leveraged position and the losses exceed the trader’s initial margin (the amount invested in the trade). If a trader’s position is close to being liquidated, they may be required to add more funds to their margin (a “margin call”) or risk having their position automatically closed by the exchange.
Long And Short Squeeze
A crucial aspect of long/short strategies is understanding the phenomena of long and short squeezes.
- Short Squeeze: This occurs when a sharp rise in the cryptocurrency’s price compels short sellers to buy back the asset to close their positions, often at a loss. This buying action can further drive up the price, amplifying the squeeze.
- Long Squeeze: Conversely, a long squeeze happens when a sudden drop in prices forces traders in long positions to sell their holdings, usually to limit losses. This selling pressure can further depress the cryptocurrency’s price.
These squeezes are significant market events that can lead to rapid and substantial price movements, impacting both individual trading strategies and overall market dynamics.
Position Trader Strategy In Crypto Markets
This strategy plays a unique role, often focusing on longer-term trends and strategies.
- Position Trader Strategies: These traders typically hold their positions over extended periods, basing decisions on long-term market trends rather than short-term fluctuations. This approach requires a deep understanding of market fundamentals and a patient, disciplined investment philosophy.
- Longer Position Approaches: In taking longer positions, position traders often weather short-term market volatility in anticipation of long-term gains. This strategy demands not only a thorough analysis of the cryptocurrency’s potential but also a steadfast approach to riding out market highs and lows.
Practical Guide To Long & Short Crypto
Successfully trading cryptocurrencies involves more than understanding market trends; it requires knowing how to effectively execute long and short positions. This practical guide provides insights into the mechanisms of long and short crypto trading, recommends platforms for these trades, and offers a detailed guide to short selling in the crypto world.
How To Long And Short Crypto?
The process of going long or short in crypto involves several key steps:
Market Analysis: Before taking any position, conduct thorough research. Analyze market trends, news, technical indicators, and any other relevant information that could impact the price of the cryptocurrency.
- Choosing A Position: If your analysis suggests an upcoming rise in the crypto’s value, you would buy (or ‘go long on’) the crypto with the intention of selling it later at a higher price. Conversely, if you anticipate a decrease in value, you would sell the crypto (or ‘go short’), ideally repurchasing it later at a lower price to profit from the difference.
- Order Execution: Use a crypto trading platform to place your order. For long positions, this will typically be a ‘buy’ order; for short positions, a ‘sell’ order. Advanced traders might use market, limit, or stop orders based on their strategy.
- Risk Management: Always implement risk management strategies like setting stop-loss orders or only investing what you can afford to lose, especially important in the highly volatile crypto market.
- Close The Position: Monitor the market closely and close your position when you have achieved your target profit or want to cut a loss. For long positions, this means selling your crypto; for short positions, buying back.
Best Crypto Platforms To Long & Short
Choosing the right platform is crucial for effective long and short trading. Here’s a list of the most renowned platforms:
- Binance Futures: Known as the most liquid crypto contract trading platform, Binance Futures offers futures contracts for a wide range of cryptocurrencies. It provides options of cross margin and isolated margin modes, with up to 125x leverage on selected trading pairs.
- Bybit: This global cryptocurrency exchange focuses on crypto futures contracts and also offers options trading and spot trading. It has futures settled in USDC and USDT stablecoins, as well as in the underlying cryptocurrency.
- BitMEX: A pioneering platform in crypto contract trading, BitMEX caters to experienced traders and provides access to perpetual swaps and futures contracts margined in BTC, USDT, and ETH.
- OKX: OKX offers a comprehensive suite of trading products including perpetual swaps, futures, and options. It also features competitive fees and a trading bot marketplace.
- Deribit: Dominant in crypto options contracts, especially for Bitcoin and Ethereum, Deribit is the preferred platform for institutional-grade crypto derivatives trading.
- BingX: This platform lists both perpetual and standard futures contracts settled in USDT, covering a wide selection of cryptocurrencies.
- Phemex: Phemex provides stablecoin-settled futures, coin-settled futures, and USD-settled futures. It also features a “hedge mode,” allowing traders to hold long and short positions simultaneously on the same contract.
FAQ: Long And Short Positions
What Is A Short Position?
A short position in crypto trading refers to selling a cryptocurrency that the trader does not own, with the expectation of buying it back later at a lower price. This strategy is used when the trader believes the price of the crypto will decrease.
What Is A Long Position?
A long position in crypto trading is when a trader buys a cryptocurrency with the expectation that its value will increase. It’s a strategy based on optimism about the asset’s future performance.
What Is The Difference Between A Long And Short Position?
The primary difference is in the market outlook. A long position reflects a bullish stance, expecting the asset’s value to rise. A short position, however, is bearish, predicting a decline in the asset’s value.
Selling Short Explained?
Selling short involves borrowing a cryptocurrency and selling it at the current market price. The trader then aims to buy it back at a lower price, return the borrowed coins, and keep the difference as profit.
Explain The Term ‘Short Position Meaning’ In The Context Of Crypto?
In the context of crypto, a short position means taking a trading stance where you anticipate a decrease in the cryptocurrency’s value. It involves selling the crypto now to buy it back at a lower price later.
What Is The Difference Between Long Vs Short Position?
The difference lies in market speculation. Going long is speculating on a price rise, while going short is speculating on a price drop. Both strategies have different risk profiles and market approaches.
What Are Long And Short Positions?
Long and short positions are trading strategies in cryptocurrencies. A long position bets on a price increase, while a short position bets on a price decrease.
How Do Long & Short Positions Affect The Crypto Market?
These positions can significantly impact market liquidity and price movements. A predominance of long positions can indicate bullish market sentiment, while a majority of short positions may signal a bearish outlook.
What Is The Difference Between Short Selling And Long Selling?
Short selling is selling a borrowed cryptocurrency with the plan to repurchase it at a lower price. Long selling, however, is simply selling a cryptocurrency that you own, expecting that its price will not rise further.
What Are Long Positions?
Long positions in crypto trading are when traders buy and hold a cryptocurrency, expecting its value to increase over time.
What Is A Short In Trading?
A short in trading refers to the practice of selling a borrowed asset (like a cryptocurrency) with the intention of buying it back at a lower price.
What Does ‘In Short Order’ Mean?
‘In short order’ typically means accomplishing something quickly or within a short period. In trading, it might refer to rapidly executed trades or market movements.
What Is Short In Trading?
In trading, going short means taking a position that profits from the decline in the price of an asset.
How To Long And Short Crypto?
To long crypto, buy and hold it expecting an increase in value. To short crypto, sell a borrowed cryptocurrency anticipating a decrease in its price. Both strategies require careful market analysis and risk management.
What Are Platforms To Short Crypto?
Platforms like Binance Futures, Bybit, BitMEX, OKX, and others offer the ability to short crypto. This is possible through various trading instruments like futures and options contracts.
Yuga Labs co-founder addresses comeback rumors amid ongoing health break

Wylie Aronow said he’s been seeing a number of tweets this week asking when he’s planning to return to the helm at Yuga Labs.
Bitcoin Vulnerability Discovered By A Developer Has Been Flagged By The US Government
Last week, a Bitcoin developer Luke Dashjr raised alarm about a possible vulnerability in the network in relation to the Bitcoin Ordinals that could lead to a code exploit. After posting his findings to social media, Dashjr’s warnings were not taken seriously as community members believed it was a non-issue. However, the US government seems to be taking the vulnerability seriously, adding it to its vulnerability database.
Dashjr’s Finds Vulnerability In Bitcoin Network
Dashjr had first raised alarm about the bug in the Bitcoin network on December 6 through an X (formerly Twitter) post. As the developer explains, this bug was related to the BTC Inscriptions which have gained popularity in the last year. This capability has helped developers to create what could be referred to as Bitcoin’s version of non-fungible tokens (NFTs).
Elaborating on the mechanism of Ordinals, Dashjr explained that the Inscriptions were actually taking advantage of a vulnerability in the Bitcoin Core. Developers are able to hide their data as program code, thereby being able to bypass the preset limit on the size of extra data that can be included in BTC transactions.
Dashjr explained that he was working to fix this issue. However, the vulnerability remains as developers are still able to create inscriptions on the network. Even after being fixed in the “Bitcoin Knots v25.1,” the developer explains that the vulnerability still remains “in the upcoming v26 release.” As for when the vulnerability might be completely fixed, Dashjr said he hopes this will happen sometime in 2024.
As Bitcoinist reported, not everyone in the community agreed that this was actually a vulnerability. Some worried that if the ‘vulnerability’ is eventually fixed, Ordinals and BRC-20 tokens would disappear, to which Dashjr responded in the affirmative.
NIST Adds BTC Bug To Vulnerability List
Despite the Bitcoin community not taking the warning of the vulnerability seriously, the United States government has chosen a more proactive approach. The National Vulnerability Database which is under the government agency, the National Institute of Standards and Technology (NIST), has moved forward to add the vulnerability to its Vulnerability List under ‘Common Vulnerabilities and Exposures.’
The agency has assigned the vulnerability with the code CVE-2023-50428 after identifying that it could be a potential risk for the network, especially when it comes to security or integrity. This means the agency believes this could lead to an exploit in the Bitcoin network.
The very existence of Ordinals and BRC-20 tokens is already identified as one of the ways that this vulnerability is already being exploited. Naturally, the agency is looking to prevent other ways in which the vulnerability could be further exploited in a way that could cause harm to its users.
More US senators back Elizabeth Warren’s AML bill targeting crypto

The legislation, reintroduced in July, already has the support of several U.S. lawmakers, but critics have suggested it could threaten financial freedom and privacy.


