Chainlink MVRV Enters Bearish Zone As LINK Breaks $10, Correction Soon?

On-chain data shows the Chainlink MVRV ratio has shot up as LINK has rallied above $10, a sign that a steep correction may be due for the asset.

Chainlink 30-Day MVRV Ratio Has Crossed The Bearish 20% Mark

As explained by an analyst in a post on X, the last three times the LINK MVRV ratio hit similar levels as now, the cryptocurrency registered a sharp drawdown. The “MVRV ratio” (where MVRV stands for Market Value to Realized Value) is an indicator that measures the ratio between the Chainlink market cap and the realized cap.

The realized cap here refers to a LINK capitalization model that assumes the true value of each coin in circulation isn’t the same as the asset’s spot price, but rather the price at which the coin last moved on the blockchain.

This price at which the coin was last transferred could be imagined to be the value at which its holder bought it, so the realized cap takes into account the prices at which each investor in the market acquired their LINK.

Thus, the realized cap is essentially a measure of the total amount of capital the holders as a whole have invested into Chainlink. Since the MVRV ratio compares the market cap with this metric, it can provide us with info about the profit/loss situation of the investors.

Now, here is a chart that shows the trend in the 7-day moving average (MA) of the ChainlinK MVRV ratio over the past year and a half:

Chainlink MVRV ratio

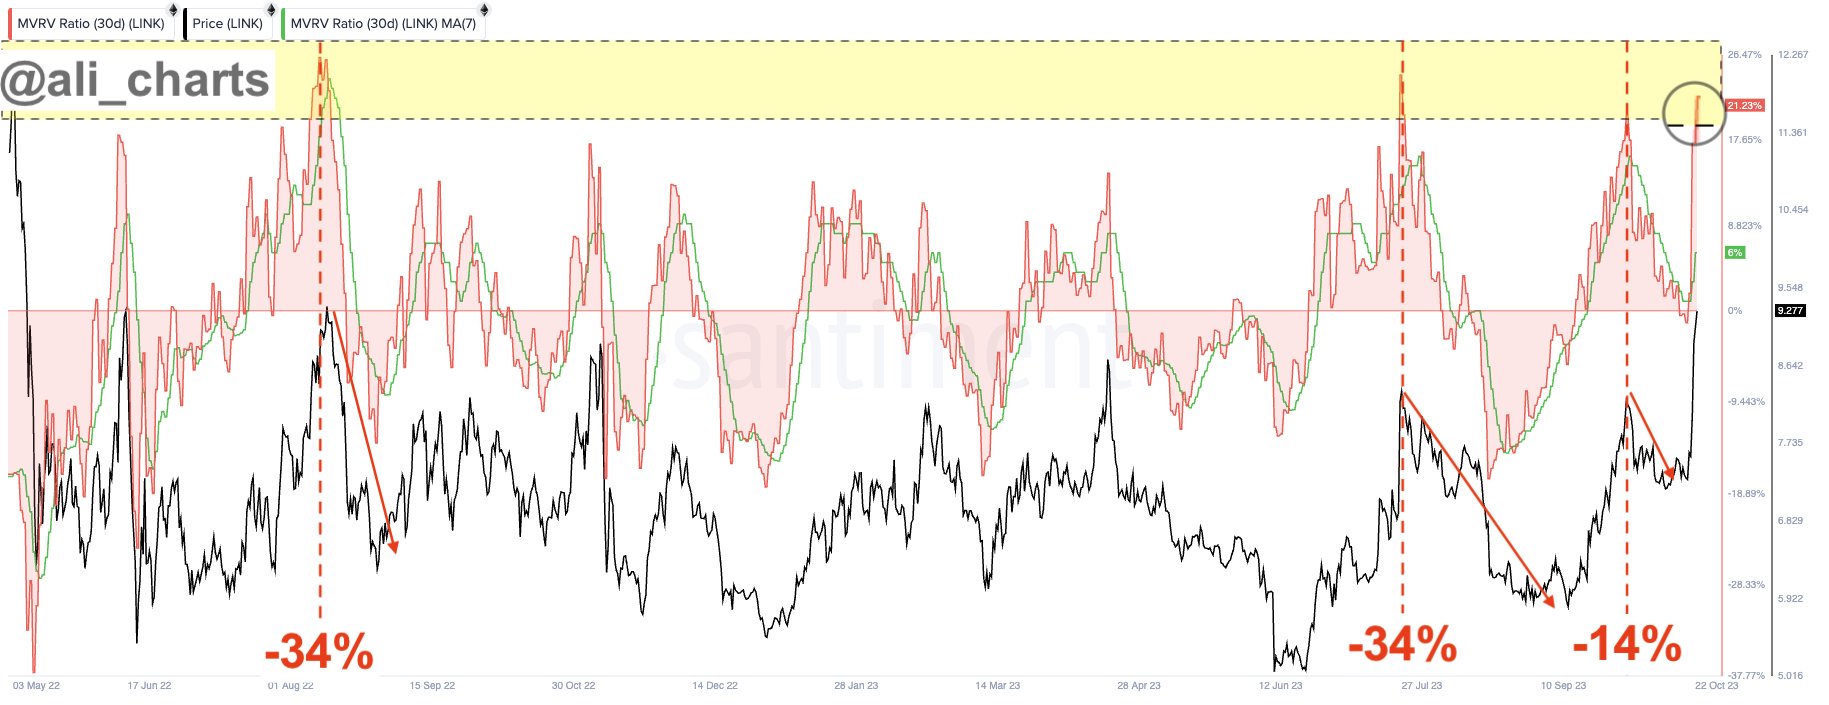
Note that in the above graph, the MVRV ratio shown isn’t just the ordinary version, but rather the 30-day one. What this means is that this indicator only takes into account the data of coins that were moved within the past month.

From the chart, it’s visible that the Chainlink 30-day MVRV ratio has observed a strong rise recently as the price of the cryptocurrency has enjoyed sharp upward momentum.

The metric has crossed the 21% mark with this increase, suggesting that the investors who bought within the last 30 days are holding 21% more in value than what they put in.

Usually, the more the profits held by the investors, the greater their probability of giving in to the allure of profit-taking. As such, whenever the investors are carrying a high amount of profits, the risk of a correction taking place can become significant.

In the current case, the Chainlink investors are those who only bought within the past 30 days, which means that this cohort is bound to have fickle-minded hands who would easily be tempted to harvest their gains.

As the analyst has marked in the chart, it would appear that the last three times the MVRV ratio crossed above 20% for this group, the LINK price observed a sharp decline.

In the first two cases, this drawdown was 34% each, while in the third and latest one, it was about 14%, which is still quite a notable drop. If this pattern is anything to go by, Chainlink may see another such correction soon.

LINK Price

Chainlink has seen another 9% rise during the last 24 hours as its price has now broken above the $10.1 mark.

Chainlink Price Chart

Analyst Predicts Bullish Bitcoin Price Rally To $41,000, Here’s When

The Bitcoin price went over $30,000 over the weekend to reach its highest point since mid-July. As part of this recent rally, crypto trader Carl From The Moon has shared his Bitcoin analysis, predicting the cryptocurrency is poised for a massive 37% rally that could send the price up to $41,000.

Analyst Carl From The Moon Predicts Bitcoin Price Rally

Bitcoin has been subject to many price predictions in recent months, particularly as the industry awaits the approval of applications for a spot Bitcoin ETF. Subsequently, Carl Runefelt, also known as Carl From The Moon, based his long-term analysis on a bullish run if these applications were approved. 

In a new YouTube video, Carl points out that Bitcoin’s price action has just completed a diamond pattern, and a big breakout move to the upside is imminent in the next 30 days. 

Carl sees a few factors indicating Bitcoin is ready to soar. First, the crypto formed an upside movement at the beginning of the year. Subsequently, a diamond pattern began to form around April on the weekly timescale. Now, Bitcoin is in a prime position to clear the $31,000 resistance level, which would surge the cryptocurrency 37% from its current price of around $30,000 up to $41,000.

“What we can see now is a massive, massive diamond pattern on the weekly timeframe. And if Bitcoin breaks up like this, then we could see Bitcoin go all the way up to $41,000, which would be absolutely insane, right?” Carl said.

For now, Carl remains extremely bullish. Aside from his prediction, Carl also reflected on the current general sentiment of most Bitcoin traders for the near future. He does this by showing his leveraged long positions on different crypto exchanges while planning to add more when a spot Bitcoin ETF is approved. 

“Any day now, the ETF will come out, and then we will wish that we had these long positions open,” the crypto analyst said.

Carl isn’t the only analyst predicting high Bitcoin prices based on the approval of Bitcoin ETFs. Several other experts also think Bitcoin will spike in the coming months, with some giving higher price targets than others. 

For example, crypto analyst Mags on social media platform X predicted a $70,000 price tag is foreseeable. A more optimistic prediction came from Ark Invest CEO Cathie Woods, who predicted $1.48 million for each Bitcoin based on increasing mainstream adoption.

At the time of writing, Bitcoin is trading at $30,522, up by 9.86% in a 7-day timeframe. Most signs point to higher prices ahead, and many retail investors and heavyweights alike look to position themselves. Crypto whale transaction tracker Whale Alerts also recently revealed a massive 1,087 BTC withdrawal from crypto exchange Binance.US to a private wallet, suggesting there’s accumulation taking place.

Bitcoin price chart from Tradingview.com

The Dogecoin Advance: A Double-Digit Boost In The Cards?

Dogecoin (DOGE) remains a notable outlier in the cryptocurrency market, as it struggles to replicate the impressive price surges seen in other digital assets. However, all hope is not lost. Despite its lackluster performance, market expert Ali Martinez has offered a glimmer of hope for DOGE enthusiasts. 

Martinez’s technical analysis, based on the TD Sequential indicator, has signaled a potential uptrend for Dogecoin. However, investors should approach these predictions with caution, as the market’s volatility remains a significant factor.

A Promising Signal For DOGE’s Weekly Chart

In a recent analysis, Ali Martinez dissected Dogecoin’s price movements, highlighting a potential shift in its fortunes. His study pinpointed a promising buy signal on DOGE’s weekly chart, suggesting that the meme coin might be gearing up for an upward trajectory. 

The key to this potential breakthrough lies in DOGE’s ability to maintain a close above the $0.062 mark. If this level is sustained, it could trigger an upswing, propelling Dogecoin to reach $0.070, according to Martinez’s analysis.

Currently, Dogecoin is valued at approximately $0.062736, as per CoinGecko. While it has recorded a 3.2% rally over the past 24 hours and a 4.0% surge in the last seven days, it still lags behind other cryptocurrencies that have witnessed more substantial gains during this period.

Bullish Signals And Caution For DOGE Investors

On the flip side, Martinez’s analysis also identifies potential risks for DOGE holders. Should the price of Dogecoin produce a daily candlestick close below the $0.0582 mark, it could establish a lower low, signaling a bearish trend. This could attract sellers and potentially lead to an 8.90% price drop, pushing DOGE down to $0.0550.

Investors are urged to exercise caution as they navigate the volatile world of cryptocurrencies. While the weekend shows a bullish outlook for Dogecoin, it’s important to keep in mind that the start of a new week can reset existing market biases. With the crypto space constantly in flux, adopting a balanced and measured approach is imperative for those seeking to navigate the tumultuous terrain of digital assets.

Dogecoin’s recent performance, while not as remarkable as other cryptocurrencies, has sparked optimism among some analysts like Ali Martinez. His technical analysis indicates the possibility of an upward trajectory if DOGE can maintain its position above the $0.062 mark. 

(This site’s content should not be construed as investment advice. Investing involves risk. When you invest, your capital is subject to risk).

Featured image from MoneyControl

Mid-Term XRP Price Targets Revealed By Crypto Analyst

Egrag, a crypto analyst, today presented his medium-term predictions for the XRP price on X (formerly Twitter). He backed up his projections with the 3-day chart and pointed out several potential price points that investors should watch out for.

Analysis Of The 3-Day Chart XRP/USD

Egrag’s chart, based on Binance’s 3-day XRP/USDT pair, suggests that XRP is currently in the midst of a crucial breakout retest phase. He emphasized the current market dynamics by saying, “What’s happening right now is merely a retest of the breakout; the true pump is still on the horizon, and it’s bound to be epic!”

The analyst highlighted XRP’s triumphant rally from mid-July, which surpassed his original target of $0.85 and rose to a commendable $0.93, surpassing the original price target by 9.41%. Egrag’s 3-day chart shows a descending trend line, which the analyst calls the “Final Wake Up Line.”

According to him, the breakout above the trend line on July 13 after the summary judgment in the lawsuit between Ripple Labs and the US Securities and Exchange Commission (SEC) was the final wake-up call for investors who were still waiting on the sidelines.

XRP price prediction

Currently, the XRP price sits at around $0.52. As the analyst shows in the chart, XRP has experienced a retest of the trend line and passed it with flying colors. In particular, Egrag also points out that XRP was able to stay above the 0.236 Fibonacci retracement level at $0.4534.

This laid the foundation for the XRP price to enter bullish territory at this point. However, the price still faces the resistance zone between $0.55 and $0.60, which Egrag calls the “backbone junction”. Noteworthy is that the upper end of the price range coincides with the 0.382 Fibonacci retracement level. Exceeding this resistance is crucial, especially because it has provided strong resistance several times in the past.

Once this is accomplished, Egrag’s medium-term XRP price targets will come into focus. As explained, he has made an adjustment to his price targets as a result of the July increase. Due to the 9.41%-higher July rise compared to his original price target, Egrag now expects XRP to rise to $1.10 (instead of $1) in an initial rally.

Egrag has also raised the $5.5 price target to around $6, and the previous $6.4 benchmark has been recalibrated to nearly $7. He stated:

So, if we apply this same percentage increase to our upcoming targets, here’s what we can look forward to:

A) $1 * 9.41% = Approximately $1.10

B) $5.5 * 9.41% = Roughly $6

C) $6.4 * 9.41% = About $7

Lower Price Targets

Egrag’s analysis is based on several Fibonacci levels and shows potential resistance points. These are the Fibonacci 0.5 ($0.7528), 0.618 ($0.9442), 0.702 ($1.1095), 0.786 ($1.3038), 1 ($1.9664), and the Fibonacci extension levels at 1.272 ($3.3153), 1.414 ($4.3546), and 1.618 ($6.4420).

Overall, the analysis suggests that XRP’s upward momentum is likely to continue and build on its recent successes. The recent rise in price above the analyst’s lower target suggests robust upside sentiment in the market. However, investors should remain keenly aware of the crypto market’s inherent unpredictable nature and exercise due diligence at all times.

Egrag ended his tweet on an encouraging note for the community, “XRP Army STAY STEADY, We’re advancing step by step towards our exciting targets.”

At press time, XRP traded at $0.5291.

XRP price