Shiba Inu Stagnation: What’s Causing Meme Coin’s Recent Sluggishness?

Shiba Inu (SHIB) investors have been caught in a whirlwind of uncertainty for the past month as the cryptocurrency’s price has stubbornly clung to a narrow range between $0.0000075 and $0.000007.

This protracted period of stagnation has left traders and enthusiasts alike scratching their heads, wondering when the next significant move might occur.

The current SHIB price, as reported by CoinGecko, hovers at $0.00000715, representing a modest 1.4% decline over the last 24 hours. Over the span of seven days, the meme coin has dipped by nearly 6%, indicating a gradual erosion of value. 

This pattern of price fluctuations within such a confined range underscores a lack of decisive action from both buyers and sellers, painting a picture of market ambivalence.

Implications Of A Range-Bound Market For Shiba Inu

One can’t help but wonder about the implications of this seemingly stuck range. Given the broader crypto market’s recent slump, it wouldn’t be surprising to see SHIB test the lower echelon of this range, potentially signaling an extension of its bearish undertones.

With the larger market sentiment in a state of flux, SHIB’s fate remains intertwined with the broader crypto landscape.

The ongoing downtrend in SHIB’s price can be visually traced to the formation of a falling wedge pattern on the weekly chart. This pattern is characterized by two converging trendlines that serve as dynamic resistances and supports.

While such patterns can sometimes hint at an impending bullish breakout, the prevailing market sentiment suggests that investors should remain cautious and prepared for any outcome.

Declining Whale Activity: What Does It Mean?

Another noteworthy development in the SHIB ecosystem is the decline in large network transactions. The number of significant transactions on the SHIB network has dwindled to a mere 20, marking one of the most inactive periods for the meme coin, especially concerning the activity of its large holders. Several factors could be contributing to this sudden drop in whale activity.

One of the potential reasons might be the waning interest in highly volatile assets like SHIB, particularly as Bitcoin’s dominance continues to rise within the crypto sphere. As the flagship cryptocurrency asserts its dominance, many investors appear to be realigning their portfolios, moving away from riskier assets to more established ones.

This shift in investor sentiment could explain the reduction in significant SHIB transactions as market participants seek more stability in their cryptocurrency holdings.

The formation of a falling wedge pattern and the decline in large network transactions underscore the challenges facing SHIB’s price trajectory. SHIB holders and enthusiasts must remain vigilant and adaptable to navigate the ever-changing tides of the digital asset market.

(This site’s content should not be construed as investment advice. Investing involves risk. When you invest, your capital is subject to risk).

Featured image from Shutterstock

Crypto Analyst Presents Data To Prove That XRP Is Deflationary

In the past, many have argued whether or not the XRP token was deflationary or not. In support of the former, pro-XRP crypto analyst Panos Mekras has provided data that suggests that the token has deflationary characteristics. 

Number Of Tokens Burned So Far

In a tweet shared on his X (formerly Twitter) platform, Mekras referenced another tweet showing that over 11 million tokens had been burned. This stat undoubtedly suggests that the token is deflationary since its total supply has decreased over time due to the burn mechanism.

However, another X user (@hasen_van) argued that the token was only deflationary in “respect to all XRP in existence” and that the token will continue to be inflationary as long “as Ripple keeps on selling into the open market.”

In response, Mekras tried to correct the belief that some XRP tokens were not yet “in existence” as he stated that XRP’s total supply of 100 billion has existed since “day 1,” meaning that 100% of its supply has been circulating from the beginning and some XRP tokens cannot be classified as ‘non-existent’ yet. 

This debate seems to stem from the fact that Ripple has an escrow system in place. As such, some (like VanHansen) believe that the XRP in escrow lockups does not fall under its circulating supply and that this escrow system affects XRP’s deflationary status. However, people like Mekras argue that the escrow system doesn’t change the fact that the token is deflationary.

VanHansen further argued that the token cannot be deflationary (except technically) as XRP’s circulating supply gets inflated every time “Ripple releases XRP from the escrow.” Both sides seemed to look at it from different angles, with Mekras abiding by what deflationary meant in the strict sense while VanHansen was trying to provide a context. 

XRP price chart from Tradingview.com (Is XRP deflationary)

Is XRP Deflationary Or Not?

It is worth mentioning that the XRP Ledger doesn’t exactly have a built-in mechanism to decrease the token’s total supply, unlike some other networks. For instance, Ethereum implemented the London hard fork, which introduced a fee-burning mechanism with some Ether burned immediately after processing a transaction.

Related Reading: When Are AMMs Coming To XRP Ledger? Ripple CTO Gives Clear Answer

However, in XRP’s case, these token burns have occurred coincidentally rather than being a deflationary model on the network. In July, an engineer at Ripple explained that the monumental increase in the burn rate was mostly because of the XRPL account deletions. He mentioned that 2 XRP are usually burned when an account is deleted. 

He further noted that 85,556 old accounts on the Ledger were deleted in June, which led to over 100,000 XRP being burned. Hence, the burned token figure rises every time an account is deleted.

Bitcoin Price Ready For Blast-Off As Key Metrics Signal A Bull Run: Top Analyst

Bitcoin price analysts are pointing to a combination of high timeframe indicators that suggest the bear market for the leading cryptocurrency may be over, hinting at an impending upward surge.

TechDev, a prominent crypto analyst known for insightful market analysis, recently shared a compelling perspective on social media platform X. Drawing parallels to historical trends, TechDev contends that Bitcoin is currently in a familiar position, reminiscent of the preludes to the 2016 and 2020 bull markets.

Bitcoin Price Analysis: Volatility Contraction Signals Imminent Breakout

To illustrate this perspective, TechDev presented a chart featuring monthly candles, Bollinger bands, and a specialized indicator showcasing the logarithmic width between the bands in relation to the 200-month moving average. What is particularly intriguing about this chart is how Bitcoin’s Bollinger bands, which gauge relative volatility, have significantly contracted, implying a forthcoming breakout to the upside.

This influential analyst further points out that Bitcoin is not alone in its quest for a bullish breakout; the broader altcoin market is also in contention. To make this comparison, TechDev references the “OTHERS” chart, measuring the collective market capitalization of all cryptocurrencies except Bitcoin and Ethereum (ETH).

In TechDev’s analysis, Bitcoin has forged crucial support levels at the inception of a long-term bullish momentum. Simultaneously, the “OTHERS” index has managed to break through a long-standing downward resistance. These developments collectively indicate that both Bitcoin and the altcoin market are primed for significant moves, potentially marking the end of the bear market phase.

As of the latest data from CoinGecko, Bitcoin’s price stands at $27,916 with a 24-hour price movement of 0.0% and a marginal 0.1% decline over the past week. This relative stability suggests that investors are holding their positions, awaiting the anticipated breakout.

Whale Activity Sparks Speculation

Meanwhile, in a surprising turn of events, a dormant Bitcoin address that had remained inactive for three years suddenly sprung back to life. Approximately 5,000 Bitcoins, valued at around $140 million, were transferred from this address. Notably, this substantial transfer was divided among three different addresses, as highlighted by PeckShield, a renowned blockchain security firm.

The implications of this significant whale movement on Bitcoin’s price remain to be seen. Such sizeable transactions often draw attention and can have varying effects on market sentiment. Traders and investors will be closely monitoring how this unexpected development plays out in the coming days and weeks.

The convergence of multiple high timeframe indicators suggests that Bitcoin may be on the cusp of a bullish resurgence, reminiscent of previous market cycles.

As Bitcoin continues to vie for an upward breakout alongside the broader altcoin market, the crypto community eagerly anticipates the potential end of the bear market and the start of a new phase in the digital asset landscape. 

(This site’s content should not be construed as investment advice. Investing involves risk. When you invest, your capital is subject to risk).

Featured image from The Drive

Binance CEO Foresees Monumental Bitcoin Price Shift Following Halving

As the crypto community’s anticipation heightens for the upcoming Bitcoin halving, Changpeng Zhao (CZ), CEO of Binance, recently elucidated his observations around the historical patterns tied to this quadrennial event. Highlighting the evolving sentiments and speculations, CZ spotlighted the dominant themes before and after the halving events.

CZ observed that the preceding months to the halving are generally characterized by heightened discourse, diverse sentiments, and amplified expectations within the cryptocurrency sphere. “The few months leading up to the Bitcoin halving, there will be more and more chatter, news, anxiety, expectations, hype, hope, etc.,” he stated.

Addressing the commonly held belief that Bitcoin’s price will witness an immediate uptick post-halving, CZ dispelled such notions based on historical patterns. “The day after the halving, the Bitcoin price won’t double overnight. And people will be asking why it didn’t,” he remarked, addressing the immediate aftermath expectations.

While the short-term reactions post-halving may be tempered, CZ shed light on a longer-term trend where Bitcoin often reaches new all-time highs (ATHs) within the year that follows. In reference to the market’s ability to quickly transition from skepticism to marvel, he quipped, “People have short memories.”

However, CZ urged caution, emphasizing that historical patterns should not be construed as definitive indicators for future behaviors, noting, “Not saying there is proven causation. And history does NOT predict the future.”

A More In-Depth Analysis Of Bitcoin Halving

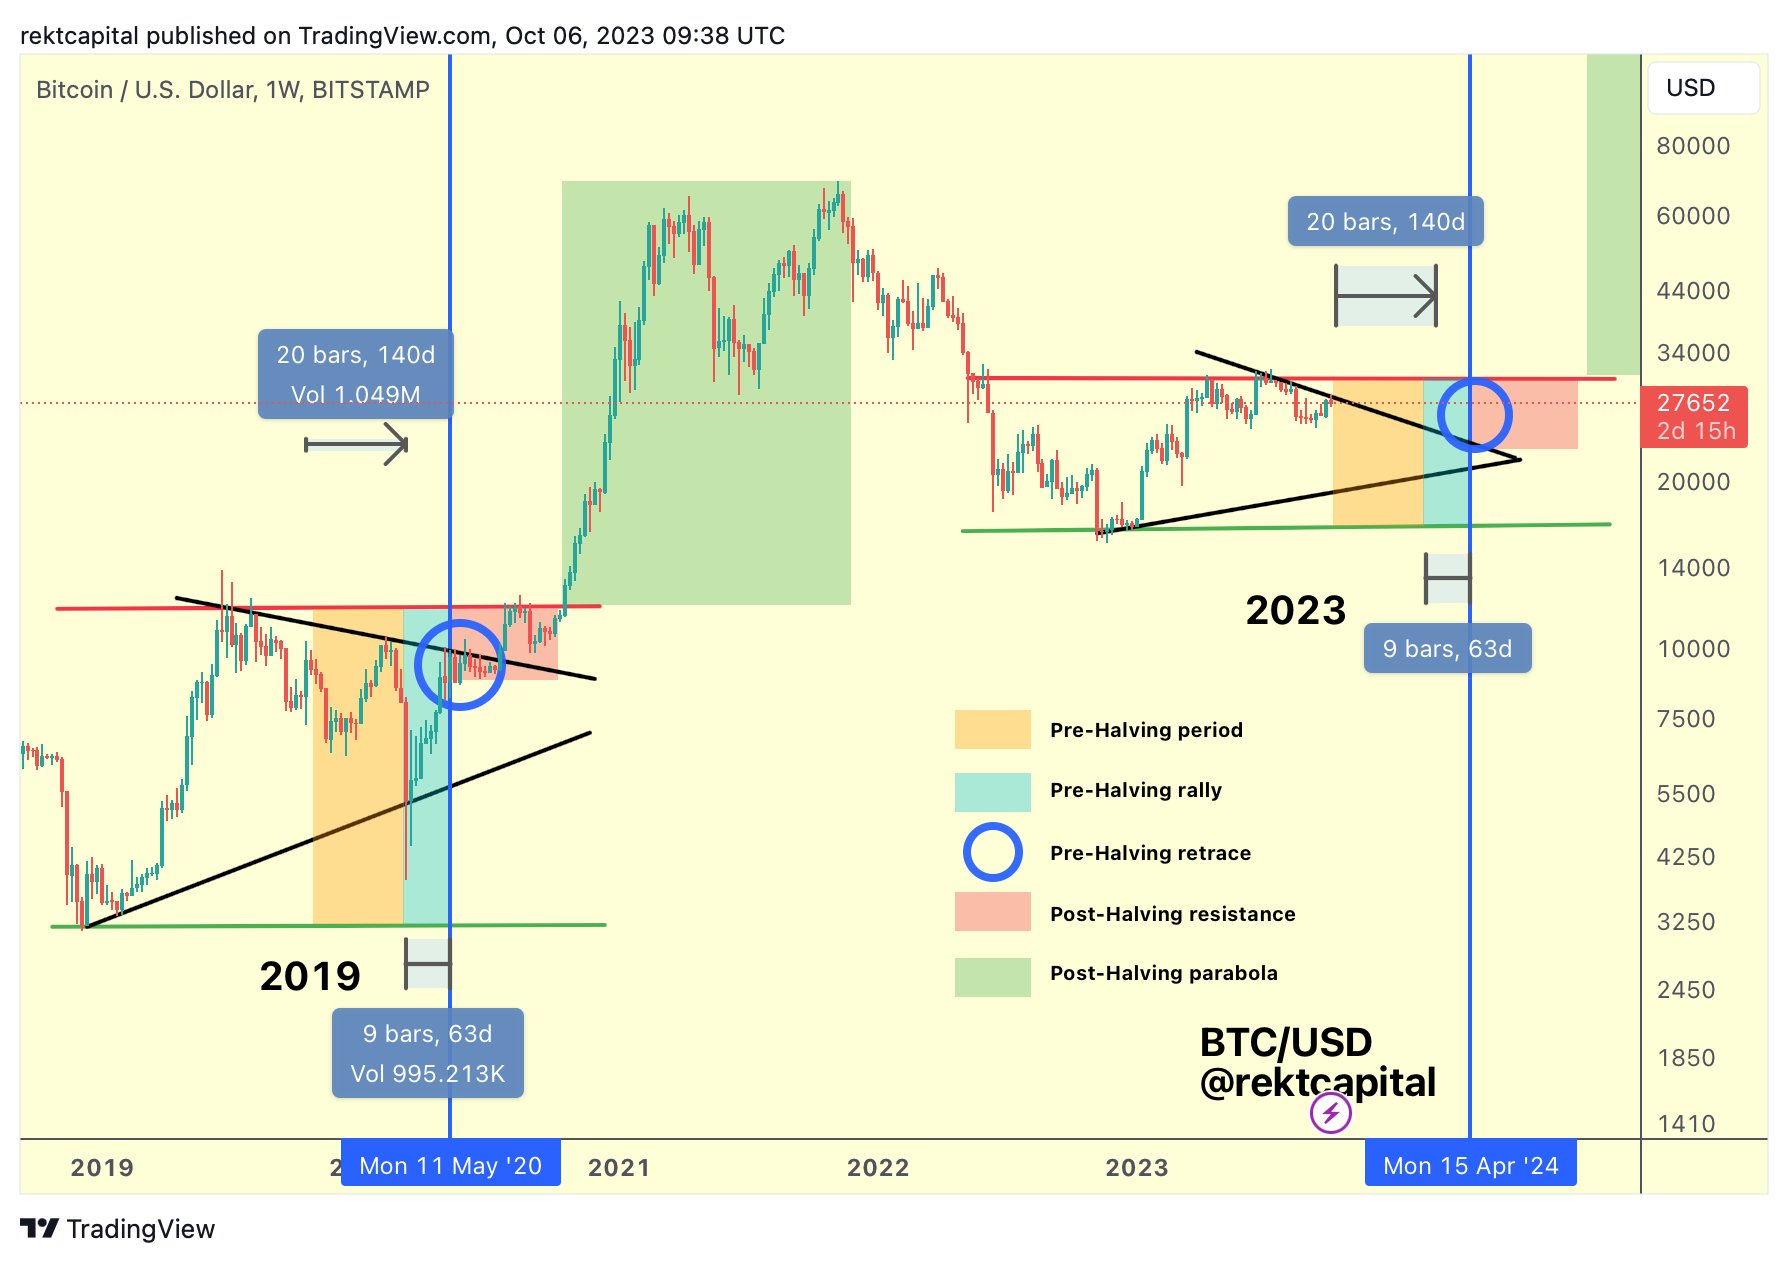
As Bitcoinist reported, renowned crypto analyst Rekt Capital recently published an in-depth analysis of the Bitcoin halving, offering a more granular view of the potential phases surrounding the event which is only 197 days and a few hours away according to Binance’s estimates.

Reflecting on historical patterns, the analyst suggested a possible deeper retrace for Bitcoin in the 140 days leading up to the halving. Drawing historical parallels, Rekt Capital emphasized, “You can debate whether 2023 is more like 2015 or more like 2019… Doesn’t change the fact that BTC retraced -24% in 2015 and -38% in 2019 at this same point in the cycle (i.e. ~200 days before the halving).”

Bitcoin halving prediction

Anticipating market dynamics as the halving nears, Rekt Capital postulated that roughly 60 days before the event, historically a pre-halving rally will likely emerge. This phase, marked by investor enthusiasm and elevated expectations as CZ puts it, is often characterized by buying into the halving anticipation.

But this enthusiastic phase doesn’t last. Around the halving event, the market often shows pullback behavior under the motto “buy the rumor, sell the news”. Highlighting this trend, the analyst cited the -38% dip witnessed in 2016 and the -20% decline in 2020, moments when the market re-evaluated the halving’s short-term implications.

Subsequent to this, Rekt Capital predicts a multi-month re-accumulation phase, often marked by investor fatigue due to stagnation. However, breaking out of this phase typically heralds Bitcoin’s entry into a parabolic uptrend, potentially culminating in new all-time highs.

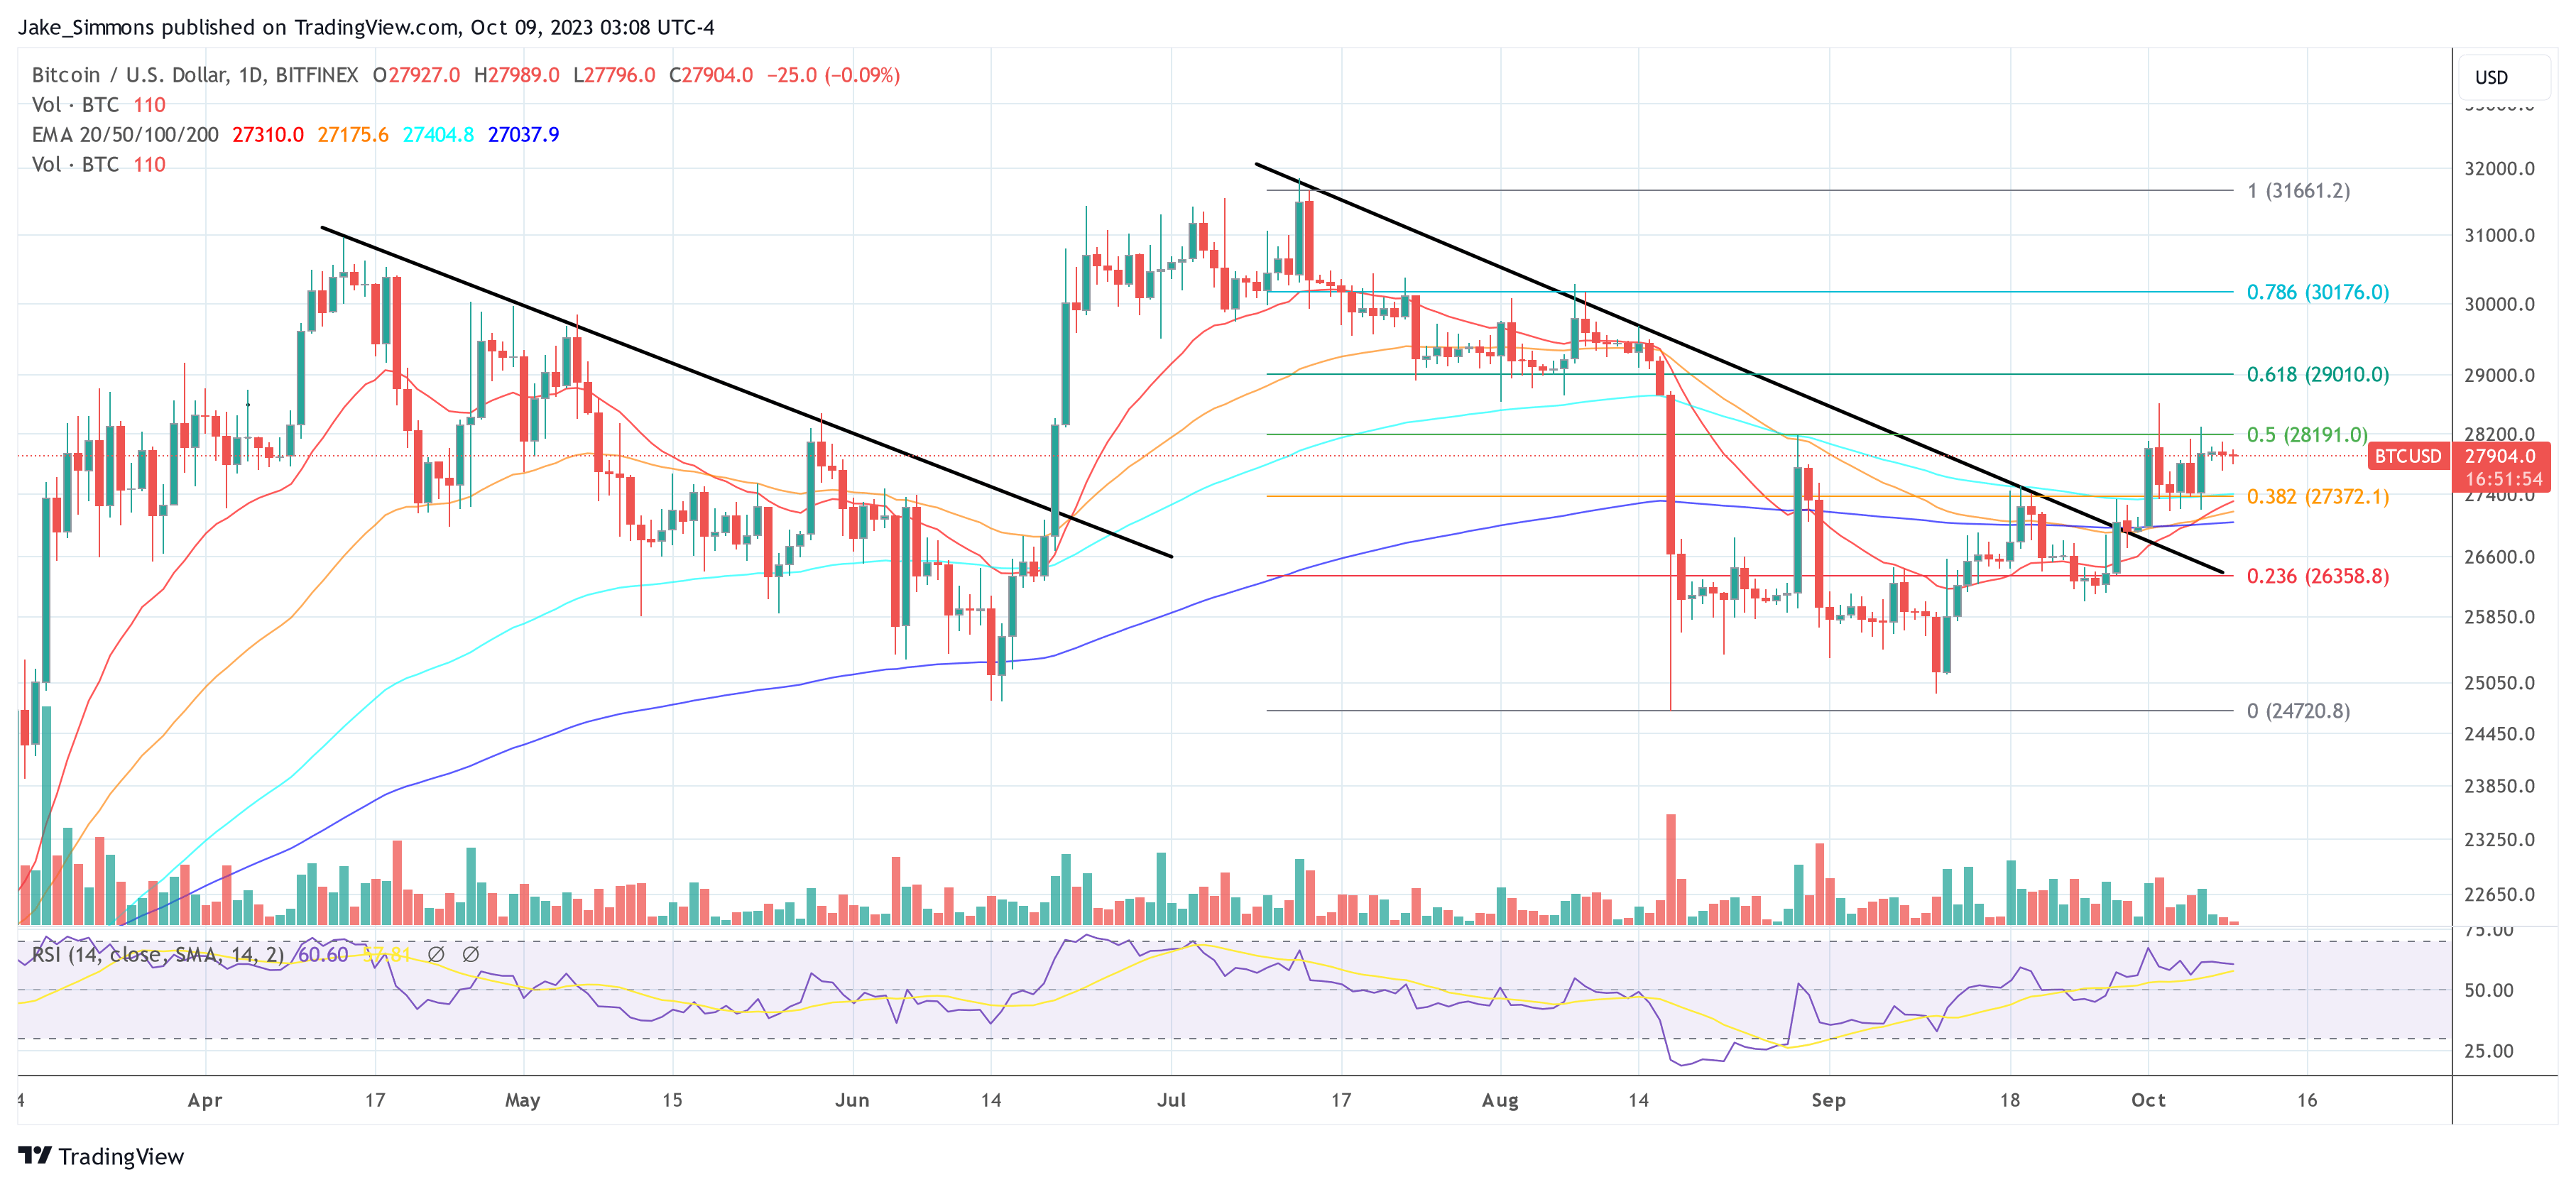
At press time, BTC traded at $27,904.

Bitcoin price

XRP Journey To $0.55: Is A Breakthrough Imminent In The Coming Days?

XRP has been in the spotlight recently as it exhibits intriguing price dynamics. Amidst the turbulent waters of the crypto market, XRP seems to be carving out a path towards a significant upswing. Early last week, it faced yet another pullback from the stubborn resistance level at $0.55, a steadfast battlement that has thwarted crypto buyers repeatedly in the past two months.

The $0.55 resistance level has proven to be a tough barrier for XRP enthusiasts, with four unsuccessful attempts to breach this significant threshold. Each time, rejection candles have punctuated the charts, underscoring the determination of sellers to maintain their defensive stance. 

However, amidst this persistent standoff, there is a glimmer of hope in the form of a steadily ascending support trendline, acting as a protective barrier against deeper price plunges. This intriguing interplay between resistance and support is indicative of the formation of an ascending triangle pattern, a potential sign of bullish continuation.

XRP’s Rejection Candles: The Formation of an Ascending Triangle

An ascending triangle is a technical chart pattern characterized by a rising support trendline and a horizontal resistance level. It suggests that as the price nears the apex of the triangle, buyers could regain their enthusiasm, potentially propelling the coin upwards and maintaining its lateral movement.

Currently, XRP is trading at approximately $0.517198 on CoinGecko, with a minor 24-hour decline of 1.0% and a seven-day loss of 1.2%. These fluctuations are part and parcel of the cryptocurrency market’s inherent volatility, and the formation of the ascending triangle adds an intriguing dimension to XRP’s price action.

In addition to the technical aspects, recent data from an XRP report has revealed a noteworthy surge in XRP’s active addresses. On October 8, active addresses surged to 24,400, a significant increase from the previous day’s figure of just 13,100. This surge indicates that over 10,000 additional users decided to engage with the XRP blockchain, a development that has caught the attention of market observers.

XRP’s Potential Evolution

The surge in active addresses may be linked to RippleX’s recent announcement. On October 6, RippleX, the developer arm of the Ripple network and the XRP Ledger (XRPL), confirmed the successful completion of performance testing for XLS-30 AMM (Automated Market Maker).

The journey of XLS-30 began around July, with the blockchain community proposing to enhance the XRP Ledger by introducing features to facilitate liquidity provision, trading, and automated swaps on XRPL.

For some industry participants, this development signifies that XRPL is evolving into a full-fledged decentralized finance protocol, potentially unlocking new possibilities for XRP and its community. XRP enthusiasts will undoubtedly be watching closely to see how these dynamics unfold.

(This site’s content should not be construed as investment advice. Investing involves risk. When you invest, your capital is subject to risk).

Featured image from 9P Online

Litecoin Price Prediction: LTC Could Retest $60 Before Fresh Surge

Litecoin price is struggling to gain pace above $66.40 against the US Dollar. LTC could revisit the $60 support before the bulls take a strong stand.

  • Litecoin is correcting losses from the $63 support zone against the US Dollar.
  • The price is now trading below $66 and the 100 simple moving average (4 hours).
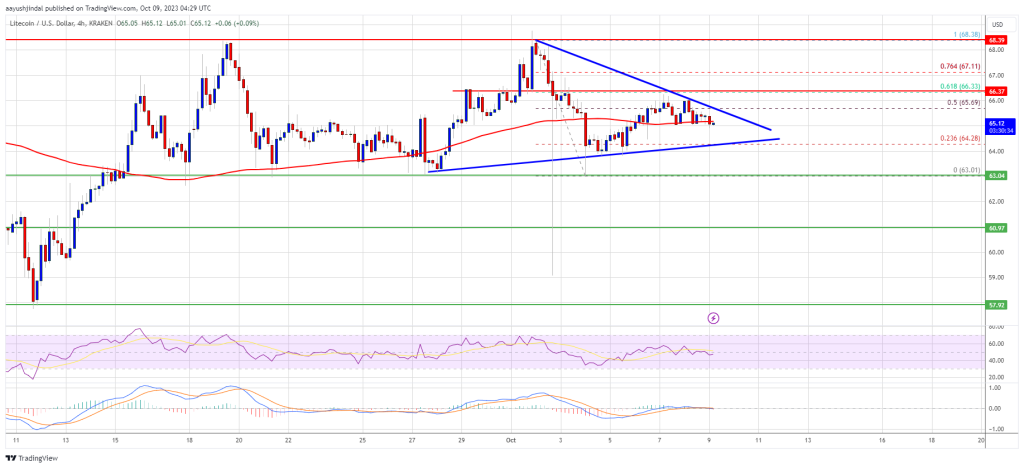
  • There is a key contracting triangle forming with resistance near $65.50 on the 4-hour chart of the LTC/USD pair (data feed from Kraken).
  • The price could drop toward the $60 support before it starts a fresh increase.

Litecoin Price Signals Bearish Move

This past week, there was a fresh decline in Bitcoin, Ethereum, Litecoin, and other altcoins against the US Dollar. LTC price formed a top near $68.40 before it started a fresh decline.

The price traded below the $66.40 and $65.00 support levels. It retested the $63.00 support zone. A low was formed near $63.01 and the price is now attempting a fresh increase. There was a move above the $65.20 resistance.

The price spiked above the 50% Fib retracement level of the downward move from the $68.38 swing high to the $63.01 low. Litecoin is now trading below $66 and the 100 simple moving average (4 hours). There is also a key contracting triangle forming with resistance near $65.50 on the 4-hour chart of the LTC/USD pair.

On the upside, immediate resistance is near the $65.50 zone. The next major resistance is near the $6.40 level. It is close to the 61.8% Fib retracement level of the downward move from the $68.38 swing high to the $63.01 low. If there is a clear break above the $66.40 resistance, the price could start another strong increase.

Litecoin Price Prediction

Source: LTCUSD on TradingView.com

In the stated case, the price is likely to continue higher toward the $68.40 and $70 levels. Any more gains might send LTC’s price toward the $75 resistance zone.

Downside Thrust in LTC?

If Litecoin price fails to clear the $66.40 resistance level, there could be a fresh decline. Initial support on the downside is near the $63.00 level.

The next major support is forming near the $60 level, below which there is a risk of a move toward the $58.00 support. Any further losses may perhaps send the price toward the $55 support.

Technical indicators:

4-hour MACD – The MACD is now losing pace in the bullish zone.

4-hour RSI (Relative Strength Index) – The RSI for LTC/USD is still below the 50 level.

Major Support Levels – $63.00 followed by $60.00.

Major Resistance Levels – $66.40 and $68.40.