
The European Union’s anti-money laundering laws infringe upon personal privacy, and they come with costs that are simply too high.
Cryptocurrency Financial News
The European Union’s anti-money laundering laws infringe upon personal privacy, and they come with costs that are simply too high.
CryptoQuant has revealed in its latest report that the Bitcoin market cap could rise by as much as $1 trillion after launching the spot ETFs.
Yesterday, fake news of the approved iShares Bitcoin spot ETF took the sector by storm, as all cryptocurrencies observed sharp rallies. At the peak of this surge, BTC had approached the $30,000 level.
However, when the market realized the truth about the announcement, the asset quickly retraced to the levels it was at before the rally. While the gains were only brief, the rally nonetheless provided a glimpse into the strong reaction that the market could see to the launch of a real ETF.
This was just one spot ETF; however, several others are waiting in line to be approved. How would the market look like when all these ETFs have launched? In its new report, the on-chain analytics firm CryptoQuant has discussed precisely that.
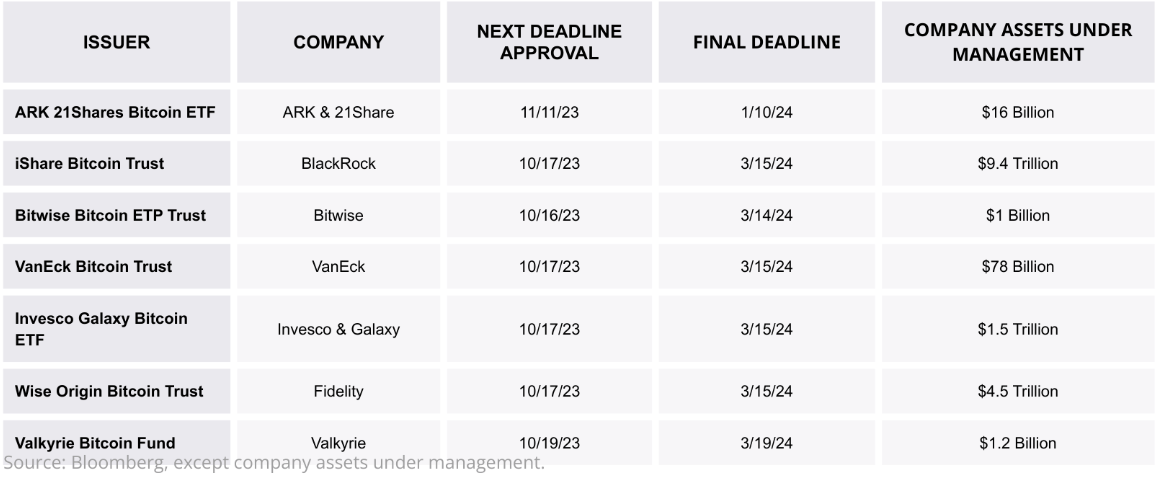
The above table shows information about the various companies waiting to be approved for the Bitcoin spot ETF, including the total size of their assets under management (AUM).
“Although these ETFs are not expected to be approved this year, the probability that they will be approved by the final deadline (March 2024) has been growing as a result of favorable court rulings for Grayscale (GBTC Fund) and XRP in their respective legal fight against the SEC,” says the firm.
In total, these companies’ AUM are around $15.6 trillion. If they put just 1% of this amount towards BTC, it would mean inflows of a whopping $155 billion for the asset. “To put it in context, these amounts represent almost a third of the current market capitalization of Bitcoin,” notes CryptoQuant.
Now, how this capital inflow could affect the market cap of BTC isn’t exactly simple to say. Generally, the market cap increases by more than just the raw capital entering the cryptocurrency.
The firm has used the “realized cap” metric to assess this relationship. The realized cap is a capitalization method for BTC that calculates its total value by assuming that the value of each coin is the same as the price at which it was last transacted on the blockchain.
The realized cap can be imagined as the total investment made by the investors, accounting for the prices at which each bought their coins. The chart below shows how this realized cap has compared with the market over the years.
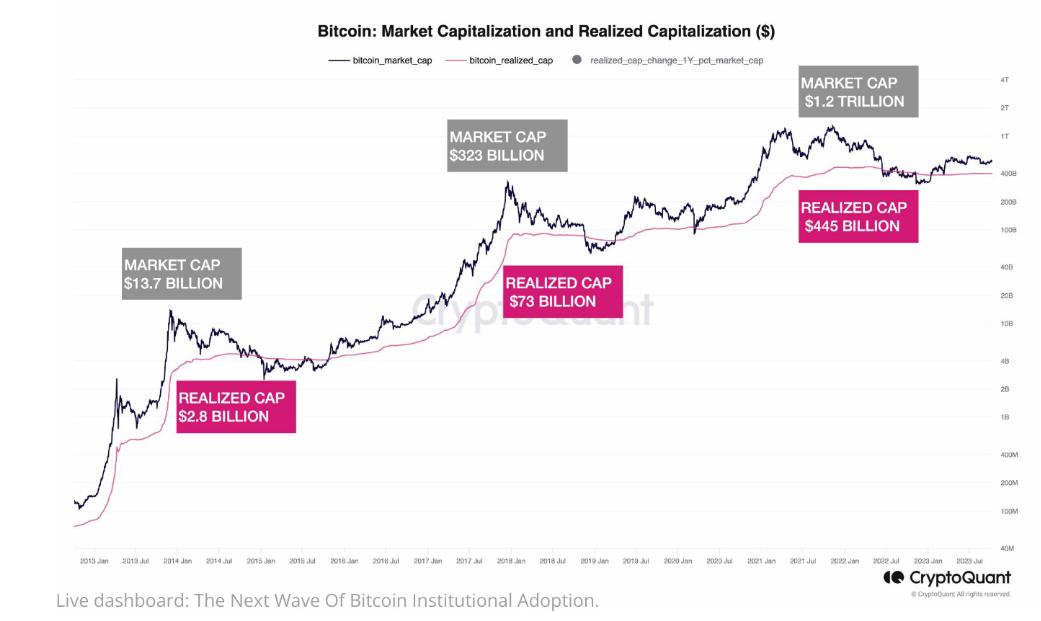
The graph shows that the market cap and realized cap usually have noticeably different growth rates, as they have always followed pretty different paths.
CryptoQuant has calculated the ratio between the annual growths of the two caps and has found that for most of the asset’s history, the market cap has grown by 3 to 6 times faster than the realized cap.
If the realized cap grows by $155 billion when the spot ETFs get approved and the asset managers allot 1% of their AUM to Bitcoin, the market cap could grow by between $450 and $900 billion.
The report notes this figure implies “the market cap would increase between 82% and 165% from the current level and that Bitcoin price could reach between $50K and $73K as a result of these inflows of fresh money.”
Bitcoin has enjoyed some uptrend over the past few days as the asset has now climbed above the $28,500 level.
Congressional inaction, the decline of the Chevron doctrine, and regulation by enforcement are decentralizing policy-making power over emerging technologies like blockchain and AI, says Michele Neitz.
MOON, BRICK and DONUT are each lower by 60%-90%.
Shiba Inu’s ecosystem hasn’t been spared from the crypto market volatility in recent weeks, as the price has been caught in a whirlwind of uncertainty in recent times. While investors are still wondering about the short-term outlook of the crypto, a Shiba Inu whale has gone ahead to move $32.4 million in SHIB tokens into an unknown wallet.
This whale transfer appears to have generated interest from SHIB investors, considering the relatively quiet environment within the Shiba Inu ecosystem. The sheer size of this transaction is notable and worth monitoring, as a selloff could introduce selling pressure and negatively impact SHIB’s price, even if temporary.
However, sometimes whales will move their funds around between wallets for various reasons other than buying and selling. It would seem like this is the case, as an in-depth look into the transactions shows the transfer could’ve been between wallets controlled by the same entity.

— Whale Alert (@whale_alert) October 16, 2023
According to on-chain data, the transaction was made from the address “0xe9bb” into a new private address “0x44a8”. The recipient wallet “0x44a8” now holds a total of over 4.58 trillion SHIB, worth more than $33 million at the time of writing. Address “0xe9bb” had initially received the tokens from “0xA863” before transferring it out to “0x44a8” in less than 10 minutes.
This whale transfer is one of the largest SHIB transactions this month. But while whale movements tend to reveal the current market sentiment, a single transfer cannot necessarily move the entire market, even if there’s a selloff.
As a result, Shiba Inu’s price hasn’t reacted much to the transfer but has lost 0.29% of its market cap in the past 24 hours. Although there’s always a possibility of the whale dumping their entire bag, this trading behavior suggests they intend to keep holding the tokens.
SHIB is currently the second-largest meme cryptocurrency, although the majority of investors are losing money at this point. As reported from data provided by IntoTheBlock, only 9% of holders are making money at the current price.
Nevertheless, the SHIB burn rate saw a spike of 233% since the beginning of the new week as community members remain committed to reducing its available supply.
At the time of writing, Shiba Inu is trading at $0.000007059. Yesterday, the value of the cryptocurrency skyrocketed to 0.000072 as a direct reaction to Bitcoin crossing the $29,000 threshold. However, the meme coin has retraced most of its gains from Monday. It is down 0.61% in the last 24 hours, but seeing 1.97% gains on the weekly chart.
Binance, Coinbase and Ripple are just some of the firms that have tried to apply an ill-defined legal doctrine meant to curb overzealous regulators.

Michelle Bowman told a university audience that financial innovation should be justified by need and be properly regulated.
Bitcoin (BTC) has retraced to the $28,400 level following a failed breakout above $30,000, resulting in a high rate of liquidations for both long and short positions.
Additionally, the recent fake news surrounding the approval of Blackrock’s spot Bitcoin Exchange-Traded Fund (ETF) by the US Securities and Exchange Commission has disrupted the upward trend and introduced new bearish indicators in the Bitcoin market.
Renowned trader and crypto analyst Ali Martinez suggests selling BTC based on its 4-hour chart Relative Strength Index (RSI) indicator. His simple trading strategy advises selling BTC when the RSI exceeds 74.21 and buying when the RSI dips below 30.35.
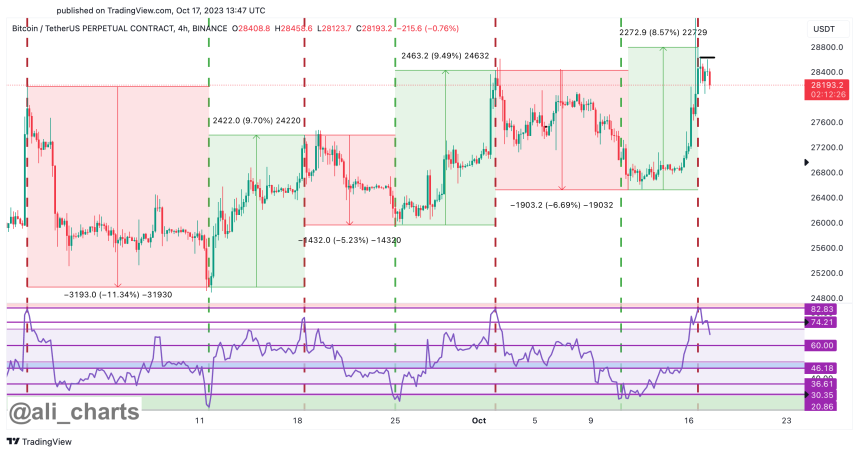
As seen in the chart above, BTC’s RSI stands at the 74 level, which is notably high considering that on October 16, after the spread of the fake news on various platforms, including X (Formerly Twitter), the RSI reached as high as 82.83.
While this indicator may seem straightforward, it has proven effective on BTC’s 4-hour chart. For instance, on October 1st, Bitcoin peaked at $28,500, but after the RSI climbed above 80, the leading cryptocurrency swiftly dropped to $27,150 within hours.
Although the effectiveness of these indicators is not always guaranteed, the combination of the recent false pump, the ongoing retrace evident in all BTC charts, the lack of bullish momentum, and the prevailing market sentiment of fear, doubt, and uncertainty could create the perfect storm for BTC to retest lower support levels before potentially embarking on another upward movement.
To further support Ali Martinez’s bearish thesis, renowned crypto analyst Rekt Capital recently shed light on Bitcoin’s historical retracements approximately 180 days before halving events.
According to Rekt, in 2015/2016, approximately 180 days before the halving, Bitcoin experienced a retracement of -25%. Similarly, in 2019, around the same timeframe before the halving, Bitcoin retraced by -38%.
While Rekt Capital identifies as a macro bull, he acknowledges that historical data favors bearish trends before halving events.
This observation raises the question of whether history will repeat itself in 2023. Will Bitcoin witness a significant retracement similar to previous cycles, or will the market dynamics 2023 deviate from historical patterns?
What is certain is that as the crypto community eagerly anticipates the 2023 halving, uncertainty looms regarding Bitcoin’s price behavior leading up to the event.
As of the current market conditions, BTC is trading at $28,400, indicating a profitable position across all time frames. In the past 24 hours, Bitcoin has experienced a modest increase of 1%.
Over the seven, fourteen, and thirty-day periods, BTC has recorded profits of 3.7%, 4%, and 7%, respectively, despite the earlier bearish factors. The sustainability of Bitcoin’s current price level remains uncertain, as it remains to be seen whether it will withstand potential retracements soon.
Featured image from Shutterstock, chart from TradingView.com

The Chinese megacorporation claims its newest model rivals OpenAI’s popular model in generating text, images, and video.
SUI, the native token of the blockchain that was built by former Meta (META) employees, has tumbled by 5% on Tuesday after the community raised concerns over whether the team had been selling staking rewards on Binance.
Firm calls report by Bloomberg “factually inaccurate and highly misleading.”

Sam Bankman-Fried’s defense team cross-examined former FTX engineering director Nishad Singh following questions from the prosecution on Oct. 16.
Polkadot (DOT) has been grappling with a descending resistance trendline, experiencing a relentless decline since February. In the month of October, the digital asset suffered a 10% drop, plummeting from $4.3 to $3.6.
Market analysts are warning of the potential for further losses should the prevailing bearish pressure persist. However, a slight glimmer of hope emerged as DOT attempted a reversal at $3.6, hinting at the possibility of overcoming the overhead resistance barrier.
At present, the DOT price according to CoinGecko stands at $3.74, depicting a marginal 0.3% decline over the last 24 hours and a 2.8% dip over the span of seven days.
The absence of horizontal support below the current price underscores the significance of Fib retracement levels in forecasting potential bottoming areas. Notably, a Fibonacci retracement tool was utilized, encompassing the lower high of $4.8 on August 29 and the recent dip of $3.6 on October 12. This analysis highlighted that the path to recovery for DOT faces significant obstacles at the 23.6% Fib ($3.9) and the 38.2% Fib ($4).
Complicating matters further, the $4 level, serving as the second resistance target, coincides with a daily bearish order block (OB). This confluence suggests that crossing the $3.9 threshold could prove challenging for bullish momentum.
Despite the persistent price downturn, the developers within the Polkadot ecosystem remain resolute and undeterred. This unwavering commitment is evident from the substantial Polkadot active developers, which are currently hovering close to an all-time high. This figure notably exceeds the levels recorded in 2021 when the altcoin’s price reached its peak.
In a recent announcement, Parity Technologies, a significant player in blockchain infrastructure, revealed its strategic shift towards decentralization within the Polkadot (DOT) ecosystem. The forthcoming organizational changes are anticipated to mark a new chapter for the company in the months to come.
Polkadot’s Cutting-Edge Technology Advancement
Amidst circulating rumors, Parity Technologies promptly dispelled speculations about a massive layoff of approximately 300 employees during a recent off-site gathering in Mallorca. The company emphasized that any adjustments to the workforce will be gradual and in alignment with its progressive decentralized strategy.
Emphasizing their dedication, Parity underscored their commitment to driving the advancement of Polkadot’s cutting-edge technology. Their key focus remains on enhancing the developer experience and fostering a resilient developer community within the Polkadot ecosystem, ensuring its sustained growth and innovation.
(This site’s content should not be construed as investment advice. Investing involves risk. When you invest, your capital is subject to risk).
Featured image from Mudrex
The finalized rules, set to be published in the EU’s official journal, force crypto firms to report on customers’ holdings to be shared between tax authorities.
The market for tokenized real-world assets could grow to $10 billion by 2030 as crypto is maturing and increasingly integrates with existing financial plumbing, crypto asset management firm 21.co said in a report.

As per its agreement, project developers will not pursue legal action against the hacker.
Rumors about spot bitcoin ETF approvals aside, Fink called the recent rally a “flight to quality.”.
The foundation wallets of the Fantom blockchain have been drained on both Ethereum and Fantom, according to blockchain security analyst Certik.
Governor Michelle Bowman suggests other payments services, including FedNow, may do a CBDC’s job better, and she’s also suspicious of the dangers of stablecoins.
The Ripple Initial Public Offering (IPO) rumors continue to wax stronger as many expect that the event will push the XRP price upward. Back then, it was mostly just rumors and speculation, but the XRP community has gotten their hands on a Ripple job listing that suggests there might be some truth to the IPO rumors.
In a listing that was shared by multiple influencers in the XRP community, Ripple looks to be on the hunt for a Shareholder Communications Senior Manager. Now, according to the job listing requirements, whoever is accepted for this role will be expected to basically work with multiple teams at Ripple and maintain communications between ‘prospective shareholders and investors.’
Also, the individual will be “managing a shareholder database/mailing list and investor/analyst communication database.” Given this description, many in the community have taken it as a sign that Ripple is hiring in preparation for a potential IPO.


Some of the job descriptions also coincide with things and events that tend to take place in companies that have undergone the IPO process. One example pointed out in this Bitcoinist report is the Annual Analyst Day expected to the carried out by the Shareholder Communications Senior Manager. This is an event that is done by publicly traded companies.
The expectations of a Ripple IPO go as far back as 2020 when its Chief Executive Officer (CEO) Brad Garlinghouse first talked about initial public offerings in crypto. Back then, Garlinghouse had said that “you’ll see initial public offerings in the crypto/blockchain space” in the next 12 months. He wasn’t far off as Coinbase would become the first crypto exchange to go public the next year on April 14, 2021.
The impact of a potential Ripple IPO on the XRP price has been discussed at length, especially in the second half of this year. One of the very first mentions of this was by financial expert Linda Jones who talked at length about how valuable Ripple would be if there were an IPO.
Using the XRP market cap, Jones explained that at $35 a share, Ripple would be valued at $5.7 billion which is much lower than XRP’s $21 billion valuation. So the financial expert explained that Ripple’s valuation would be a lot higher. Eventually, she arrived at a $107 billion valuation which would mean Ripple stock would trade at a price of $600. Using XRP’s correlation to Ripple’s development, this could easily see the XRP price surge above $100.
Crypto influencer Ben Armstrong aka BitBoy also shared his thoughts on what would happen to the XRP price in the event of an IPO. The influencer said back in July that he expects the XRP price to reach as high as $35 if Ripple were to undergo such a situation.
While there is no confirmation from Ripple on this news, the consensus remains that such a move would be bullish for the XRP price.


