
Daniel Shin claimed he and Do Kwon parted ways before the collapse of the Terra/Luna ecosystem was imminent and he had nothing to do with it.
Cryptocurrency Financial News
Daniel Shin claimed he and Do Kwon parted ways before the collapse of the Terra/Luna ecosystem was imminent and he had nothing to do with it.
The foundation, formed in November 2022 after the initial developer StarkWare minted 10 billion STRK tokens, is now awarding early contributors to the Ethereum layer-2 network – even though they’re locked for trading at least until next April.
The Republic of the Marshall Islands has passed legislation that takes its already advanced law for decentralized autonomous organizations (DAOs) a step further.
A solo Bitcoin miner has struck gold after successfully claiming a $200,000 block reward. The considerable achievement has captured the attention of fellow miners and crypto enthusiasts, highlighting the potential for lone miners to effectively compete with larger mining operations
On October 28, a software engineer of Bitcoin CGMiner and an admin of Solo Ckpool, Dr. Con Kolivas congratulated a lone Bitcoin miner in an X (formerly Twitter) post for accomplishing a rare milestone by solving the 278th solo block at Solo Ckpool.
The lucky miner used 11 PH/s of hash power to discover block 814,308 and claimed a $200,000 (6.25 BTC) block reward.
“Congratulations to miner 3KCykmdpBpNKTtZJAvp3u2N2EQjGzbUF7c with ~11PH for solving the 278th solo block on solo.ckpool,” Dr. Kolivas stated.
Presently, large-scale mining operations and pools are dominating the Bitcoin mining industry. When blocks are discovered, these mining companies often share the rewards. In contrast, mining pools like Solo Ckpool offer lone miners a higher level of independence allowing them to earn almost all rewards when they discover a block.
This recent solo mining achievement has not been the only accomplishment this year. In August, a solo Bitcoin miner solved block 803,821, claiming 6.25 BTC worth $160,000. Multiple solo miners have also discovered substantial blocks and reaped significant rewards in the last few months.
The lure of solo mining pools is growing as many miners are looking to increase their chances of earning large rewards while reclaiming a sense of independence in the competitive Bitcoin mining market.
Bitcoin Hashrate has continued to increase following the recent surge in the value of BTC. Earlier on October 12, the hash rate saw an alarming increase to 456 exahash per second (EH/s). Following this increase, the hash rate stabilized slightly dropping down to 443 EH/s sometime on October 28.
Despite the increased level of mining difficulties, hash rates are rising. Bitcoin hash rate is slightly back up today to 452.63 EH/s with an estimated difficulty adjustment of 12.78% and network difficulty of 62.46T. The average block time for mining is also approximately 8 minutes and 52 seconds.
In the past month, mining hash prices fell to significant lows, depicting the possibility of chain validators experiencing higher mining difficulties and pressure. Now, hash rates are on the rise and Bitcoin miners are taking advantage of these opportunities to increase their earnings.

Bitcoin’s reluctance to give up ground has attracted strong buying in select altcoins.
The XRP price continues to enjoy positive performance as the crypto market trends to the upside. The current rally confluences with the sector’s historical performance; thus, cryptocurrencies could extend their bullish trend.
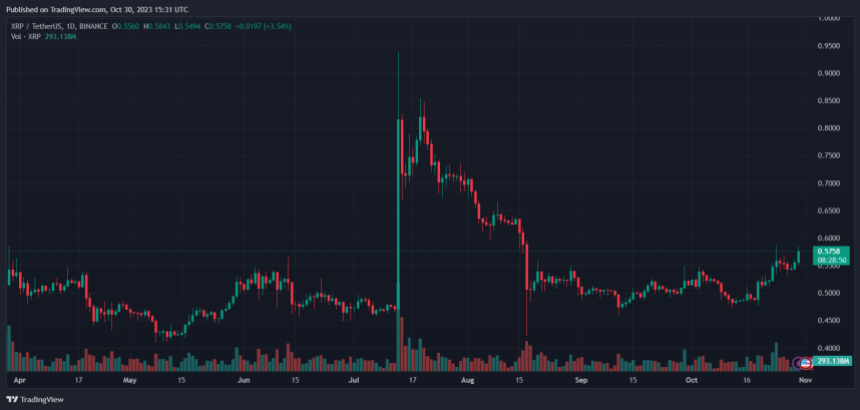
As of this writing, the XRP price trades at $0.58 with a 5% profit in the last 24 hours. In the previous seven days, the cryptocurrency recorded an 11% rally and stood as one of the best performers in the sector over the same period, along with Solana (SOL) and Cardano (ADA).
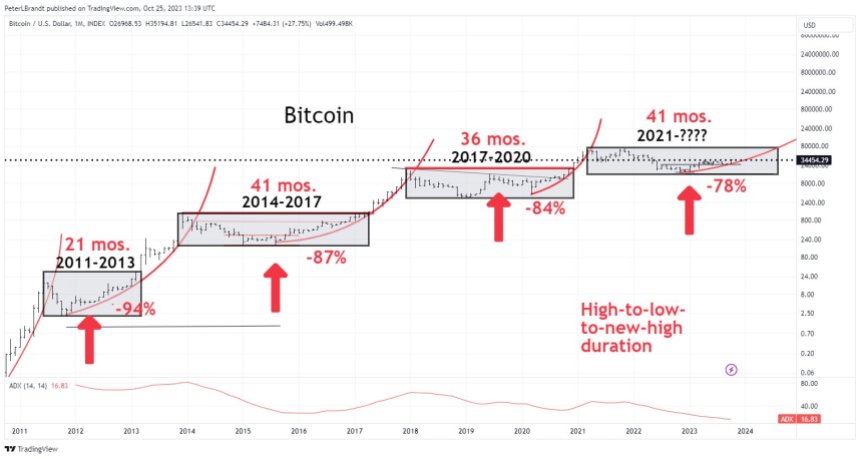
As XRP and other trend upwards, legendary trader Peter Brandt share his positive views on the nascent sector. Brandt has been known for expressing his views on BTC and crypto without reservations, and this time, the forecast is bullish.
On social media platform X, the legendary trader dismissed market actors trying to predict future performance. However, Brandt dared to make three predictions regarding Bitcoin: first, the cryptocurrency is likely to hit bottom, which will lead it to new all-time highs, as seen in the chart below.
This bullish price action is based on the cryptocurrency’s historical performance. Each time the BTC market drops around 78%, Bitcoin bottoms and re-enters price discovery. The XRP price, Ethereum, and other altcoins follow the trend.
In 2017, when BTC went into a bull run, the XRP price reached an all-time high above $3. If history repeats, and based on the fundamentals supporting XRP’s bullish momentum, the token could hit a similar level.
The optimistic forecast in the traditional financial market supports this scenario. If stocks and Bitcoin see further profits, everything will align for XRP and other altcoins to hit their previous all-time highs.
In short timeframes, a pseudonym analyst indicated that XRP formed a bull flag pattern. This bullish market structure hints at a potential run of the high area around $0.66. However, bulls must maintain the token above $0.52 and $0.54 to prevent a run of the lows.
The analyst stated the following about XRP and how close it is to completing a significant milestone for further profits:
The first break has just arrived. XRP close to the Mid resistance at $0.5557. Still, the following applies: Bull flag $0.5557 above, to be precise. Invalidation $0.54 below.
Cover image from Unsplash, chart from Tradingview
With Bitcoin ETFs round the corner, financial institutions are gearing up to promote BTC investing. The message is likely to obscure Bitcoin’s origins but could be useful for native-crypto companies, argue Dave Birnbaum and David Waugh, from Coinbits.

Annual subscription fees for Etherscan’s EaaS service has reportedly grown to $2 million per year.

The Wall Street Journal corrected its misreporting about crypto funding Hamas, but it was too late to stop lawmakers from amplifying false claims.
Crypto analyst Crypto Insight recently predicted that the price of XRP could be preparing to go past the $1 mark in just 16 days as the XRP’s Relative Strength Index (RSI) and open interest continue to gain momentum indicating a bullish trend.
On Sunday, October 29, the crypto analyst shared his predictions on X (formerly Twitter) highlighting that XRP might be prepared for a significant upward trajectory due to the strength of the XRP’s weekly RSI, as it gains traction toward entering a bullish zone.
Related Reading: XRP Price To Go Parabolic, Here’s When
This is because the momentum of an asset’s price movement is measured by the Relative Strength Index (RSI). There are two indicator feature lines in the RSI chart and these include the RSI line (purple) and the RSI-Based MA line (yellow).
In the RSI chart, an indication of rising momentum and a bullish cross is produced whenever the RSI line crosses above the RSI-based MA line; as seen in the XRP weekly chart posted by Crypto Insight on X.
XRP experienced the cross for the first time in the first week of July, and after this happened, the cryptocurrency experienced a great surge in price by July 13, which led to XRP’s yearly high of $0.93. However, during the correction that followed, the RSI line fell below the RSI-based MA line.
According to crypto insight, the line is once again attempting to traverse above the RSI-based MA line as of the time of his discovery, and the crossing has been realized. As of the time of his revelation, the RSI line was sitting at 53.91, while the RSI-based MA line was sitting at 51.01 presenting a bullish sign.
The crypto analyst further shed more light on the timing for these potential developments. Crypto Insight speculated that XRP might be touching a resistance level as of the time of his disclosure, and the resistance level could be a vital point for XRP price movement.
He also added that a bullish cross for the RSI could buttress both bulls and punters to engage in the market and stake their bets. Notably, this surge in trading activity could provide XRP with the force it needs to swiftly break out into the target range.
Related Reading: XRP Price Could Blast Off In 18 Days, Here’s Why
So far, the target range that was set up by the crypto analyst in his chart was between $0.8875 to $1.3617. He believes that XRP could hit this price range in the next 16 days since the rally in July, saw the XRP price almost claiming the $1 mark, but failed due to the significant resistance it faced.
The crypto analyst also pointed out the XRP’s open interest in his projections. He highlighted that open interest has room to rise significantly, and it seems to be developing higher highs.
Open Interest is the overall number of pending futures contracts for a particular cryptocurrency. Therefore, an increase in open interest can indicate growing market participation and keenness among investors, and it can also lead to increased liquidity and potentially trigger a price rally for a cryptocurrency.

The disgraced crypto executive frequently praised the need for crypto regulation in public.
Terraform Labs and its co-founder, Do Kwon, are asking a federal judge to side with them in the U.S. Securities and Exchange Commission (SEC) fraud case, arguing that the regulator hasn’t managed to prove the crypto company was offering securities.

Bitcoin options market positioning and BTC’s daily chart suggest another bull move could be in the making.

Voltage Park will lease access to 24,000 clustered NVIDIA GPUs by the hour or month to help small startups and researchers model machine learning.

A small island nation in the Atlantic Ocean grapples with a cash economy influenced by tourism, remittances and limited resources. Can Bitcoin help?
Ether-based funds continue to fall out of favor, with outflows for the year now totaling $125 million.
The latest proof of reserves shows that the exchange is 103% collateralized with bitcoin, ether, and USDT.
When Bitcoin price action is sideways and directionless for the better part of a year, bulls and bears argue over which direction will be ultimately chosen.
However, considering macro conditions like rising interest rates, a sinking stock market, and mounting ting debt, bears aren’t ready to throw in the towel. But they might want to after seeing this chart.
Bitcoin and other cryptocurrencies are normally notoriously volatile. But volatility has dwindled to next to nothing since the FTX collapse struck.
Few have been willing to take the risk on BTC and altcoins while macro conditions are this on the edge of collapse. It resulted in a big move off the bottom, but also more than six months of consolidation and confusion.
But after several months of sideways price action, Bitcoin appears to have chosen a direction and broke out to form a new trend. Bears, however, remain stubbornly short per market sentiment.
Bearish traders might want to reconsider their positioning after taking a look at the Directional Movement Index.
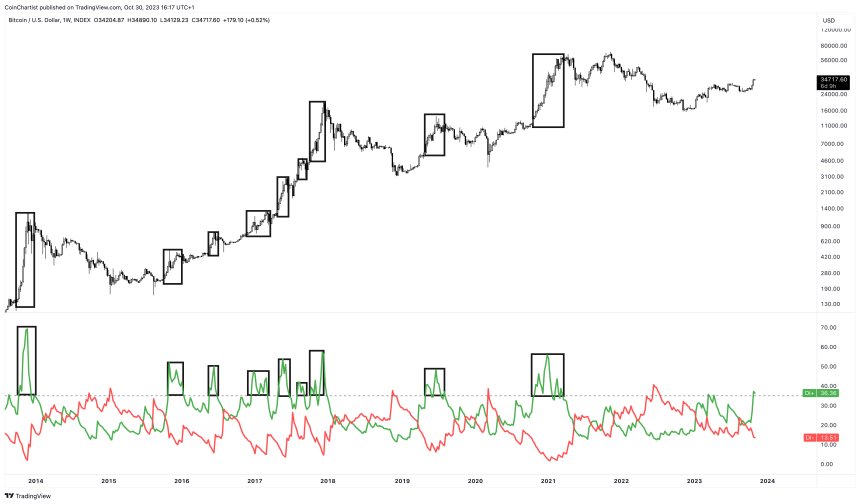
The Directional Movement Index is typically found bundled with the Average Directional Index, and consists of a negative and a positive directional indicator. The tool’s premise is simple: when DI+ (green) is above DI- (red) the asset is bullish and DI- is above DI+ when bearish.
This technical analysis indicator is currently showing the DI+ soaring, while the DI- is falling and below the 20 line. The 20 line is notable more for the ADX, which isn’t pictured. When the ADX rises above 20, the tool suggests a trend is active and strengthening.
Bitcoin isn’t above 20 on the weekly yet, but has begun to do so on lower timeframes. With how strong the recent move was, the ADX could confirm above 20 over the next week or two. At that point, bears might finally be forced to concede that a new bull trend has blossomed.
Hackers siphoned a total of $4.4 million in crypto from at least 25 LastPass users on Oct. 25, according to blockchain analyst ZachXBT.


