The latest price moves in bitcoin (BTC) and crypto markets in context for Oct. 18, 2023. First Mover is CoinDesk’s daily newsletter that contextualizes the latest actions in the crypto markets.
Bitcoin metrics ‘improve bullish odds’ as BTC price holds 200-week trendline

BTC price gains are not guaranteed as a result, but promising on-chain signals show “good things are happening” for Bitcoin bulls, analysis says.
Will Cardano Slide To $0.20? What Awaits ADA Investors This Week
Cardano (ADA) investors are currently grappling with a critical juncture as the cryptocurrency struggles to maintain its positive momentum within a triangle pattern.
Priced at $0.246925 according to CoinGecko, the ADA market is currently navigating through a complex landscape of potential pitfalls and prospects.
Despite a 1.3% decline in the last 24 hours and a measly 0.1% dip over the past week, the market sentiment remains cautious, with traders closely monitoring the possibility of a downturn to $0.20.
At the heart of the current ADA price conundrum lies the intricate triangle pattern, a technical formation that often signifies a period of market indecision and potential trend reversal.
Within this pattern, the coin’s price movements are constrained between a converging support trendline and a resistance trendline.
The ongoing struggle to sustain a positive cycle hints at a potential bullish breakout. However, the looming threat of a significant plunge to $0.20 keeps many traders at the edge of their seats, anxiously observing the market dynamics.
Benjamin Cowen’s Stark Warning
Adding to the air of caution, renowned crypto analyst Benjamin Cowen has sounded an alarm for ADA investors, issuing a grave warning regarding the cryptocurrency’s trajectory.
In a recent tweet, Cowen highlighted ADA’s declining value in terms of Bitcoin (BTC), predicting a potential drop to as low as 400 satoshis.
#ADA / #BTC is breaking down, probably headed to 400 sats pic.twitter.com/ZwYZ0dxS4h
— Benjamin Cowen (@intocryptoverse) October 16, 2023
Cowen’s warning stems from an in-depth analysis of ADA’s price chart, which revealed a troubling trend that has sent ripples of concern across the market.
According to Cowen’s analysis, Cardano experienced a critical breakthrough of a key trendline, triggering a phase of accumulation before entering a subsequent downtrend.
Despite a brief consolidation phase, ADA’s gradual departure from this period led to the erosion of vital support levels.
Currently valued at 890 satoshis per ADA, Cowen anticipates a staggering 50% drop from its present level, urging investors to tread cautiously in the volatile ADA market.
Cardano Struggle With Resistance And Support Levels
Underlying ADA’s price turmoil is the persistent battle between resistance and support levels. The crucial support at $0.24 has provided a temporary foothold for the cryptocurrency, preventing a more precipitous decline.
However, multiple lower-high formations resulting from overhead bearish pressure have cast a shadow over ADA’s short-term prospects, creating a challenging environment for sustained bullish momentum.
Despite these obstacles, ADA’s price action continues to reflect a tenacious effort to resist the downward pressure and retain a foothold within the symmetrical triangle.
Yet, the looming threat of a potential downtrend breaking below the support trendline remains a tangible concern for traders and investors alike.
As the crypto community awaits further developments, the fate of Cardano’s price trajectory hangs delicately in the balance, with investors bracing for potential fluctuations in the days ahead.
(This site’s content should not be construed as investment advice. Investing involves risk. When you invest, your capital is subject to risk).
Featured image from Wallpaper Flare
Korean Giant SK Telecom Releases Crypto Wallet With CryptoQuant as Partner
The wallet will feature on-chain data analysis tools that may inform users’ market decisions.
Bitcoin Dominance Rises: Why Altcoin Buying May Need A Break
In a recent trend evident on crypto charts, Bitcoin dominance is once again on the rise, prompting some traders and investors to rethink their strategies concerning altcoins. An in-depth analysis of the data, coupled with insights from prominent crypto analysts, unveils several compelling reasons to exercise caution when considering an altcoin purchase at this moment.
Historical Precedence
Bitcoin’s market dominance – its market cap relative to the entire cryptocurrency market – has historically been a leading indicator of market sentiment. If Bitcoin dominance is increasing, it means that sentiment toward altcoins is waning.
In an analysis today, renowned analyst Rekt Capital has warned of this flashing signal, he shared the following chart and tweeted:
BTC Dominance has left the “retest zone”. Now in the process of entering an uptrend continuation which could see BTC Dominance revisit the 58% mark for the first time in years.
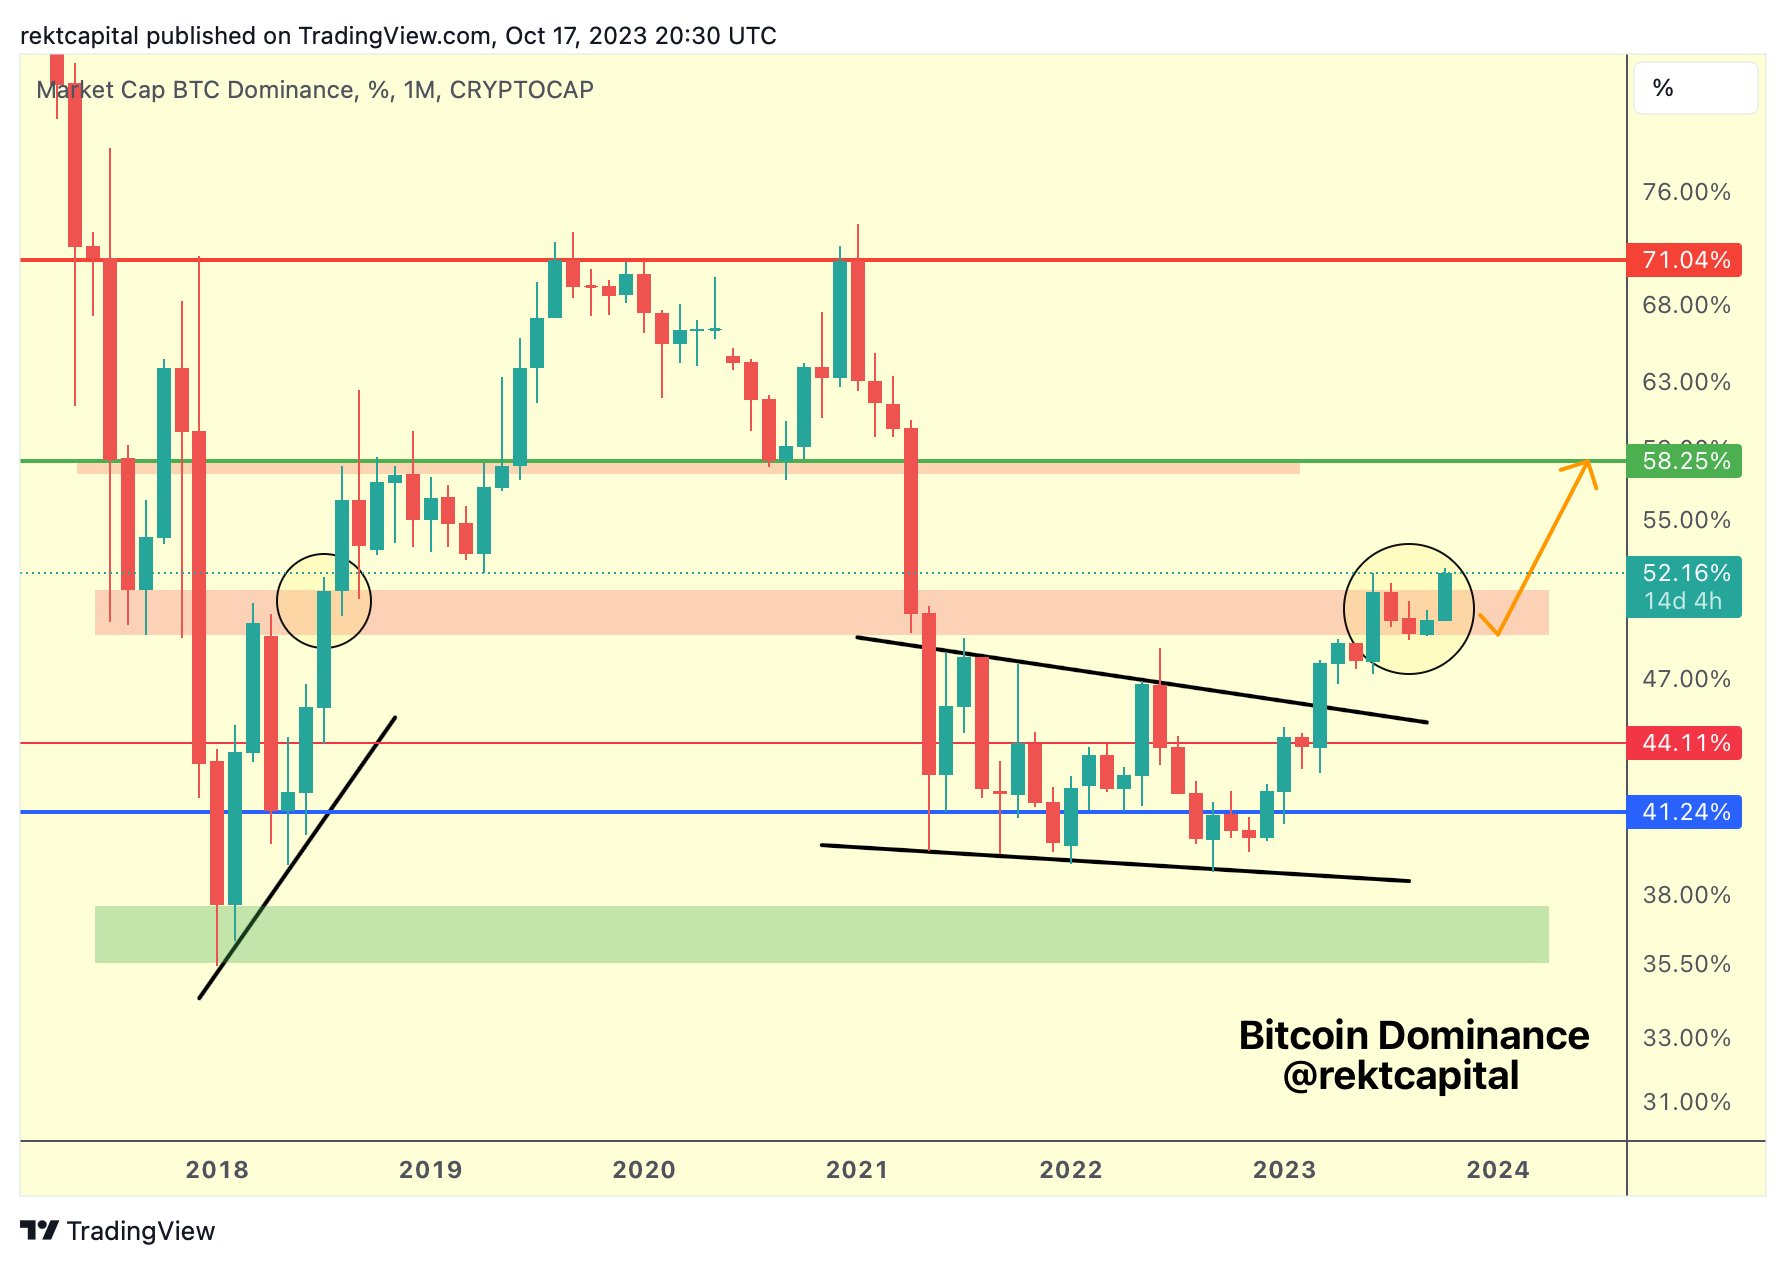
Over the past five months, the Bitcoin dominance saw a consolidation within the ‘retest zone’ after it saw a 10%+ rise since the beginning of the year. BTC dominance pulled back as part of its retest which enabled altcoins to gain some momentum for a short period of time. But, like in mid-2018, BTC is now breaking above the resistance zone, suggesting that 58% could be the next target. Notably, BTC dominance peaked above 71% during the last run in 2021.
Altcoin Liquidity Concerns
When Bitcoin’s dominance rises, it often corresponds to reduced liquidity in the altcoin market. Reduced liquidity can lead to heightened volatility, with price swings potentially wiping out significant portions of invested capital. For investors with a risk-averse profile, such conditions might not be ideal.
Moreover, recent interest appears to be concentrated primarily on Bitcoin. In times of capitulation and boredom, investors often seek the security and liquidity provided by Bitcoin over altcoins. A driving factor for this is that potential catalysts for the crypto market are Bitcoin-specific, like the halving and the potential approval of a spot ETF. As these events play out, Bitcoin will probably continue to outshine altcoins.
More Insights From Top Crypto Analysts
Joshua Lim, the former head of derivatives at Genesis Trading and former head of trading strategy at Galaxy Digital, recently weighed in on the ongoing tussle between Bitcoin and Ethereum. “ETH/BTC spot ratio is a major battleground right now,” Lim noted, adding that the rally in BTC/USD was effectively suppressing Ethereum. He highlighted a significant skew in options volume favoring Bitcoin over Ethereum, emphasizing Ethereum’s diminishing allocator interest (options volume skewed 5:1 towards BTC).
Meanwhile, Miles Deutscher, a well-regarded crypto analyst, offered a condensed perspective on the prevailing market sentiment. “We’re in the most difficult market phase… where time capitulation really starts to set in,” Deutscher remarked. He further cautioned retail participants who have been distancing themselves from the market, suggesting that this might be an inopportune moment to do so.
Deutscher added, “Accept that BTC is likely to lead in the early stages of the bull run… it’s not wise to fade BTC during this period.” He recommended a “top-down approach to the market,” emphasizing a strategy that starts with the foundational assets, Bitcoin and Ethereum, before exploring other altcoins.
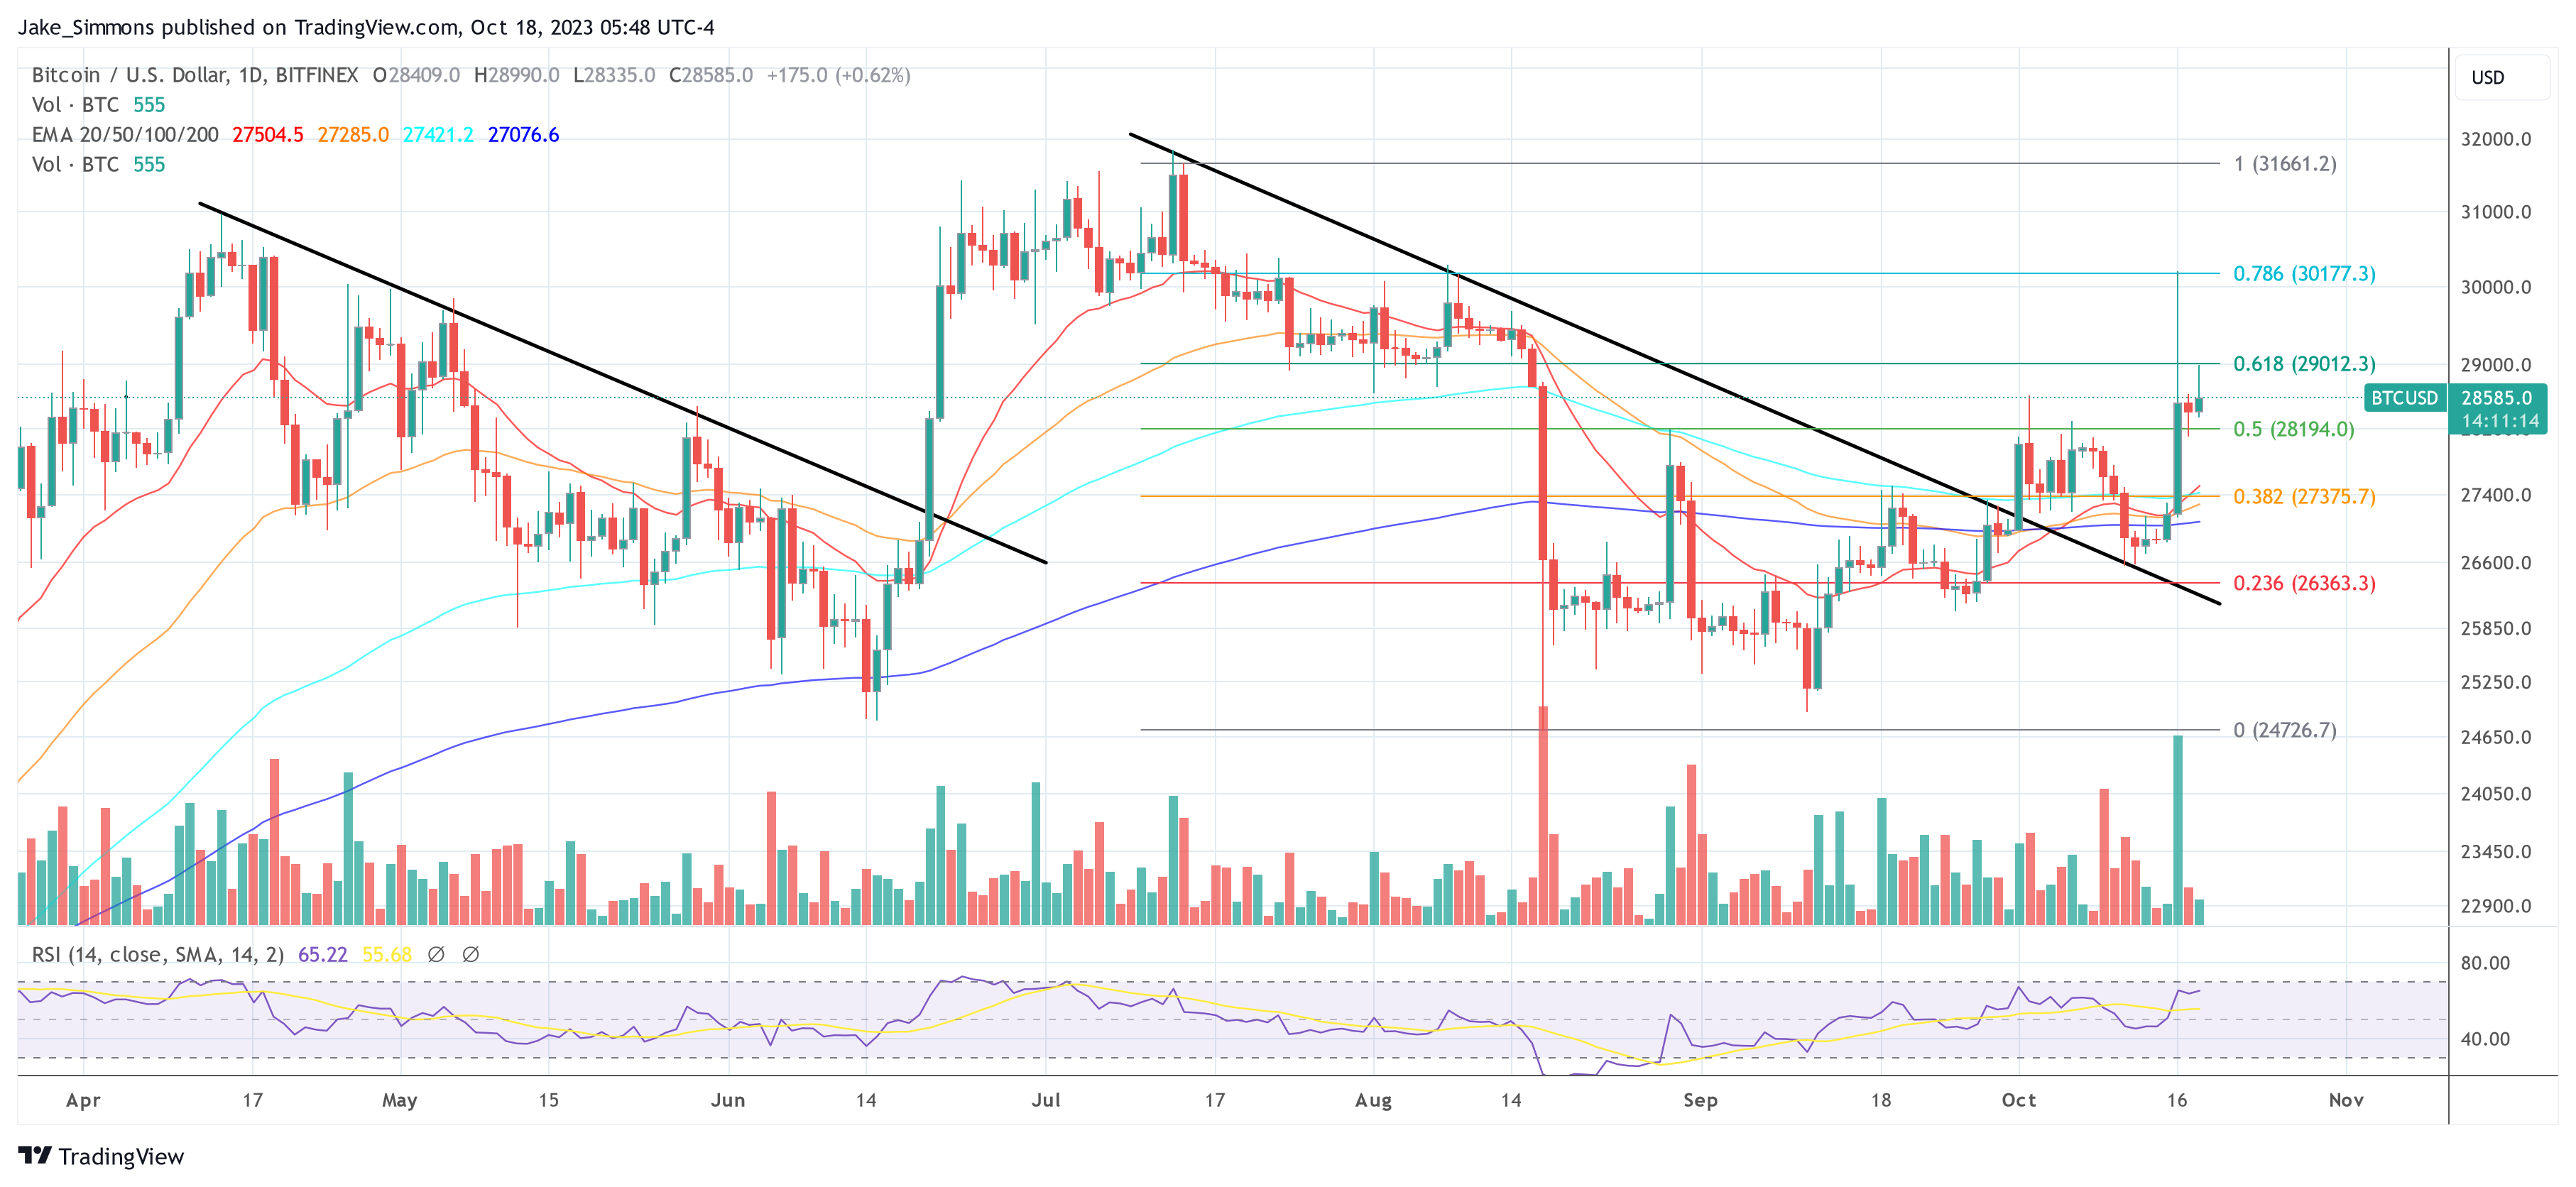
At press time, BTC traded at $28,585.
EU Privacy Watchdog Takes Aim at ‘Excessive Centralization’ of Digital Euro
The central bank digital currency has met significant opposition from lawmakers worried over excessive state snooping
Real Reason Behind Ethereum Founder’s Massive ETH ‘Sales’ Exposed
A crypto wallet owned by the Ethereum founder Vitalik Buterin has seen a series of transactional activities lately, piquing the interest of crypto community members at a time when Ethereum selling pressures are rising.
Following this, Buterin has taken the initiative to address the concerns regarding his recent transfer of digital assets to multiple exchanges.
Ethereum Co-Founder Discloses Truth Behind Multi-Transfers
In a recent post on Warp Cast, a decentralized social network, Russian-Canadian computer programmer and founder of Ethereum, Vitalik Buterin publicized the real reason behind the latest ETH transfers made via his wallet address.
Buterin explained to the public that the large-scale ETH transactions that were performed using his wallet were not sold by him. He stated that over the years, he has mostly focused on donating large sums of Ethereum funds to charity organizations and other projects. He further solidified his claims saying that he had not sold ETH for personal profits since 2018.
“If you see an article saying ‘Vitalik sends XXX ETH to [exchange]’, it’s not actually me selling, it’s almost always me donating to some charity or nonprofit or other projects, and the recipient selling because, well, they have to cover expenses,” Buterin stated.
Buterin is well-known for his philanthropic acts toward charity organizations and medical interventions. The Ethereum co-founder made headlines in 2021, after donating $1 billion worth of SHIB tokens to a COVID-19 relief fund in India.
Additionally, in February 2023, Buterin donated $150,000 to Anka Relief to fund a crypto aid project that would support Türkiye after its recent earthquake experiences.
Although there have been many proofs of Buterin’s propensity to donate to multiple charities, the crypto community has remained skeptical and vigilant, relentlessly monitoring the Ethereum founder’s cryptocurrency activities, as well as these recent high-value ETH transactions.
Spokesperson Reveals $15 Million ETH Transfer From Kanro Charity
According to data from PeckShield Alert, a blockchain security and auditing firm, Vitalik Buterin recently made a large-scale transaction of $15 million USDC to the Gemini Exchange.
This transaction in question is among the list of recent transfers associated with the Ethereum founder. These movements have prompted both curiosity and concern in the crypto community, as observers attempt to determine the underlying motive behind Buterin’s transactions.
A report from Cointelegraph said an Ethereum Foundation Spokesperson has clarified the details behind the lofty transaction. According to the Spokesperson, the $15 million USDC transfer was only executed under Buterin’s Ethereum Name Service (ENS) and not from his wallet address.
The spokesperson also supposedly confirmed that the funds were from a transfer made by a charity multi-sig wallet, Kanro, which is closely linked to Buterin to sponsor a grant.
(One Part of) SBF’s Defense Strategy Starts Paying Off
All three of Sam Bankman-Fried’s “inner circle” members have now testified against the FTX founder, and all three have presented similarly on the witness stand: clearly rehearsed, adamant that the FTX founder was in charge and careful not to stray too far from their well-practiced narratives. They were confident when responding to prosecutors, but were less polished when confronted by the defense.
Middle East regulatory clarity drives crypto industry growth — Binance FZE head

The UAE, Dubai and Bahrain continue to attract major cryptocurrency exchanges and businesses due to their progressive regulatory approaches.
IMF director urges ‘financial inclusion’ via digitalization

IMF managing director Kristalina Georgieva says digitalization is “the most important way” to scale up financial inclusion.
Council of Europe adopts DAC8 crypto tax reporting rule

The eighth iteration of the Directive on Administrative Cooperation was formally adopted by the Council of the European Union
Bitcoin Nears $29K as Fidelity ETF Amendment Bumps Bullish Sentiment
Some analysts said the amendments show the U.S. Securities and Exchange Commission (SEC) is holding active discussions with related parties.
UK to target potential AI threats at planned November summit

The summit scheduled for Nov. 1–2 will place significant emphasis on the potential existential threat that AI represents, a concern shared by several legislators.
Bitcoin SV Climbs 22% – A Close Look At The Factors Behind The Surge
Despite seeing a notable increase of 15.2% in value yesterday, the current price of Bitcoin SV remains steady at a little over $39 compared to the previous day.
The current market situation involves a struggle with the immediate dynamic resistance level, leading to a state of uneasiness among traders.
Bitcoin SV, a Bitcoin fork, is now the most profitable cryptocurrency out of the top 100 by market capitalization.
The value of the world’s cryptocurrency market increased to $1.09 trillion at the time of writing, a 1.4% gain in a day. On Tuesday, ETH increased by about 0.1% to $1,585, while BTC was up 2.6% at $28,466.60.
SEC Influence On Crypto Rally And BSV Price Spike
The recent rally in cryptocurrency prices was primarily driven by optimism about the Securities and Exchange Commission (SEC) potentially approving a Bitcoin ETF. This sentiment was strengthened when the SEC chose not to appeal the Grayscale lawsuit.
However, there was a spike in BSV prices due to a false report from CoinTelegraph claiming that the SEC was anticipating the iShares Bitcoin Trust, pushing Bitcoin to nearly $30,000 before it quickly dropped.
At the time of writing, BSV occupies the No. 48 spot and was trading at $39.40, up 22% in the last seven days, data form crypto market tracker Coingecko shows.
The RSI for BSV is 67.58, the same as it was yesterday. This RSI level is slowly approaching overbought zone, which could indicate that a little correction or consolidation in the price of BSV is imminent.
Bitcoin SV is displaying positive indicators in terms of trading volume and market capitalization. Its market cap has risen by 1.22% to reach $757 million, and its 24-hour trading volume has surged by a significant 83% to $238 million.
This increased trading activity suggests growing trader interest and the potential for BSV’s price to continue moving upward.
When market confidence persisted, the price of Bitcoin Cash also surged. The robust performance of American stocks served as an example of the increase. The S&P 500 and Dow Jones both experienced gains of more than 1%, but the Nasdaq 100 index saw a leap of more than 1.10%. Cryptocurrencies have historically performed well on rising stock prices.
Bitcoin SV Price At Resistance Zone: Potential For An Upside Break
Meanwhile, the current price of BSV is encountering a horizontal resistance zone ranging from $38.5 to $40.6. This resistance zone is also in alignment with the Fibonacci 0.5 level, at $39.75.
The possibility of a successful breach of this resistance level may indicate a sustained higher trajectory for Bitcoin SV.
Concurrently, there exists a proximate support region ranging from $33.85 to $36.10, which aligns with the Fibonacci 0.618 level of $35.89 and the 20-day Exponential Moving Average (EMA) of $34.79.
In the event that the BSV price is unable to maintain its position above the designated support zone, there is a possibility of an impending negative trend.
(This site’s content should not be construed as investment advice. Investing involves risk. When you invest, your capital is subject to risk).
Featured image from CoinPayments Blog
Future of DAOs limited by lack of regulatory framework: ECB Occasional Paper

Uncertain regulatory conditions continue to have a negative impact on the sustainable growth of the DAO ecosystem, revealed a new European Central Bank occasional paper.
BAYC creator Yuga Labs completes restructuring to focus on metaverse

Yuga Labs, a firm behind the Bored Ape Yacht Club NFTs, has completed restructuring to focus on its upcoming metaverse project Otherside.
‘Extra Bullish’ On XRP? Crypto Analyst Pinpoints The Perfect Timing
In a detailed chart analysis of the XRP/USD trading pair, seasoned crypto analyst Dark Defender has shed light on several significant indicators that point towards a bullish trajectory for the popular cryptocurrency.
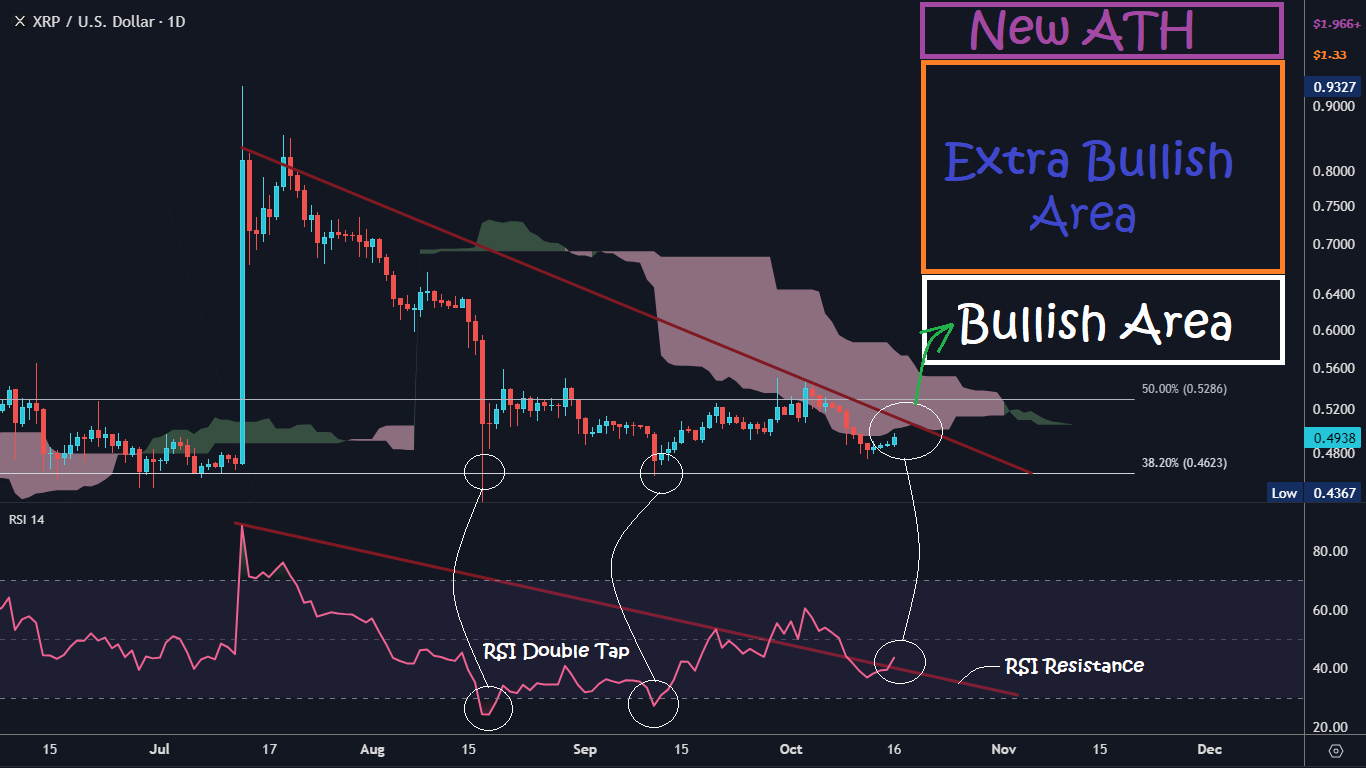
Taking to Twitter to share his insights, Dark Defender remarked, “Morning All. Hope you had a great weekend. XRP in the daily time frame is still within our price range. Above $0.52 – $0.55 is a challenge, first to break the resistance & stay above the Ichimoku Clouds.”
This sentiment aligns with the depicted interaction of XRP with the Ichimoku Cloud on the chart, a renowned technical tool that offers insights on support, resistance, and momentum. Furthermore, the analyst outlined specific price brackets, stating that XRP is: “Bullish above $0.55 – $0.66, Extra Bullish between $0.66 – $1.33, and envisions a New All-Time High Above $1.966.” These delineations echo the marked areas on the chart, notably the “Bullish Area” and “Extra Bullish Area.”
When To Get Extra Bullish On XRP
One of the primary takeaways from the chart is the “RSI Double Tap” event. For those unfamiliar, the Relative Strength Index (RSI) is a momentum oscillator that measures the speed and change of price movements. An RSI reading below 30 is typically considered oversold, while an RSI above 70 is seen as overbought. The “Double Tap” indicates that XRP has been undervalued in mid-August and mid-September, but found a strong foundation.
Further boosting the bullish sentiment is the declining trendline in the RSI that the XRP price recently broke out of, implying a potential shift in momentum. Remarkably, the RSI broke out of the downtrend for the first time at the end of September.
However, the XRP price could not keep this momentum, and as a result, the RSI once again fell below the trend line drawn by Dark Defender. But in recent days, another breakout has occurred, which could predict bullish price movements.
Moving onto the price action, the chart depicts XRP’s consistent interaction with the Ichimoku Cloud, a renowned technical tool that offers insights on support, resistance, and momentum. The fact that XRP is inching closer to entering the ‘Bullish Area’ of the Ichimoku Cloud is quite significant. This could mean that the asset is on the verge of a bullish reversal if it climbs back above $0.52.
Moreover, the chart also demarcates two distinct areas labeled “Bullish Area” and “Extra Bullish Area.” The latter is situated between the $0.66 and $1.33 mark, suggesting that if XRP manages to break above the lower boundary and hold above this price point, we might witness intensified bullish momentum. The XRP price could then more than double before major resistance is expected at the $1.33 level by Dark Defender.
Additionally, the Fibonacci retracement levels, drawn from the peak to the trough of the price movement, emphasize the 50% level at $0.5286 as a critical resistance point. Breaking through this level might propel XRP toward the “Extra Bullish Area” as specified by the analyst.
Concluding his tweet, Dark Defender aptly stated, “The clock is ticking,” indicating the expectation that the cryptocurrency could perform a strong bullish move into the “Bullish Area” between $0.55 and $0.66 at any time.
In summation, while the crypto market remains unpredictable, the technical indicators for XRP, combined with Dark Defender’s analysis, suggest a promising bullish trajectory. But as always, investors should conduct thorough research and remain cautious in their investment decisions.
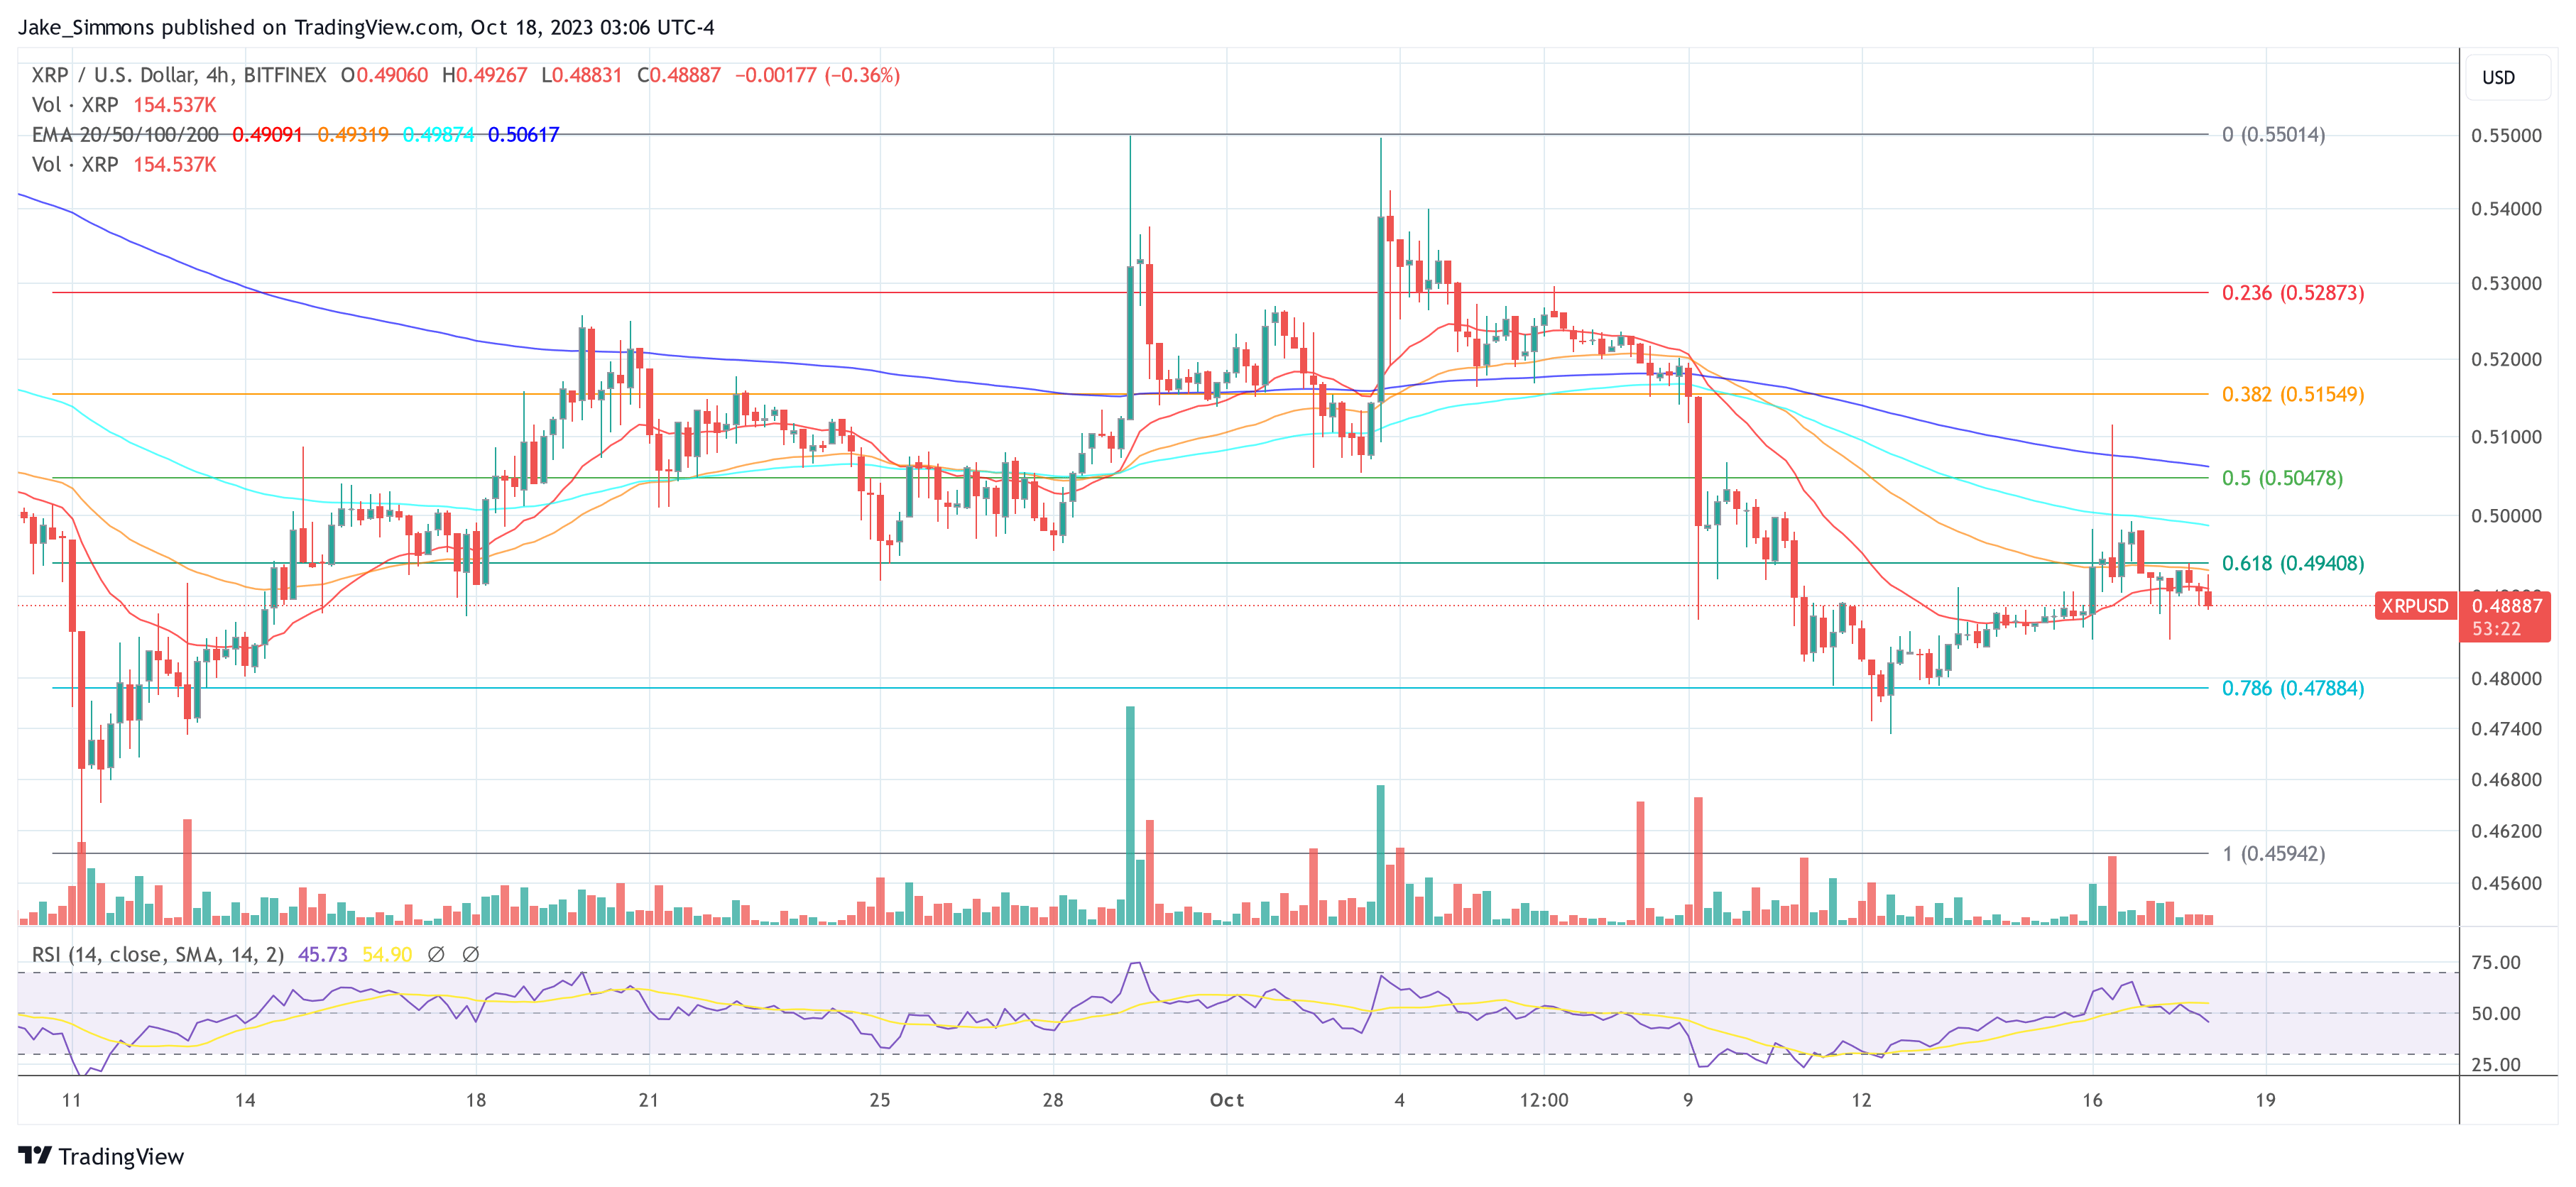
At press time, XRP traded at $0.4888.
Coinbase Trading Volume Slows Further as Crypto Winter Continues: Berenberg
“We continue to view COIN’s consumer take rate as being at risk of compression due to competition for market share within a lower volume crypto space,” the bank said.
Solana Price Direction Remains Hazy Despite 10% Weekly Rally
The recent price surge of Solana (SOL) encountered a significant roadblock at the $25 mark, which prompted a reversal following a retest in early October. Despite this setback, the market sentiment remained relatively positive, with demand showing resilience at press time.
SOL traders on higher time scales may find themselves in a state of uncertainty regarding price direction. As of the present moment, SOL has been on a modest 10% upward trajectory, surging from $21.5 to $24.70 over the past few weeks.
This development has left traders and investors pondering the possible outcomes for SOL’s trajectory, leading to discussions about potential bullish or bearish trends, or even a breakout.
Analysts have pointed to encouraging signs within SOL’s price chart, notably the Relative Strength Index (RSI) and the Chaikin Money Flow (CMF), both of which have been exhibiting positive trends. These indicators have shown steady upticks, indicating a commendable recovery in buying pressure and an increase in capital inflows over the past few days.
Solana’s Positive Indicators Amidst Uncertainty
Market observers have highlighted the significance of a convincing flip of the $25 hurdle into a support level, suggesting potential bullish momentum that could drive the price towards the $27 mark in the near future. However, cautionary notes have been sounded regarding the possibility of a price reversal, given the RSI’s overbought condition and the persistence of the resistance at $25.
Currently, SOL is trading at $24.16 according to CoinGecko, with a 24-hour movement of 0.0%. The seven-day rally, however, stands at an encouraging 9.9%, indicating a degree of price resilience even in the face of these challenges.
Adding to the complexity of SOL’s price dynamics, the cryptocurrency has experienced negative funding rates, despite the recent price rally. This discord between the price surge and the negative sentiment in the market has fueled debates among investors about the sustainability of the current upward momentum.
Discontinuation Of Services By Lido Finance
In a significant development, Lido Finance, a prominent liquid-staking provider, announced its decision to phase out services on the Solana network in the coming months.
As the third-largest protocol on the Solana blockchain and with a presence on multiple chains, including Ethereum, this move has sent shockwaves through the cryptocurrency community.
The announcement caused a notable impact on Solana’s Total Value Locked (TVL), which witnessed a sharp decline of $100 million within a single day following the news.
As SOL grapples with these mixed signals and developments, the immediate outlook for the cryptocurrency remains uncertain. Traders and investors are closely monitoring the upcoming price movements, awaiting further market cues and developments that could potentially sway the balance towards bullish recovery or a prolonged bearish phase.
While the indicators suggest a potential breakout, the cautionary notes regarding resistance levels and market sentiment continue to linger, creating an air of anticipation and apprehension in the cryptocurrency community.
(This site’s content should not be construed as investment advice. Investing involves risk. When you invest, your capital is subject to risk).
Featured image from Meetinghouse
Spot Bitcoin ETF Approvals Could Add $1 Trillion to Crypto Market Cap, CryptoQuant Says
Blockchain analytics firm CryptoQuant’s models predict that $155 billion will flow into the bitcoin market cap should the ETFs be approved.


