
The additional restrictions being considered by the Biden administration would try to target ways Chinese developers could access U.S.-made AI semiconductor chips.
Cryptocurrency Financial News
The additional restrictions being considered by the Biden administration would try to target ways Chinese developers could access U.S.-made AI semiconductor chips.
Some 198 million FLR will be burned immediately with a further 66 million set to be burned monthly until January 2026.

The Group of Twenty accepted the regulatory roadmap proposed in a joint Synthesis Paper of the International Monetary Fund and the Financial Stability Board.
Arbitrum projects will receive token grants that may help attract new money to the popular blockchain.
The cryptocurrency landscape is once again rife with speculation as Bitcoin traverses its current fourth halving cycle. Amidst varied predictions, renowned crypto analyst CryptoCon’s insights, grounded in the Gann Square methodology, the November 28 Halving Cycles theory, and the 5.3 Diminishing Returns theory have garnered significant attention.
CryptoCon remarked via X (formerly Twitter) today, “The Gann Square predicts either $89,000 or $135,000 for the Bitcoin top this cycle.” He emphasized the accuracy of the Gann Square theory during previous cycles, pointing out its precision in predicting the cycle tops.
According to the analyst, by leveraging the “blue 2×1 fan as the fair value line and drawing the end at Nov 28th (Halving Cycles Theory),” the Gann Square successfully pinpointed the tops of cycles 1 and 3 at the fourth level. However, the second cycle diverged, settling slightly above the fifth level.
This sets the stage for two potential outcomes in the ongoing fourth cycle, with the $135,000 prediction aligning with both CryptoCon’s November 28th price model and his Trend Pattern price model. Conversely, the $89,000 figure is aligning with the 5.3 diminishing returns theory.
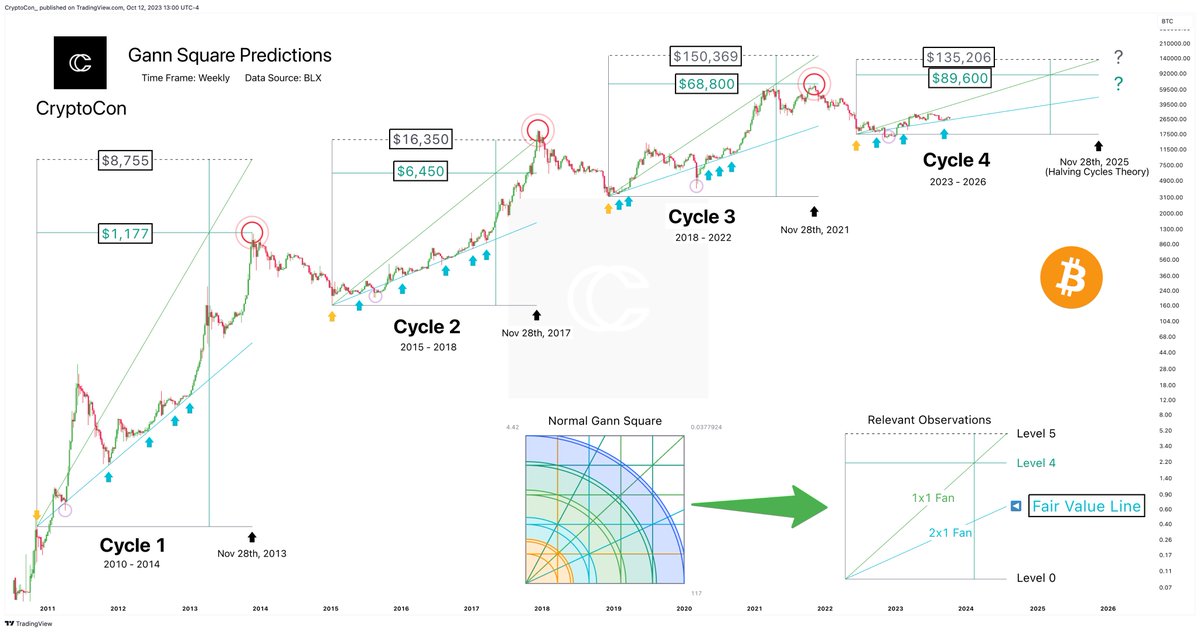
Historical data further adds depth to this analysis. Bitcoin’s inaugural cycle, spanning 2010-2014, saw it catapult from a minuscule value to a peak of $1,177. The subsequent 2015-2018 cycle commenced at $250, witnessing an unprecedented climb to $20,000 by its close. The journey from 2018-2022 manifested Bitcoin’s resilience as it surged from sub-$6,000 levels to a commendable $68,800.
Delving into the intricacies of the Gann Square’s “Fan” Lines offers more clarity. The “2×1 Fan” line, represented in blue, plots a trend angle where the price progression is double that of time. Traditionally, when the Bitcoin price is close to this line, it indicates a “fair value”.
In its 13-year history, Bitcoin has only extremely rarely fallen below the line, most recently in late 2022 following the collapse of FTX, then the second largest crypto exchange, and during the Covid crash in March 2020.
The “1×1 Fan” line, depicted in green, portrays a market in equilibrium with prices increasing in tandem with time. Historically, Bitcoin’s price peaked near this line during the parabolic run-up in the second and third cycles, providing the theoretical basis for the $135,000 prediction.
In a subsequent post, CryptoCon further explained the $89,600 target. He stated that “$90k is slightly above the 5.3 diminishing returns theory.” According to the theory, Bitcoin’s returns diminish by a factor of 5.3x from the bottom to the top of each cycle, suggesting the next cycle’s peak might be around $77,000.
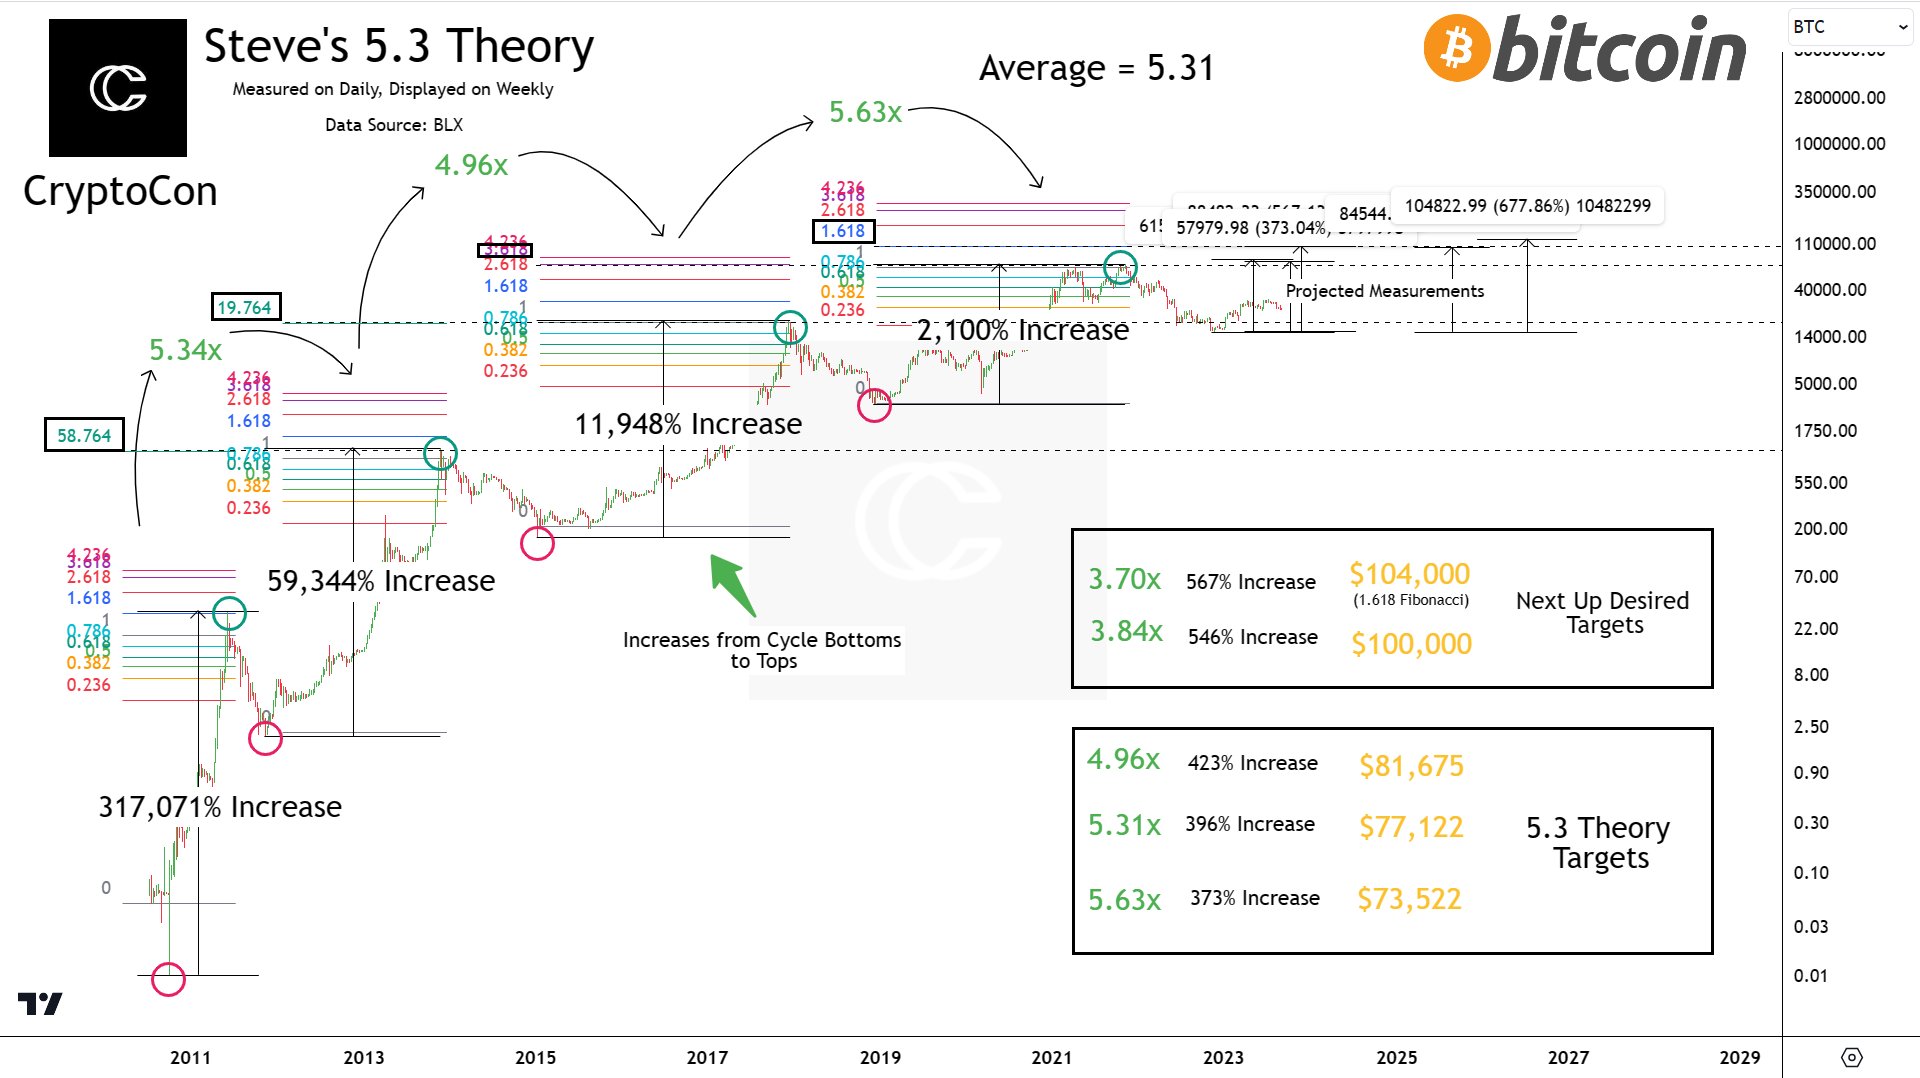
CryptoCon remarked, “After measuring returns from cycle bottoms to tops on the daily time frame as precisely as possible, the returns from cycle tops to bottoms are not 5.3. They are as follows: 5.34x, 4.96x, and 5.63x.”
Diving deeper, CryptoCon pointed out, “There is merit to the 5.3, as the average of these numbers is 5.31. However, we cannot say for sure that this will be the returns if this is just an average.”
Highlighting the potential peaks based on past cycles, he commented on the more grounded numbers. “The real numbers so far range from the lowest cycle top of $73,522 to the highest at $81,675 with an average cycle top of $77,122.”
Discussing the possibilities of Bitcoin hitting a much-anticipated $100,000 mark, CryptoCon explained, “$100,000 would mean a 3.84x diminish, implying Bitcoin would need to exhibit a drastically lower diminishing return rate this cycle.”
Drawing attention to Bitcoin’s historical relationship with Fibonacci extensions, he stated, “Bitcoin has consistently hit a Fibonacci extension level at each cycle top. If $77,000 is the anticipated target, this would be a deviation. The cycles have previously matched Fibonacci extensions of 58.764, 19.764, and 3.618. For this cycle, the lowest Fibonacci extension measured from weekly candle bodies is the 1.618, suggesting a price of $104,000 which corresponds to a 3.7x diminish from the last cycle.”
CryptoCon concluded by inviting speculations on whether external factors, such as the approval of spot Bitcoin ETFs, could provide the necessary momentum to shift these models. “Many believe that ETFs will have the strength to disrupt these models and predictions. Returns are evidently diminishing, but is the 5.31x ($77,122) average return going to be this cycle’s peak?”
At press time, BTC traded at $26,906.

The Autorité de Contrôle Prudentiel et de Résolution concluded its consultation on the regulation of DeFi.
Spot-based ETFs are widely expected to unlock floodgates for mainstream money. Flows, however, are likely to materialise overtime, according to Coinbase.

Google explicitly stated that only seven products fall under this legal protection, excluding Google’s Bard search tool.
Major tokens seemed to stabilize on Friday morning following a week-long price drop.

The SEC must appeal Grayscale’s win in a D.C. Appeals Court on Oct. 13, or it will have to approve — or try to delay — the firm’s Bitcoin ETF bid.

A 75-minute recording, obtained by Cointelegraph, shows the exact moment former Alameda Research CEO Caroline Ellison told employees about their use of FTX customer deposits.

CFTC Commissioner Kristin Johnson’s comments came after separate lawsuits from the CFTC and FTC were filed against Voyager and its former CEO, Stephen Ehrlich.

Terraform Labs has urged the judge to grant its motion to compel trading data from Citadel Securities, which it says had a hand in the collapse of USTC in May 2022.
Solana is correcting gains from the $25 resistance against the US Dollar. SOL price could accelerate lower if there is a break below the $21 support.
After a steady increase, Solana struggled to clear the $25 resistance zone. SOL formed a high at $24.77 and recently started a fresh decline.
There was a move below the $24.00 and $23.50 levels. The bears pushed the price below the 50% Fib retracement level of the upward move from the $18.75 swing low to the $24.77 high. There is also a key bearish trend line forming with resistance near $22.00 on the 4-hour chart of the SOL/USD pair.
SOL is now trading below $22.00 and the 100 simple moving average (4 hours). It is also showing bearish signs below $22, like Bitcoin and Ethereum.
However, the bulls are now protecting the $21.00 support. It is near the 61.8% Fib retracement level of the upward move from the $18.75 swing low to the $24.77 high. On the upside, immediate resistance is near the $22.00 level and the trend line.
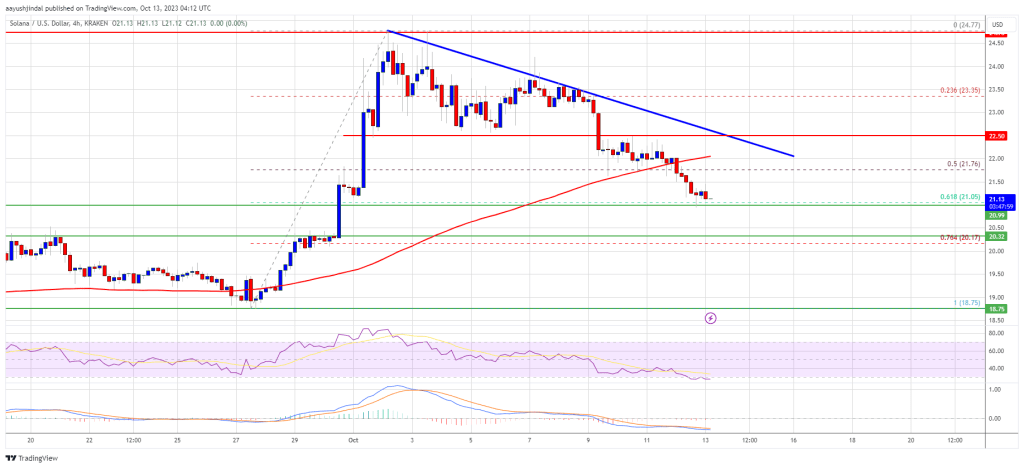
Source: SOLUSD on TradingView.com
The first major resistance is near the $22.50 level. A clear move above the $22.50 resistance might send the price toward the $23.50 resistance. The next key resistance is near $24.00. Any more gains might send the price toward the $25.00 level.
If SOL fails to recover above the $22.00 resistance, it could continue to move down. Initial support on the downside is near the $21.00 level.
The first major support is near the $20.30 level. If there is a close below the $20.00 support, the price could decline toward the $20.00 support. In the stated case, there is a risk of more downsides toward the $18.80 support in the near term.
Technical Indicators
4-Hours MACD – The MACD for SOL/USD is gaining pace in the bearish zone.
4-Hours RSI (Relative Strength Index) – The RSI for SOL/USD is below the 50 level.
Major Support Levels – $21.00, and $20.30.
Major Resistance Levels – $22.00, $22.50, and $24.00.
Ethereum price is moving lower toward the $1,500 support against the US dollar. ETH could correct higher, but upsides might be limited above $1,565.
Ethereum remained in a bearish zone below the $1,580 resistance zone. ETH failed to stay above the key $1,550 support and extended its decline, unlike Bitcoin.
The price traded to a new weekly low at $1,521. It seems like the price is slowly moving lower after it settled below $1,600. There are also two bearish trend lines forming with resistance near $1,555 and $1,570 on the hourly chart of ETH/USD.
Ethereum is now trading below $1,565 and the 100-hourly Simple Moving Average. There was a minor increase above the 23.6% Fib retracement level of the recent decline from the $1,595 swing high to the $1,521 low.
On the upside, the price might face resistance near the $1,555 level and the first trend line. The first major resistance is near the second trend line, $1,565, and the 100-hourly Simple Moving Average. It is close to the 61.8% Fib retracement level of the recent decline from the $1,595 swing high to the $1,521 low.
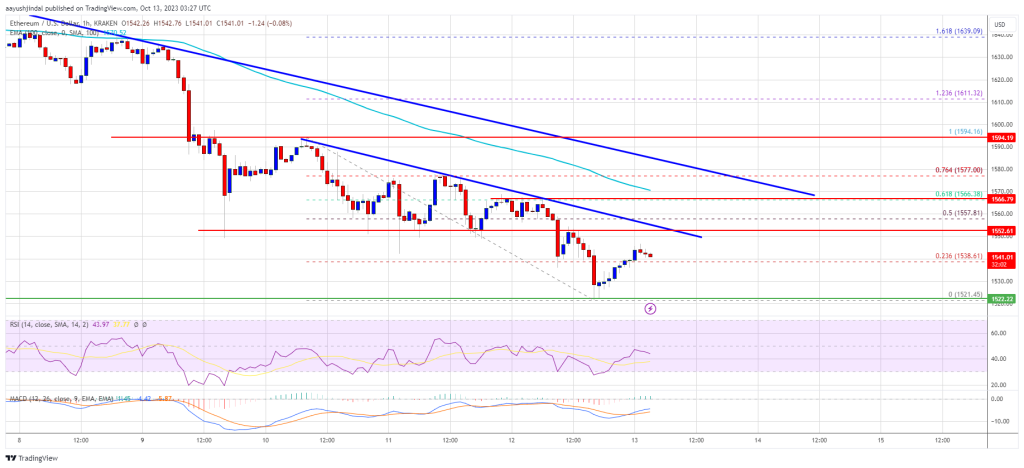
Source: ETHUSD on TradingView.com
A clear move above the $1,570 resistance might send the price toward the key resistance at $1,600. In the stated case, Ether could rise and recover toward the $1,665 resistance. Any more gains might open the doors for a move toward $1,750.
If Ethereum fails to clear the $1,565 resistance, it could continue to move down. Initial support on the downside is near the $1,520 level. The next key support is $1,500.
A downside break below the $1,500 support might send the price further lower. In the stated case, the price could drop toward the $1,440 level. Any more losses may perhaps send Ether toward the $1,420 level.
Technical Indicators
Hourly MACD – The MACD for ETH/USD is gaining momentum in the bearish zone.
Hourly RSI – The RSI for ETH/USD is now below the 50 level.
Major Support Level – $1,500
Major Resistance Level – $1,565
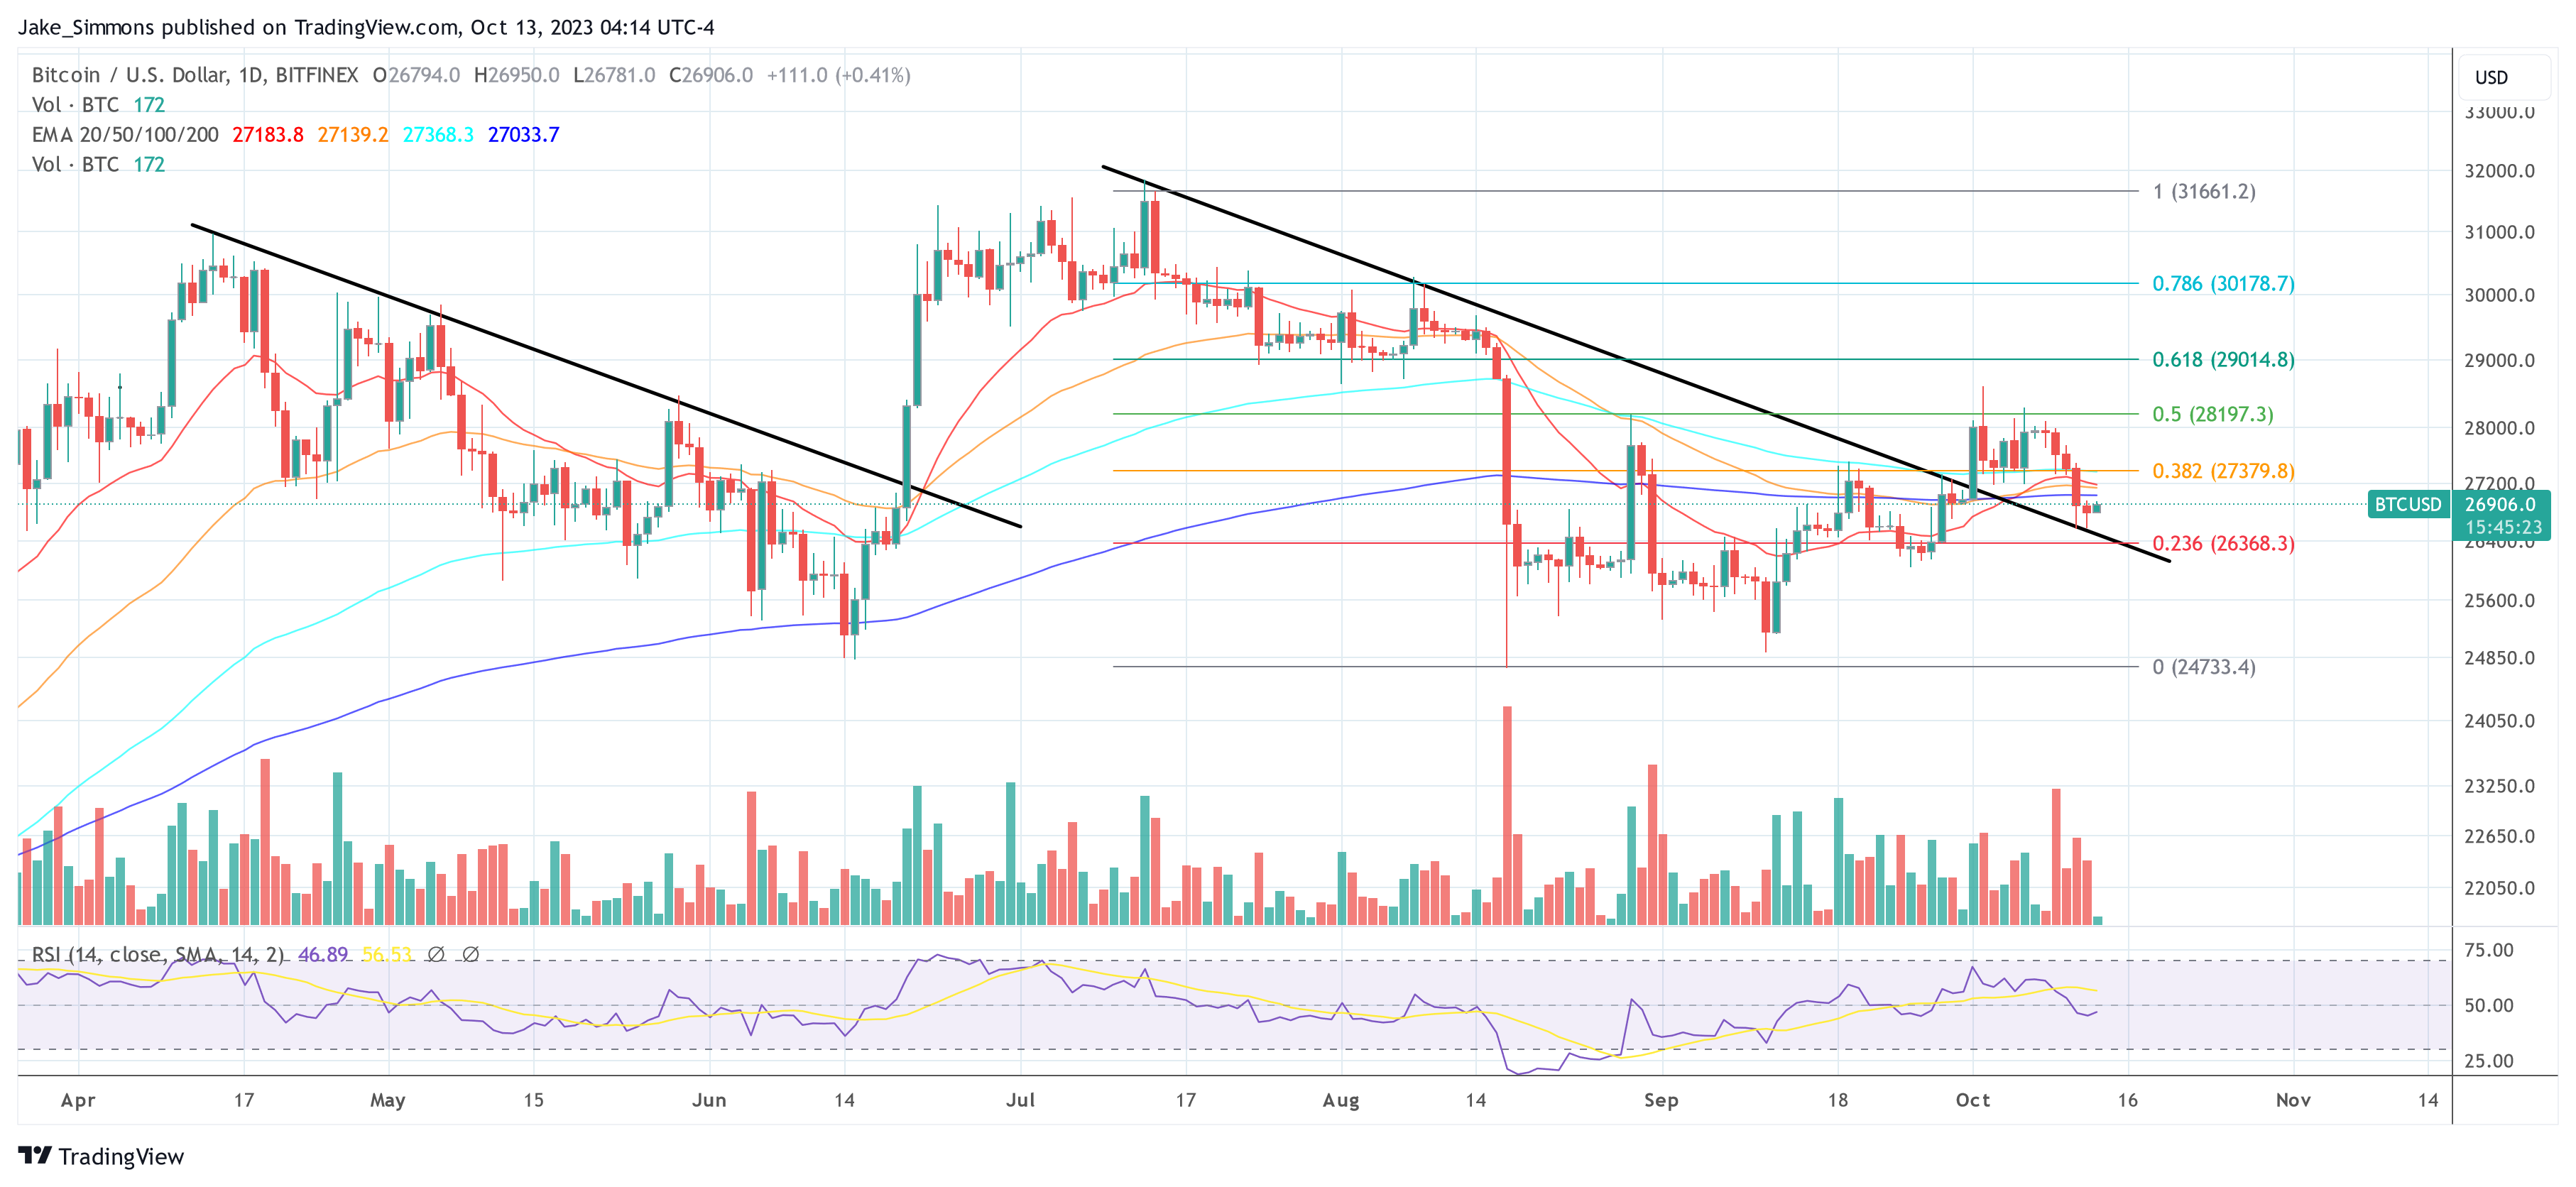
Bitcoin price is consolidating above the $26,550 level. BTC could correct higher, but upsides might be capped near the $27,400 and $27,500 resistance levels.
Bitcoin price started a fresh decline from the $27,500 resistance. BTC traded below the $27,000 level to enter a bearish zone. Finally, the bulls appeared above the $26,500 support.
The price remained well-bid near the $26,550 level. The bears made two attempts to push the price below $26,550, but they failed. A low is formed near $26,551 and the price is now consolidating losses below the 23.6% Fib retracement level of the downward move from the $28,285 swing high to the $26,551 low.
Bitcoin is now trading below $27,200 and the 100 hourly Simple moving average. There is also a key bearish trend line forming with resistance near $26,200 on the hourly chart of the BTC/USD pair.
Immediate resistance is near the $26,950 level. The first major resistance is $27,200 and the 100 hourly Simple moving average. The next key resistance could be $27,400 and the trend line. It is close to the 50% Fib retracement level of the downward move from the $28,285 swing high to the $26,551 low.
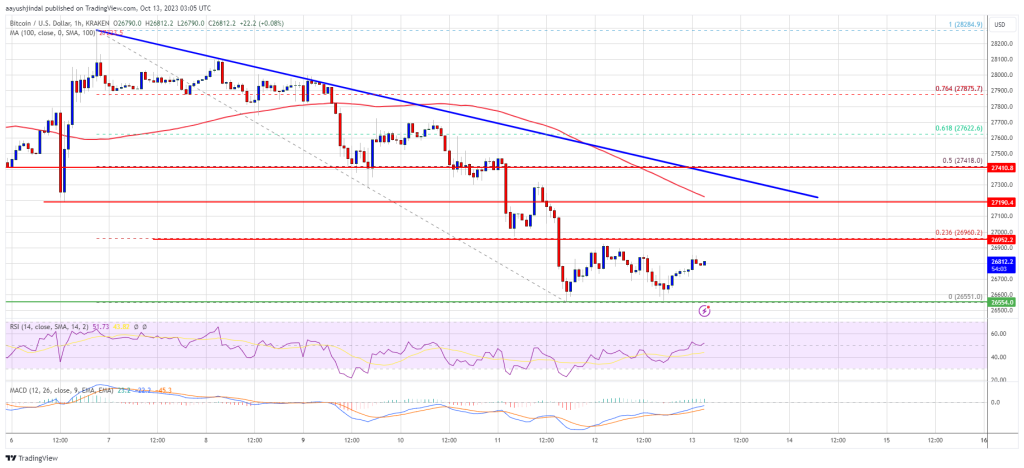
Source: BTCUSD on TradingView.com
A close above the $27,500 resistance might start a steady increase toward the $28,000 level. The main hurdle is still $28,500, above which the price could start another increase. In the stated case, the price could rise toward the $30,000 resistance.
If Bitcoin fails to recover higher above the $27,200 resistance, there could be more losses. Immediate support on the downside is near the $26,550 level.
The next major support is near the $26,500 level. A downside break and close below the $26,500 support might send the price further lower. The next support sits at $26,000.
Technical indicators:
Hourly MACD – The MACD is now losing pace in the bearish zone.
Hourly RSI (Relative Strength Index) – The RSI for BTC/USD is now above the 50 level.
Major Support Levels – $26,550, followed by $26,500.
Major Resistance Levels – $27,200, $27,400, and $27,500.

At least 500 Space Force staff members have been affected, according to the department’s former chief software officer.
Lookonchain, a blockchain tracking platform, now reveals that one stablecoin holder lost over $100,000 after panic selling USDR, a stablecoin issued on the Polygon network, for zero USDC after it depegged on October 11. The stablecoin holder swapped 131,350 USDR for zero USDC, allowing an MEV bot to swoop in and claim $107,000 in profit.
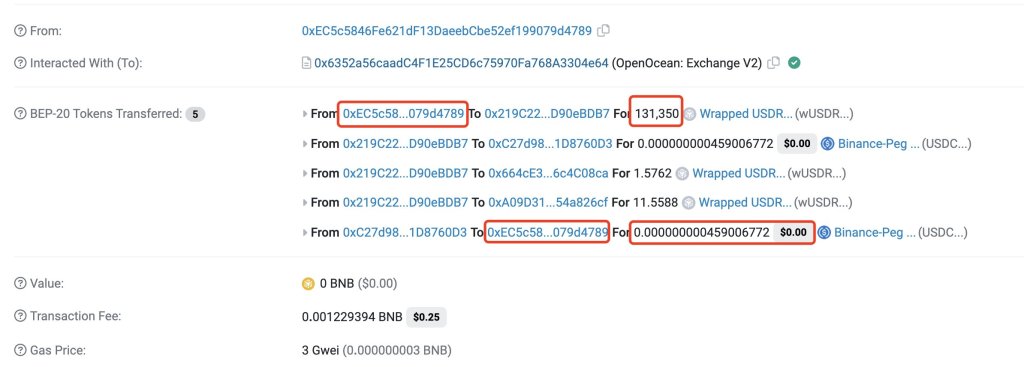
The stablecoin is issued by Tangible protocol, a decentralized finance (DeFi) protocol that claims to be tokenizing housing and other real-world assets. Due to the immutable nature of the Polygon network, the USDR holder is now at a loss.
All on-chain transactions cannot be reversed unless there is a network rollback, which will unwind other transactions as a result should validators choose to do so. However, considering how public ledgers operate, it is improbable that a rollback will be done to recover funds.
There has yet to be any feedback from the MEV bot operator on whether they can refund the affected user. Since the error was on the swapper’s side and not the hack, the community’s response to this mistake remains largely muted.
Real USD, USDR, is a stablecoin backed by a blend of other crypto assets and real estate. Considering the stablecoin’s construction, USDT is interest-bearing, meaning holders receive rewards. It was meant to track the USD but lost its peg on October 11 after a wave of redemptions drained the project’s treasury of its liquid assets, including DAI.
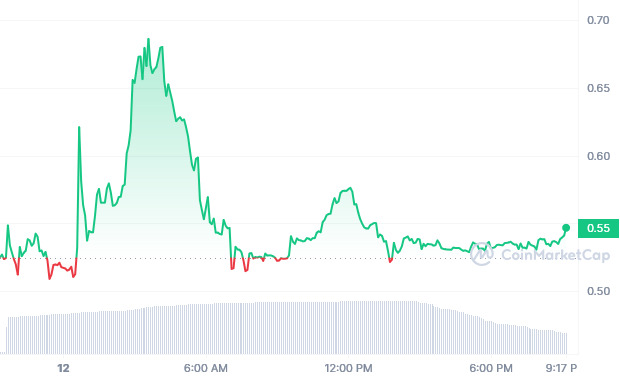
By the close of October 11, USDR was trading versus the USD at around $0.53, a near 50% drop, triggering panic. Moments after the rapid withdrawal of DAI and liquid assets from its treasury, the team explained that USDR fell to as low as $0.50 before recovering.
Despite the depegging, the USDR issuer said it is working on making holders whole, saying the crisis is mainly “liquidity related.” It also attempted to assuage holders, assuring that “the real estate and digital assets backing USDR still exist and will be used to support redemptions.”
Updating the community on X, the issuer said it is not “going anywhere” and is working on a “plan”:
Tangible isn’t going anywhere. We have a flywheel that works and plans to continue building within that. A critical part of our shared future success is maintaining the trust we’ve established with our users over the past year, which we hope to maintain through the plan below.
Beyond the panic selling and one holder losing over $100,000 to an MEV bot, the extent of the USDR depeg has not been fully quantified. As of October 12, Polyscan data shows over 2,400 USDR holders. In total, they cumulatively control slightly over 45.5 million of the stablecoin.

The proposed act came just hours after talks broke down between actors and Hollywood studios, with AI replicas a major friction point in negotiations.

The former CEO of Systematic Alpha Management faces up to five years in prison for his role in a fraudulent scheme tied to crypto futures contracts.


