
From solving Mt. Gox to tracing crypto used by child abuse syndicates in Korea, Chainalysis has a long but sometimes controversial history.
Cryptocurrency Financial News
From solving Mt. Gox to tracing crypto used by child abuse syndicates in Korea, Chainalysis has a long but sometimes controversial history.
BTC price strength returns ahead of Wall Street trading, with $27,000 in Bitcoin bulls’ crosshairs.

A subtle change to the description of Google Search’s helpful content system could very well be the beginning of a new era of content distribution on the internet. Something to be embraced or a pause for thought?

The International Cricket Council will leverage Near’s Blockchain Operating System to power a Web3 fan engagement app during the 2023 Cricket World Cup in India.
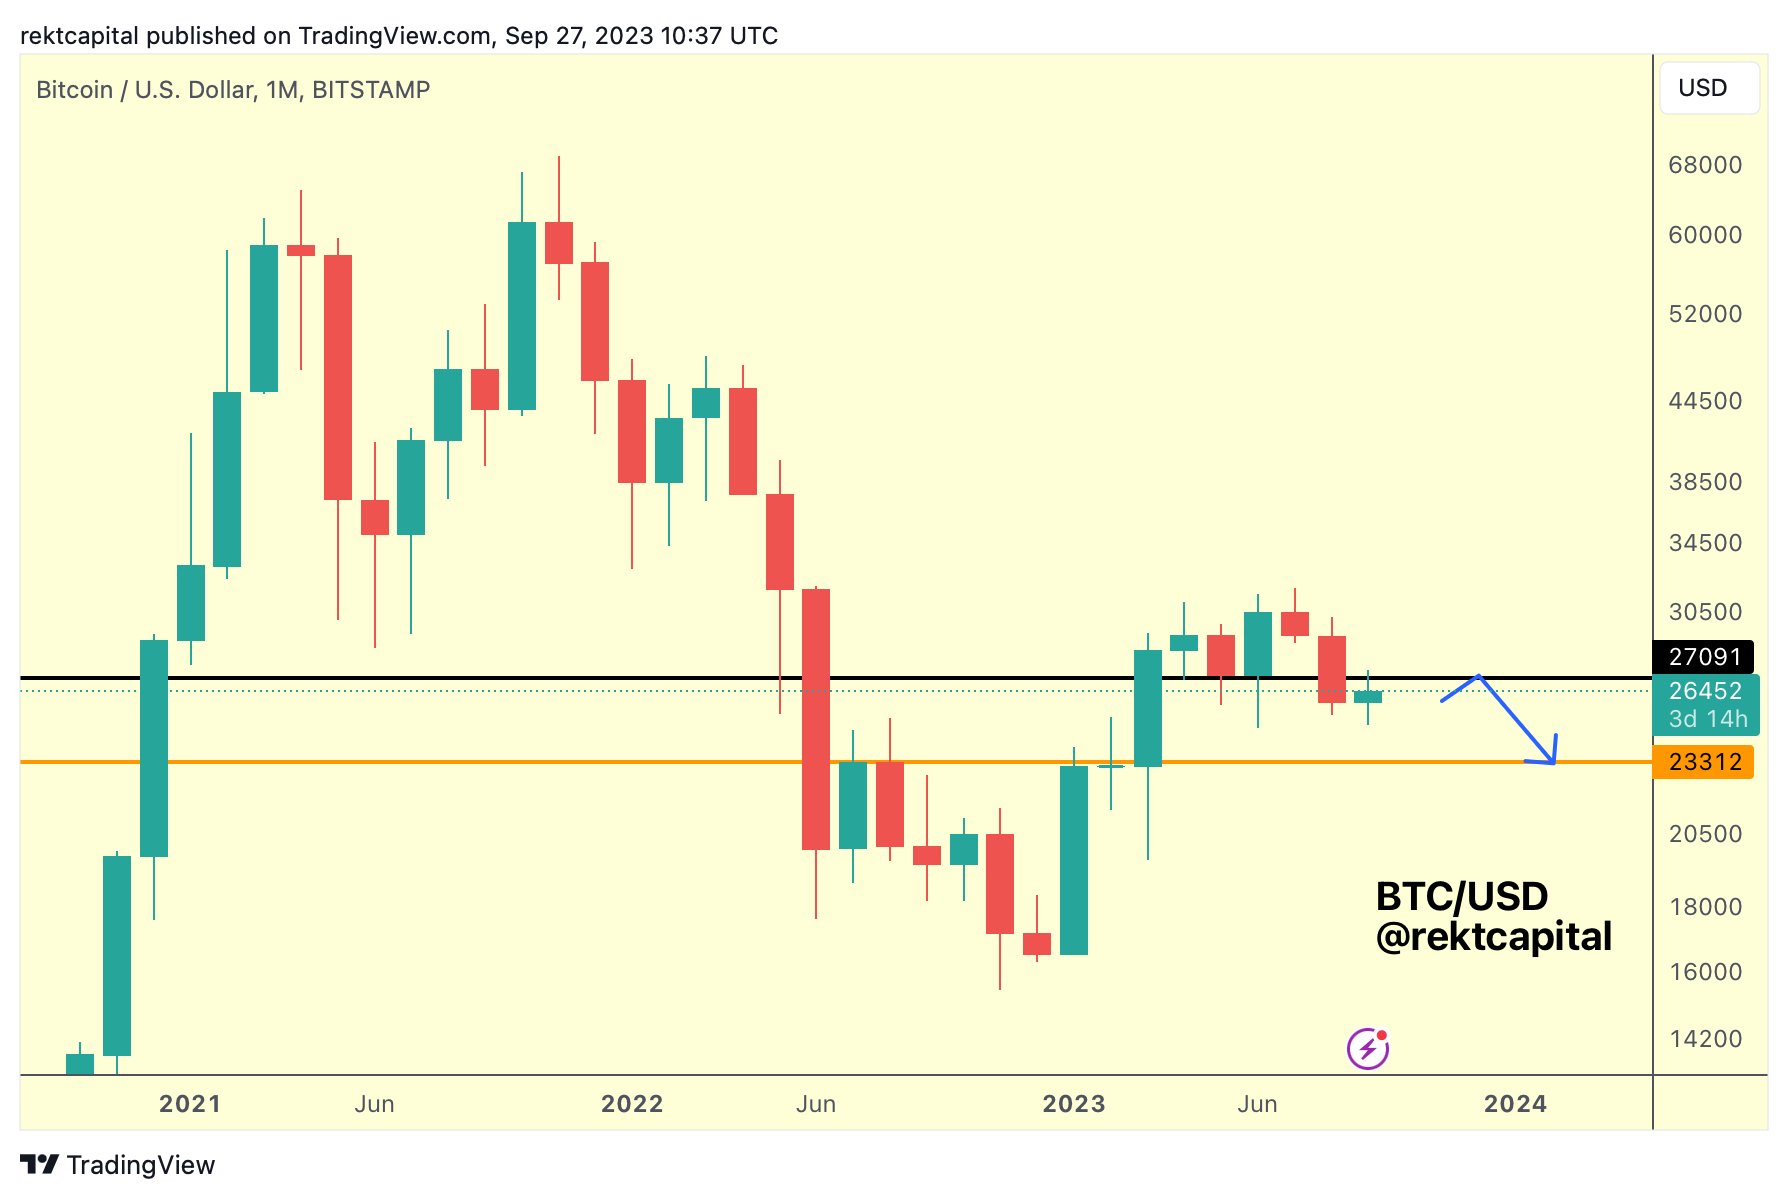
Renowned crypto analyst Rekt Capital has recently highlighted the pivotal nature of the Bitcoin price’s imminent monthly candle close. In a statement via X (formerly Twitter), he detailed that Bitcoin has tagged the $27,000 monthly level from the underside, meaning it is acting as resistance for the time being.
He explained that “the upcoming monthly candle close is just around the corner. Bitcoin needs to monthly close above $27,091 for this to be a fake-breakdown. Otherwise, the breakdown will be technically confirmed.”
To give this statement some historical context, the preceding month – August – saw a significant development for the flagship cryptocurrency. BTC registered a bearish monthly candle close, finishing below approximately $27,150. This data point, according to Rekt Capital, effectively confirmed it as lost support.
Reflecting on this development at the time, the analyst had conveyed that it is possible BTC could surge to $27,150, “maybe even upside wick beyond it this September. But that would likely be a relief rally to confirm $27150 as new resistance before dropping into the ~$23000 region. $23000 is the next major Monthly support now that ~$27150 has been lost.”
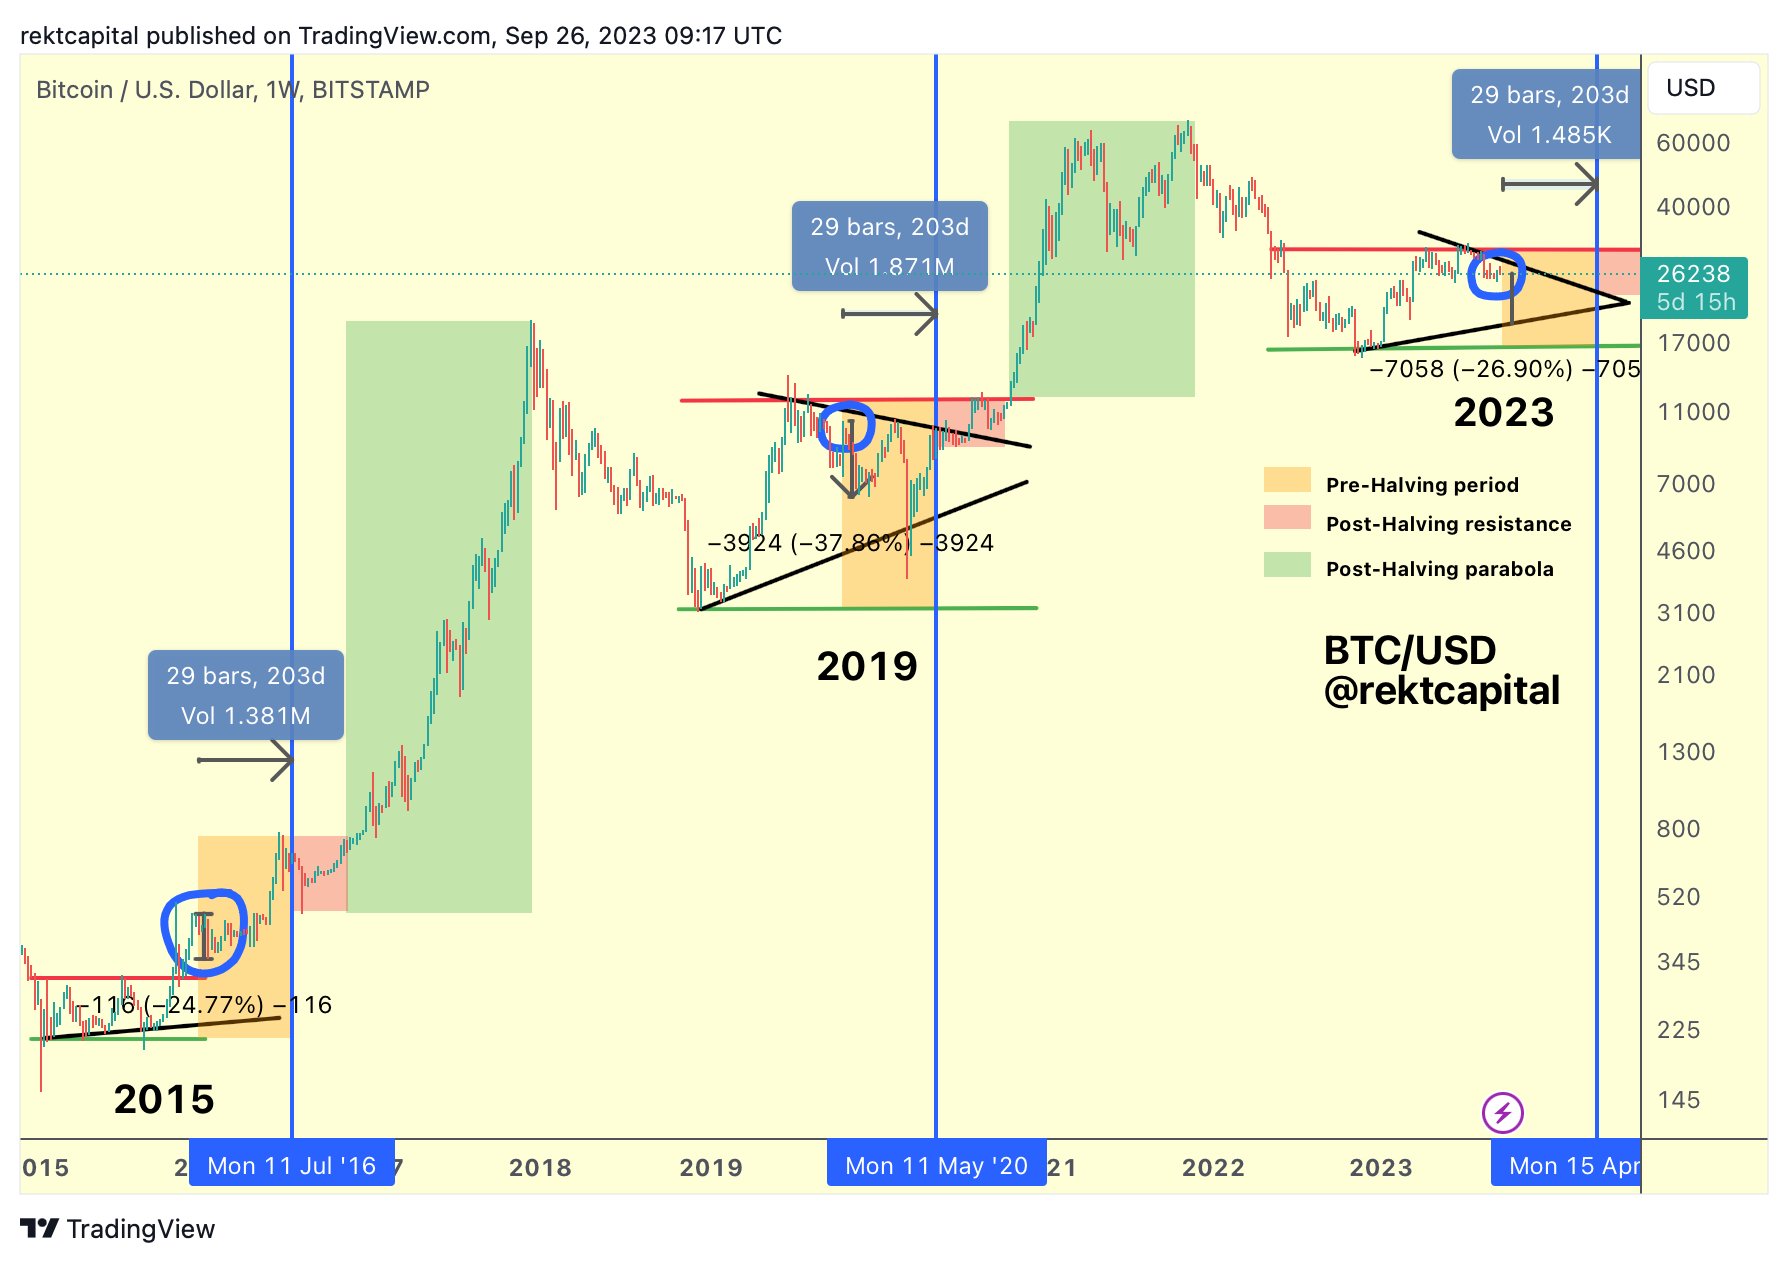
Rekt Capital’s observations about Bitcoin aren’t made in isolation but are deeply rooted in Bitcoin’s historical price and cycle behaviors. Drawing parallels to previous patterns, he had previously shed light on Bitcoin’s tendencies around 200 days before a halving event.
“At this same point in the cycle (~200 days before the halving): In 2015, Bitcoin retraced -24% within a re-accumulation range, but price consolidated for months going into the halving. In 2019, Bitcoin retraced -37% as part of a downtrend that continued for months going into the halving.”
These historical retracements at a similar juncture have given rise to two essential insights, as stated by Rekt Capital. First, an immediate retracement has occurred at this same point in the cycle. Second, a repeated retrace of between -24% to -37% in 2023 would lead Bitcoin to retest its macro higher low, possibly pushing its price under the $20,000 threshold.
The analyst didn’t stop there. Accentuating the ideal accumulation phases for investors, he noted, “The best time to accumulate Bitcoin was in late 2022 near the bear market bottom. The second best time to accumulate Bitcoin is upon a deeper retracement in the pre-halving period.”
Shifting the focus to potential future outcomes, Rekt Capital made an intriguing speculation about the potential of BTC’s price movement post-halving: “If ~$31000 was the top for 2023. Then the next time we see these prices will be months from now, just after the halving. Only difference between now and then? In this pre-halving period, BTC could still retrace from here. But after the halving, BTC would break out much higher from current prices.”
To summarize, the upcoming monthly candle close for Bitcoin could have profound implications for the asset’s short-to-mid-term trajectory. All eyes will now be on whether BTC manages to close above or below the critical $27,150 mark – an indicator that could either confirm a technical breakdown or prevail over a historically untypical price rally.
At press time, BTC stood at $26,687.

In the bear market’s quiet, there is ample room for ideation, innovation and the laying of a foundation that will not just withstand, but thrive, in the subsequent bull market.

The JPEX scandal has grown to become one of the largest fraud cases in the country, with over 2,300 victims and losses estimated at over $175 million.

Coinbase CEO Brian Armstrong has been actively pursuing the exchange’s expansion ambitions in the United Kingdom amid mounting legal issues in the United States.
Rachel Conlan, the new Chief Marketing Officer (CMO) of Binance, the world’s largest cryptocurrency exchange by trading volume, conducted an interview with Serdar Turan as part of CoinDesk Türkiye’s Exclusive Interview series.
The uptick was initially led by spot market buyers, which squeezed out bearish derivative positions, one analyst said.
Curve founder Michael Egorov has deposited 68 million CRV tokens ($35 million) to settle his entire debt position on DeFi lending platform Aave, according to blockchain analytics firm Lookonchain.
Lawmakers in the United States have finally put their foot down and demanded that the US SEC Chairman approve Grayscale’s spot Bitcoin ETF proposal “immediately.”
A group of four members of the United States Congress sent a letter to the United States Securities and Exchange Commission (SEC) Chairman, Gary Gensler on Tuesday, September 26 demanding the prompt endorsement of spot Bitcoin ETFs.
The letter described major flaws in the US SEC’s rejection of Grayscale’s spot Bitcoin ETF proposal, stating that if the SEC is unable to provide an appropriate explanation for its different regulatory treatment of spot Bitcoin ETFs and Bitcoin Futures, then its rejection would be seen as an “unlawful” discrimination.
The letter was signed by prominent US lawmakers including Mike Flood, Ritchie Torres, Tom Emmer, and Wiley Nickel. The lawmakers stated that Congress is tasked to ensure the US SEC meets all investment product requirements created by Congress.
The members of Congress have also shown support for the initiation of Spot Bitcoin ETFs and stated that spot Bitcoin ETFs would ensure investors are properly safeguarded from investment risks since there would be better clarity on Bitcoin cryptocurrency.
“A regulated spot bitcoin ETP would provide increased protection for investors by making access to bitcoin safer and more transparent,” the US lawmakers stated.
A hearing between the US SEC Chairman and the Congress is scheduled for Wednesday, September 27 and Gensler may be subjected to intense scrutiny and questions on his rejection of spot Bitcoin ETFs.
The US SEC has continued to delay its approval for Grayscale’s spot Bitcoin ETF application since August 2023, requesting more time to deliberate on evaluating its actions concerning the proposal.
Grayscale, a crypto asset management company applied to convert its Bitcoin trust to an ETF in October 2021. However, the US SEC denied the request, stating that the crypto asset investment firm’s proposal did not meet anti-fraud and investor protection standards.
Grayscale responded by filing a court appeal in the District of Columbia requesting the court to review the US SEC’s rejection of Grayscale’s Bitcoin ETF application.
The digital asset management company scored an unprecedented victory against the US SEC after Judge Naomi Rao from the federal court of appeals ruled against the US SEC, stating that the commission’s rejection of Grayscale’s proposal was “arbitrary and capricious” because the regulator failed to explain its denial of spot Bitcoin ETFs after approving similar products like Bitcoin Futures in June 2023.
In light of the court’s ruling, the crypto community and other prominent financial institutions like JP Morgan believe that the approval of spot Bitcoin ETFs is inevitable.
Presently the US SEC has delayed spot Bitcoin ETFs from several prominent crypto firms including Bitwise, BlackRock, WisdomTree, Invesco, Ark Invest, Galaxy, VanEck, and Fidelity.
The commission is yet to respond to the demands of Congress and the crypto community awaits more detailed information in the hearing on September 27.

Curve Finance founder Michael Egorov still has a debt of $42.7 million across four protocols, including Silo, Fraxlend, Inverse and Cream.
The latest price moves in bitcoin (BTC) and crypto markets in context for Sept. 27, 2023. First Mover is CoinDesk’s daily newsletter that contextualizes the latest actions in the crypto markets.
Bitcoin mining company Marathon Digital (MARA) has mined an invalid Bitcoin block at height 809478, according to several developers, miners and researchers.

The CIA says it is creating its own ChatGPT AI tool to conduct open-source investigations by analyzing public information.
Solana (SOL) has found itself in the midst of a price battle, with neither bulls nor bears able to establish dominance. The daily charts have revealed a story of indecisiveness, characterized by the formation of neutral doji candles. This hesitation in price movement follows a previous sharp decline, indicating that the bearish momentum is losing steam.
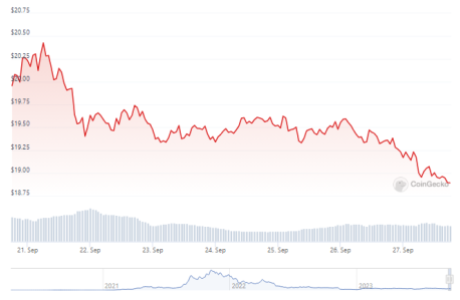
Despite the cautious optimism among bulls, the recent price action has been far from encouraging. The $21 resistance level proved to be a formidable barrier that buyers struggled to breach. This resistance level has been a key focal point for traders, as it represents a crucial milestone for SOL’s bullish aspirations.
As of now, SOL is trading at $19.05 according to CoinGecko, reflecting a 1.6% decline in the past 24 hours and a 5.2% dip over the last seven days. While these figures may seem discouraging, there is still a glimmer of hope for those betting on a bullish reversal.
Amidst the market’s uncertainty, technical analysts have identified an intriguing pattern on the daily time frame chart—a potential inverted head and shoulders pattern. This pattern is often regarded as a bullish reversal indicator, and its completion could be a sign of better days ahead for SOL.
The pattern consists of three main parts: a left shoulder, a head, and a right shoulder. The recent pullback in SOL’s price is seen as the completion of the right shoulder, setting the stage for a potential rally. The key support level to watch is $19 which, if held, could pave the way for SOL to retest the neckline resistance at $20.80.
While the inverted head and shoulders pattern offers a glimmer of hope, traders must remain cautious. The Relative Strength Index (RSI) has been lingering below the neutral 50 level in recent days, suggesting that bearish sentiment still holds sway. Additionally, the On-Balance Volume (OBV) has struggled to break through local resistance despite multiple attempts in September, indicating that sellers may still have the upper hand.
To flip the market structure bearishly, a price report notes SOL would need to breach the $18.58 level convincingly. Until then, the possibility of SOL forming a short-term consolidation range before making a potential upward move remains on the table. However, the current evidence suggests that sellers are not ready to relinquish control just yet.
The emergence of an inverted head and shoulders pattern provides a glimmer of hope for bullish traders, but caution is advised as key indicators signal ongoing uncertainty in the market. The coming days will likely determine whether SOL can break free from its current range and embark on a path toward higher prices.
(This site’s content should not be construed as investment advice. Investing involves risk. When you invest, your capital is subject to risk).
Featured image from Shutterstock

The local subsidiary of the world’s largest crypto exchange has suggested that customers convert all their fiat currency on the exchange to crypto.
While Bankman-Fried’s lawyers tried again to get him out of jail just days ahead of his trial, the judge overseeing the case inched closer to resolving some outstanding issues.

The Writer’s Guild strike has come to an end after five months of picketing, with a tentative deal approved for new conditions that include negotiations over AI usage.


