Solana (SOL) has found itself in the midst of a price battle, with neither bulls nor bears able to establish dominance. The daily charts have revealed a story of indecisiveness, characterized by the formation of neutral doji candles. This hesitation in price movement follows a previous sharp decline, indicating that the bearish momentum is losing steam.
Despite the cautious optimism among bulls, the recent price action has been far from encouraging. The $21 resistance level proved to be a formidable barrier that buyers struggled to breach. This resistance level has been a key focal point for traders, as it represents a crucial milestone for SOL’s bullish aspirations.
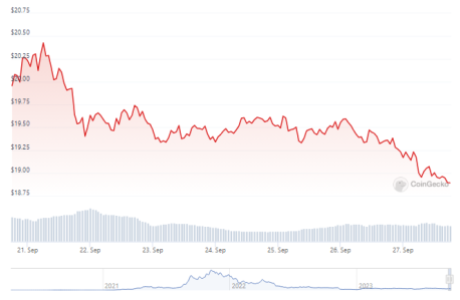
As of now, SOL is trading at $19.05 according to CoinGecko, reflecting a 1.6% decline in the past 24 hours and a 5.2% dip over the last seven days. While these figures may seem discouraging, there is still a glimmer of hope for those betting on a bullish reversal.
Solana Watch: Key Metrics To Watch
Amidst the market’s uncertainty, technical analysts have identified an intriguing pattern on the daily time frame chart—a potential inverted head and shoulders pattern. This pattern is often regarded as a bullish reversal indicator, and its completion could be a sign of better days ahead for SOL.
The pattern consists of three main parts: a left shoulder, a head, and a right shoulder. The recent pullback in SOL’s price is seen as the completion of the right shoulder, setting the stage for a potential rally. The key support level to watch is $19 which, if held, could pave the way for SOL to retest the neckline resistance at $20.80.
Indicators Signal Caution
While the inverted head and shoulders pattern offers a glimmer of hope, traders must remain cautious. The Relative Strength Index (RSI) has been lingering below the neutral 50 level in recent days, suggesting that bearish sentiment still holds sway. Additionally, the On-Balance Volume (OBV) has struggled to break through local resistance despite multiple attempts in September, indicating that sellers may still have the upper hand.
To flip the market structure bearishly, a price report notes SOL would need to breach the $18.58 level convincingly. Until then, the possibility of SOL forming a short-term consolidation range before making a potential upward move remains on the table. However, the current evidence suggests that sellers are not ready to relinquish control just yet.
The emergence of an inverted head and shoulders pattern provides a glimmer of hope for bullish traders, but caution is advised as key indicators signal ongoing uncertainty in the market. The coming days will likely determine whether SOL can break free from its current range and embark on a path toward higher prices.
(This site’s content should not be construed as investment advice. Investing involves risk. When you invest, your capital is subject to risk).
Featured image from Shutterstock


