Crypto Analyst Predicts XRP Price Explosion To Over $18

In a recent analysis provided by the crypto analyst Dark Defender, a compelling case has been made for the potential significant rise in the price of XRP. Through a detailed examination of the XRP/USD chart on a monthly time frame, as sourced from Binance, Dark Defender highlights a large bullish formation, which he describes as a “bull flag” across multiple longer-term time frames including monthly, three-month, and six-month charts.

XRP Price Gears Up For Explosive Move

The analysis shows a substantial initial upsurge in price marked by a green arrow, suggesting a strong bullish momentum that started around early 2017 and peaked later that year. The price action following this peak is what Dark Defender identifies as a bull flag pattern. This pattern is characterized by a period of consolidation following a sharp movement in price, resembling a flag on a pole.

XRP price analysis

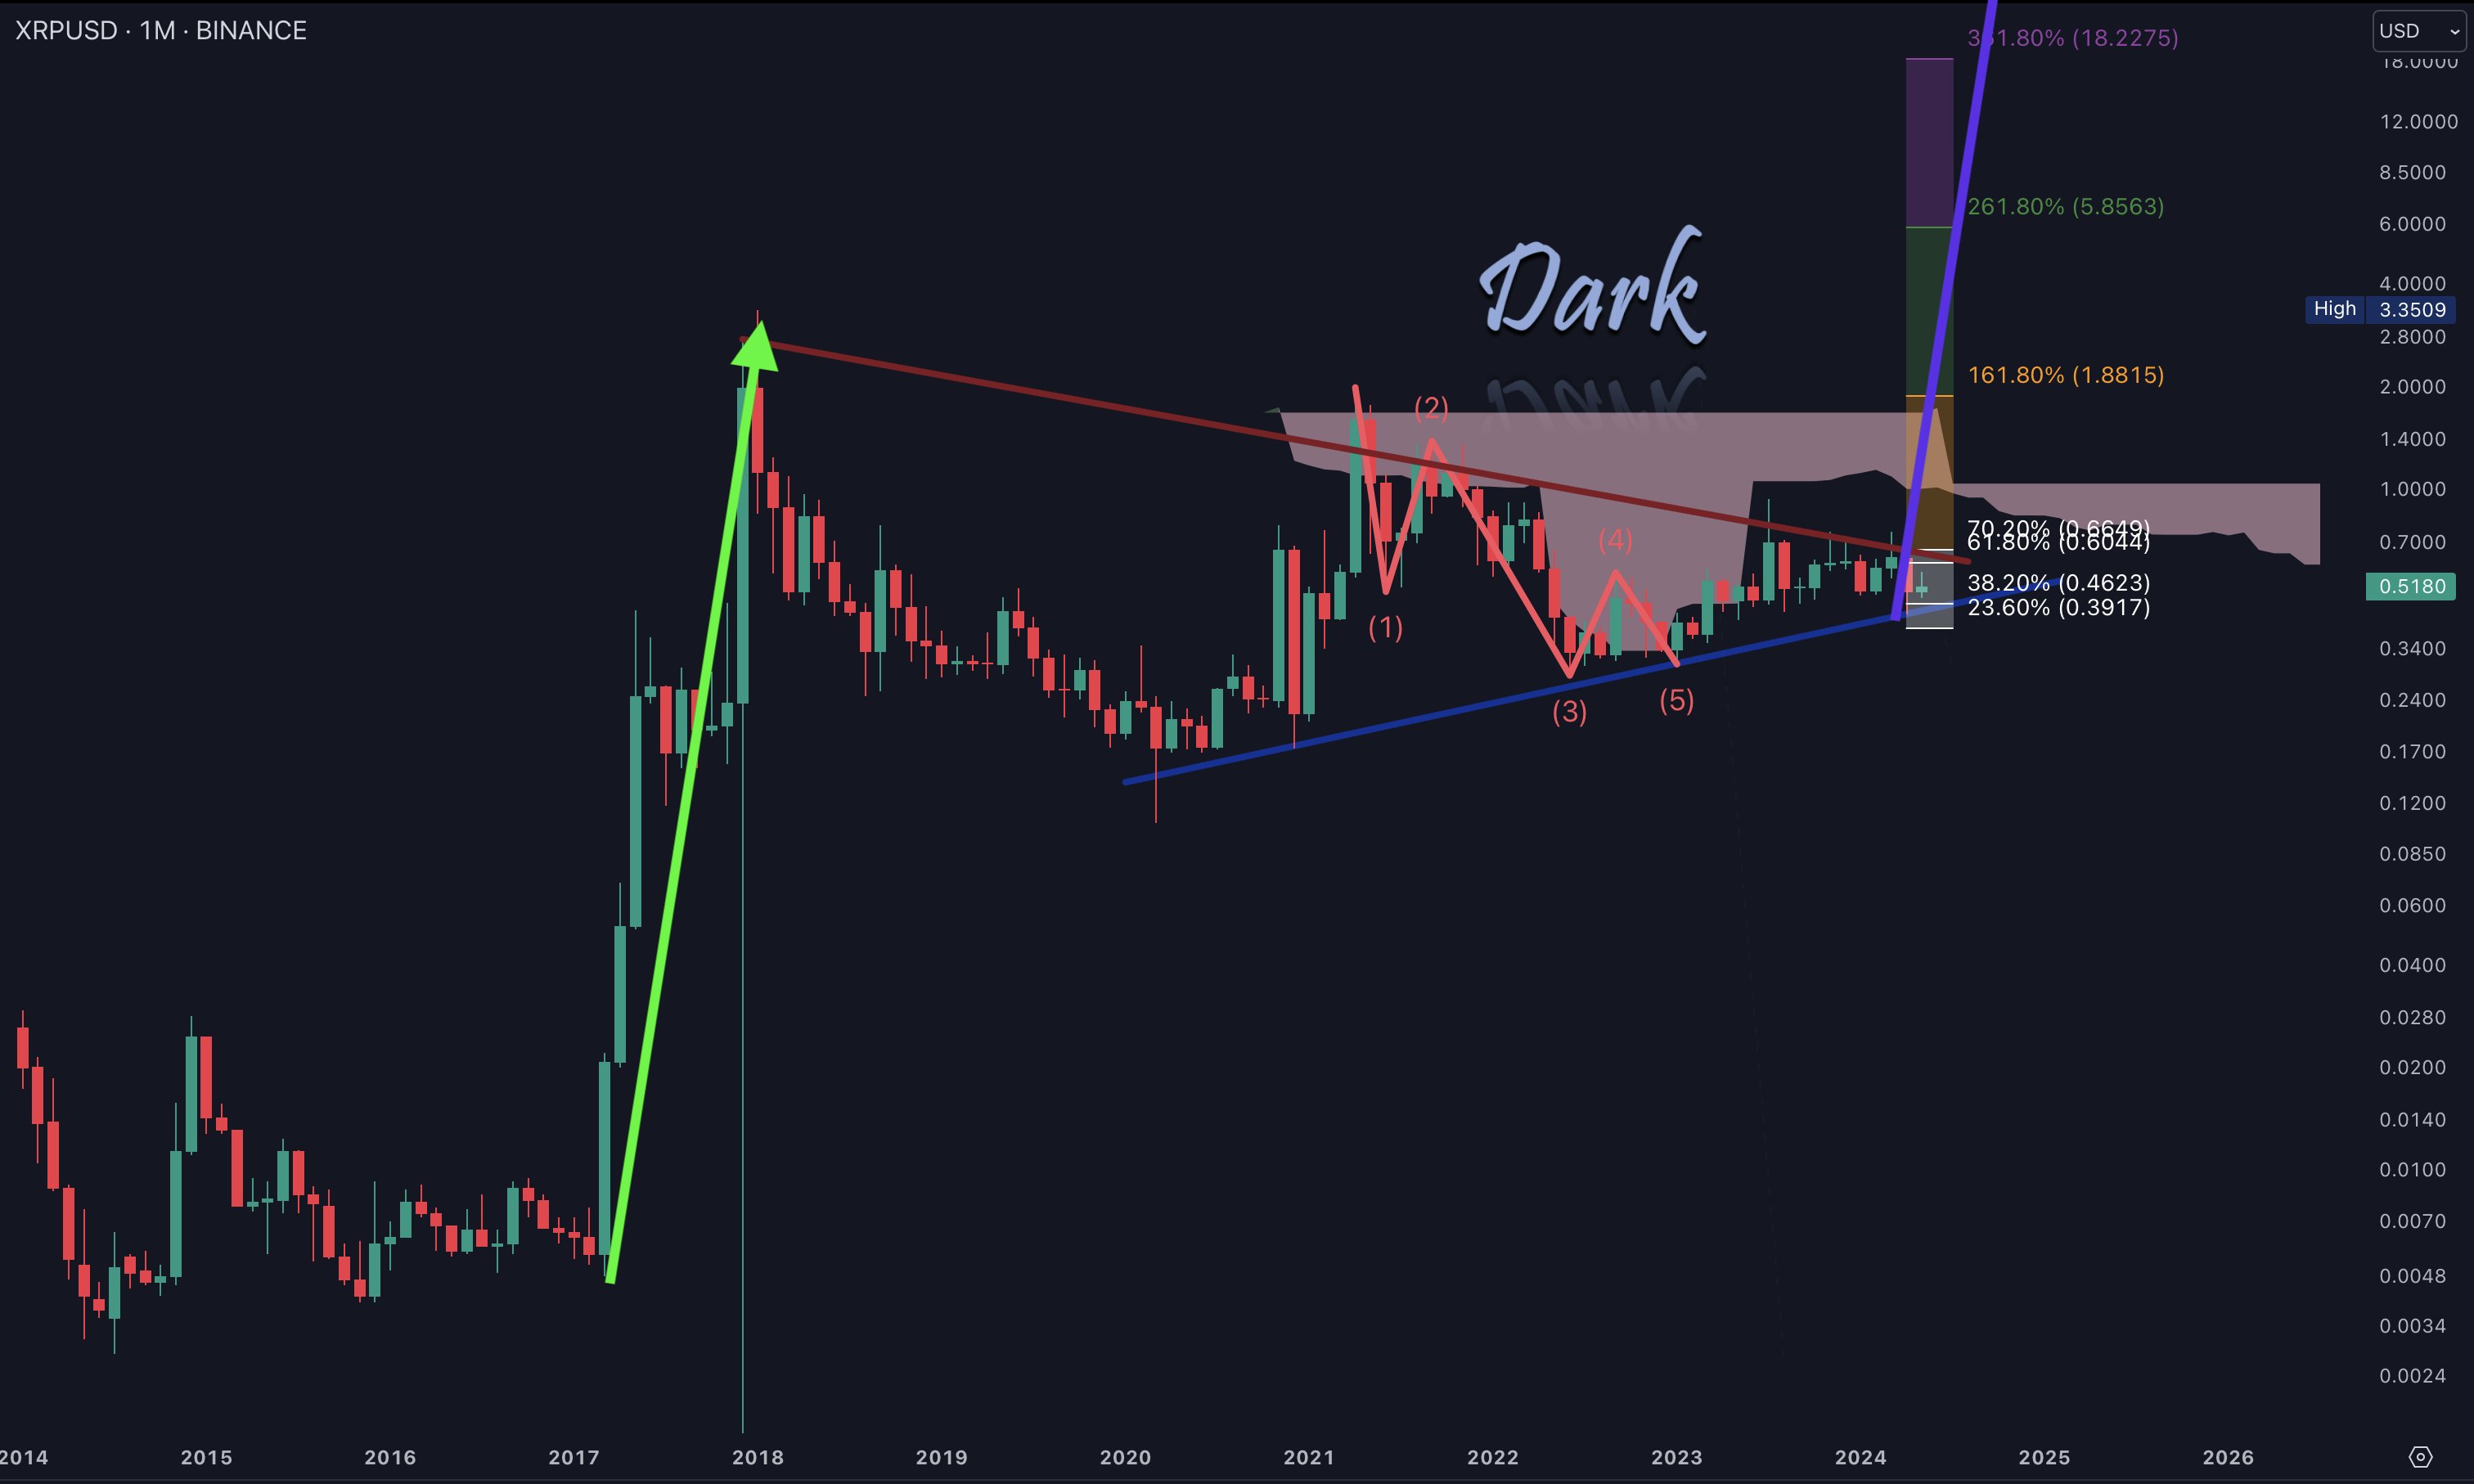
The consolidation, traced with a red descending trend line and a blue ascending trend line, forms a converging pattern known as a triangle, which typically suggests that the period of consolidation is nearing an end as the lines converge. According to Dark Defender, this suggests a breakout is imminent.

“I have read some posts that XRP had a bull flag in the daily time frame, etc. If those are correction bull flags, this is a bull flag, too. But a bullish one. It is in the monthly, three-month, and six-month time frames. If you know a bull flag, you can enjoy your coffee today. Cheers,” he stated.

In his forecast, Dark Defender uses the flag pole and Fibonacci extension levels to predict future price points. After the expected breakout above the red resistance line, the first target is situated at the 161.80% Fibonacci level, which would bring XRP to approximately $1.88. A further ambitious target is set at the 261.80% Fibonacci level, priced at about $5.86.

The most optimistic target lies at the 361.80% Fibonacci level, forecasting the price to soar as high as approximately $18.23. Notably, Dark Defender’s blue line, analogous in length to the flagpole, shows that the XRP price could rise well above $18.

Different Analysis, Similar Price Targets

This analysis was further commented on by another renowned XRP community analyst, EGRAG CRYPTO, who brought attention to the fact that the flag portion of the pattern extends beyond half the length of the initial pole, a structural detail that might typically invalidate the bull flag designation.

“I’ve dabbled in this analysis before, but lately, I’ve become increasingly intrigued by the potential of a symmetrical triangle breakout. What caught my eye is that the Flag is extending beyond half the length of the Pole which invalidates the structure. Regardless of who’s right or wrong, hope to meet in the near future and being multimillionaires. Keep up the fantastic work,” Egrag noted.

Despite this technical caveat, EGRAG CRYPTO remains positive about the potential of a symmetrical triangle breakout. In a recent analysis of the weekly chart, EGRAG elaborated that XRP will at least explode towards $1.5 if price breaks out to the upside of the triangle. On a broader triangle pattern, EGRAG expects a move to $5.89.

XRP price analysis

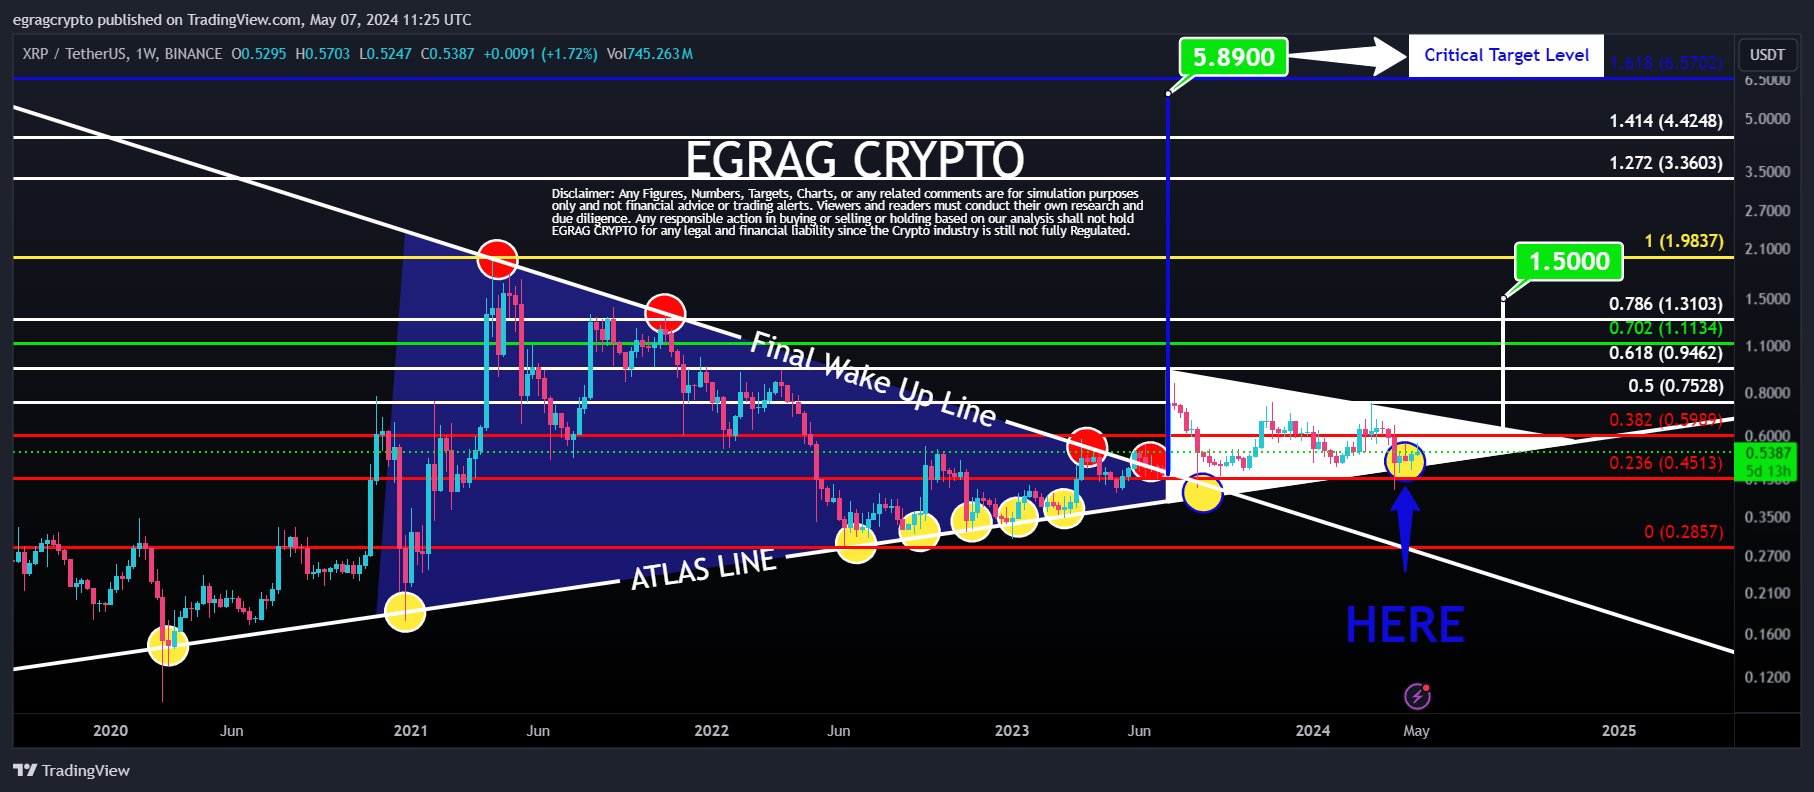
“XRP Army, STAY STEADY! There’s a mini pump to $1.5 and a major pump to $5.89 in the cards, with the MACRO pump potentially soaring above 2 digits,” he stated. Despite their different approaches, the two analysts are therefore very close in their analyses.

At press time, XRP traded at $0.5189.

XRP price

Did A Dogecoin Whale Just Sink The DOGE Ship? The $30-Million Transfer Mystery

Dogecoin (DOGE), the meme-inspired cryptocurrency with a loyal following, has been riding a wave of optimism lately. Over the past week, its price surged by nearly 8%, much to the delight of investors. However, a recent move by a large DOGE holder has cast a shadow of uncertainty on the future of this playful pup’s price trajectory.

Dogecoin Fueled By Market Bulls And Short Squeeze

The broader crypto market sentiment has been bullish recently, and DOGE has been happily wagging its tail along. The past week saw a significant price increase, and the good times seemed to be rolling with a 3% jump in the last 24 hours alone.

This pushed DOGE’s price to a cheerful $0.152, bringing smiles back to the faces of many investors who have been patiently waiting for a sustained climb.

The party wasn’t just limited to the spot market. The derivatives market also saw a notable rise in activity, with Dogecoin Futures open interest jumping a healthy 9%.

This suggests a renewed interest from traders, particularly those looking to capitalize on potential price movements through futures contracts.

Adding fuel to the fire, short sellers have been feeling the heat lately. According to Coinglass, they’ve faced liquidations totaling a staggering $2.27 million.

This could potentially trigger a short squeeze, a scenario where short sellers are forced to buy back DOGE to cover their positions, and further push the price upwards. However, this positive development hinges on whether it can overpower the potential selling pressure arising from a recent whale movement.

Whale Alert: Big Transfer Sparks Speculation

Just as things were looking bright for DOGE, a transaction involving a whale sent ripples of concern through the Dogecoin community. Data from Whale Alert revealed that a whopping 200 million DOGE, valued at around $30.86 million, was transferred to the trading platform Robinhood.

This hefty move has raised eyebrows, with many suspecting the whale might be preparing to cash out a significant portion of their holdings. A large sell-off could introduce significant selling pressure, potentially derailing DOGE’s current upward momentum.

Related Reading: Filecoin On Fire: Analyst Torches Doubters With $15 Target

Technical Analysis: Breaking Trends And Potential Pullbacks

Taking a peek under the hood from a technical standpoint, DOGE appears to be attempting to break its daily downtrend. This is a positive sign for bulls, indicating a potential shift in market sentiment. Further analysis reveals that DOGE recently entered an order block, which has been contributing to its ongoing price increase.

Featured image from War History Online, chart from TradingView

Filecoin On Fire: Analyst Torches Doubters With $15 Target

After a period of correction, Filecoin (FIL) is teasing a potential price surge, buoyed by bullish technical indicators and analyst predictions. As of Friday afternoon, FIL is hovering around $5.80, but whispers of a $15 target in the coming weeks are swirling in the cryptosphere.

Recent Price Surge Ignites Investor Interest

FIL has been on a tear lately, defying the overall slump in the cryptocurrency market. Over the past 24 hours, the token saw an increase of over 7%, accompanied by a healthy trading volume exceeding $420 million. This surge in price and activity has grabbed the attention of market watchers, with many speculating on the possibility of a sustained upward trend.

Analyst Eyes $15: Falling Wedge Breakout Hints At Price Reversal

Adding fuel to the fire is crypto analyst World Of Charts, who has expressed a decidedly bullish sentiment on FIL’s future. According to their analysis, the recent price correction appears to be nearing its end.

They point to a confirmed falling wedge breakout pattern, which historically indicates a potential trend reversal. This technical indicator suggests FIL could be poised for a significant rebound, with World Of Charts setting a target price of $15 in the coming weeks.

FIL’s Resilience Bodes Well For Future

Further bolstering the bullish case is FIL’s defiance of the broader downward trend in the crypto market. While many digital assets have been experiencing significant price drops, FIL has managed to hold its ground. This resilience suggests strong underlying support and potential for future growth.


Filecoin: Technical Indicators Flash Green

Technical analysis also paints a positive picture for FIL. The RSI (Relative Strength Index), a momentum indicator, is currently exhibiting a slow but steady upward trajectory. This suggests that FIL is not overbought and has room for further price appreciation.

Additionally, FIL has historically displayed a pattern of high trading volume at price peaks and low volume during price dips. This ongoing trend signifies strength in the token’s price action.

Breach Of Support Could Dampen Optimism

However, the bullish outlook is not without its caveats. A breach below the crucial $5.50 support level could trigger negative sentiment and potentially lead to a price decline. This highlights the inherent volatility of the cryptocurrency market, where unforeseen events can quickly alter price movements.

Furthermore, market sentiment is highly sensitive to external factors such as regulatory news, macroeconomic trends, and technological developments within the crypto space.

Any adverse developments, such as stringent regulatory crackdowns or security breaches, could exacerbate selling pressure and undermine investor confidence.

Featured image from Wallpapers.com, chart from TradingView

The Hidden Forces Behind Bitcoin Price: Latest Insights From On-Chain Data

Leading on-chain analyst James Check, popularly known as Checkmatey, has recently delved into the intricacies of Bitcoin’s market dynamics, offering a detailed on-chain data analysis that sheds light on the forces driving Bitcoin prices. His latest insights highlight a period he describes as “Quiet and Trending,” suggesting a robust underpinning despite significant sell-side pressures and shifts in volatility.

Bitcoin Follows The Stair-Stepping Rally-Consolidation-Rally Pattern

Since December, Bitcoin has experienced substantial sell-side pressure, with over 1.5 million BTC being sold. “Around 30% of this came out of GBTC, but the rest of it was good old fashioned profit taking,” Check explains.
Despite such substantial market sales, Bitcoin has demonstrated resilience with a relatively modest price correction of just -20%. This suggests that the foundational support levels for Bitcoin are stronger than what surface-level market movements might imply.

Bitcoin bull market drawdowns

A striking aspect of Check’s analysis is the transformation in Bitcoin’s volatility profile. “The overall realized volatility profile for Bitcoin is half what it was in 2021, and 3x smaller than 2017,” states Check. This trend indicates a growing maturity within the Bitcoin market, reflecting its evolution into a more stable asset over time compared to its early years.

Bitcoin Realized Volatility

Check counters the typical narrative surrounding Bitcoin’s volatility: “What a lot of people forget however is that Bitcoin is volatile to the upside. Volatility to the upside is good!” He posits that the current increment in volatility is moderate and suggests that the market is still in the early phases of a bull run, rather than nearing its end.

A critical tool in Check’s analysis is the Short-Term Holder MVRV (STH-MVRV) Ratio, which he uses to gauge market sentiment and phases. According to Check, this ratio consistently finds support at 1.0 and resistance at 1.4 during stable uptrends. Stability is maintained as long as the ratio remains within these bounds. “Only when it breaks above this ceiling do things become unstable,” Check notes, which could signal a transition to bearish conditions.

Short-Term Holder MVRV

Despite the sell-off that brought Bitcoin down to $57k, Check observes that this has not significantly dented the profitability of short-term holders. “The magnitude of Unrealised Loss was very much in line with bull market corrections, calming fears of a top-heavy market.”

He further highlights that several of the local top buyers panic sold their Bitcoin at the lows, an action he interprets as beneficial for the correction phase, serving to stabilize the market by shaking out weak hands.

Expanding his analysis, Check refutes the criticism that Bitcoin’s volatility makes it a less viable asset. He points to a chart comparison of Bitcoin’s 30-day volatility against top-performing US stocks, showing that Bitcoin’s volatility is well within a manageable range.

Furthermore, he discusses the lower realized volatility of the SPY index, attributing it to the “out sized performance of the Magnificent-7,” which is counterbalanced by the poorer performance of the other components.

By highlighting the structural aspects of the current “Quiet and Trending” market phase, Check offers a refined perspective on how Bitcoin is navigating its maturation pathway, balancing between its speculative origins and its potential as a mainstream financial asset.

He concludes, “Overall, the Bitcoin uptrend in 2023-24 looks fairly structured, following stair-stepping rally-consolidation-rally pattern. However, as the charts above show, volatility tends to pick up during a consolidation, and that can lead to instability.”

At press time, BTC traded at $66,288.

Bitcoin price