The waiting time to deploy new validators to the Ethereum network has diminished to just five hours from a peak of 45 days in early June.
China opens industrial park for digital yuan CBDC development in Shenzhen

The government is incentivizing new residents to come develop payment solutions, smart contracts, hard wallets and promotions for the digital yuan.
The SAFER Banking Act Can End Discriminatory Banking Practices
Designed to dismantle barriers to financial services for marijuana businesses, the bill would be beneficial to crypto companies stripped of banking access, says Cody Carbone.
Is Sam Bankman-Fried a Sociopath?
Scroll zkEVM Launches, Blockchain Data Shows, Competing With Polygon, Matter Labs
The new Ethereum layer-2 network’s debut adds to the competition among rival providers of so-called “zkEVMs,” including Polygon and Matter Labs.
Bitcoin Plunge Below $27,000 Drives Investors Into Fear, Will Rebound Occur?
Data shows the Bitcoin drop below the $27,000 level has made most investors fearful for the first time this month.
Bitcoin Fear & Greed Index Is Pointing At “Fear” Right Now
The “fear and greed index” is an indicator that tells us about the general sentiment among investors in the Bitcoin and broader cryptocurrency market. Alternative created the metric, and according to the website, it’s based on these factors: volatility, trading volume, social media sentiment, market cap dominance, and Google Trends data.
The indicator uses a numeric scale from zero to hundred to represent the sentiment. When the index has a value greater than 54, it means that the average investor is greedy right now, while it being under 46 implies a fearful mentality is dominant.
The region between these two thresholds naturally signifies a neutral sentiment among the holders. Until today, the sector had been stuck inside this region since the last couple of days of September, as the investors had been split about the trajectory of Bitcoin.
The chart below shows that the market sentiment has worsened with the latest drop in the cryptocurrency’s price below the $27,000 level.
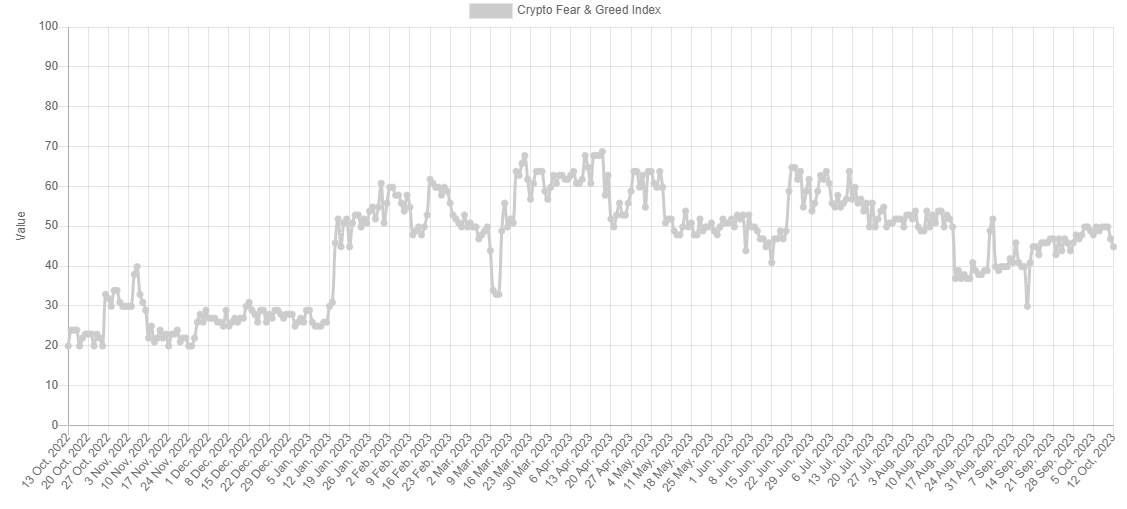
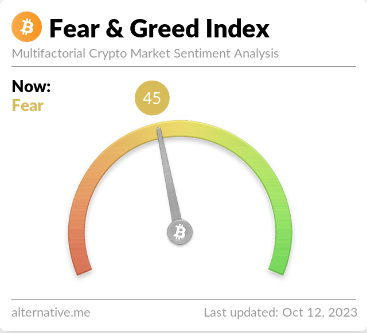
After this latest drop in sentiment, the fear and greed index has hit a value of 45, meaning that investor sentiment has just entered the fear region.
Historically, the market has tended to move in a way that’s opposite to what the majority of the investors believe. The likelihood of such a contrary move happening increases as this imbalance in the sentiment rises.
While the holders are leaning towards one side (fear), the imbalance is small, as the fear and greed index is barely inside the territory. As such, the probability of a rebound would be pretty high right now (at least based on the sentiment).
Besides the core sentiments discussed before, there are also two special zones, called “extreme fear” (at or below values of 25) and “extreme greed” (at or above values of 75).
These regions are where the cryptocurrency has often turned around in the past. Naturally, bottoms have occurred in the former zone, while tops have formed in the latter area.
If the Bitcoin fear and greed index continues declining in the coming days and reaches values near the extreme fear region, a bounce could become a real possibility.
For now, one sign pointing to the chances of a rebound may be that the large investors have been buying recently, as an analyst on X pointed out.
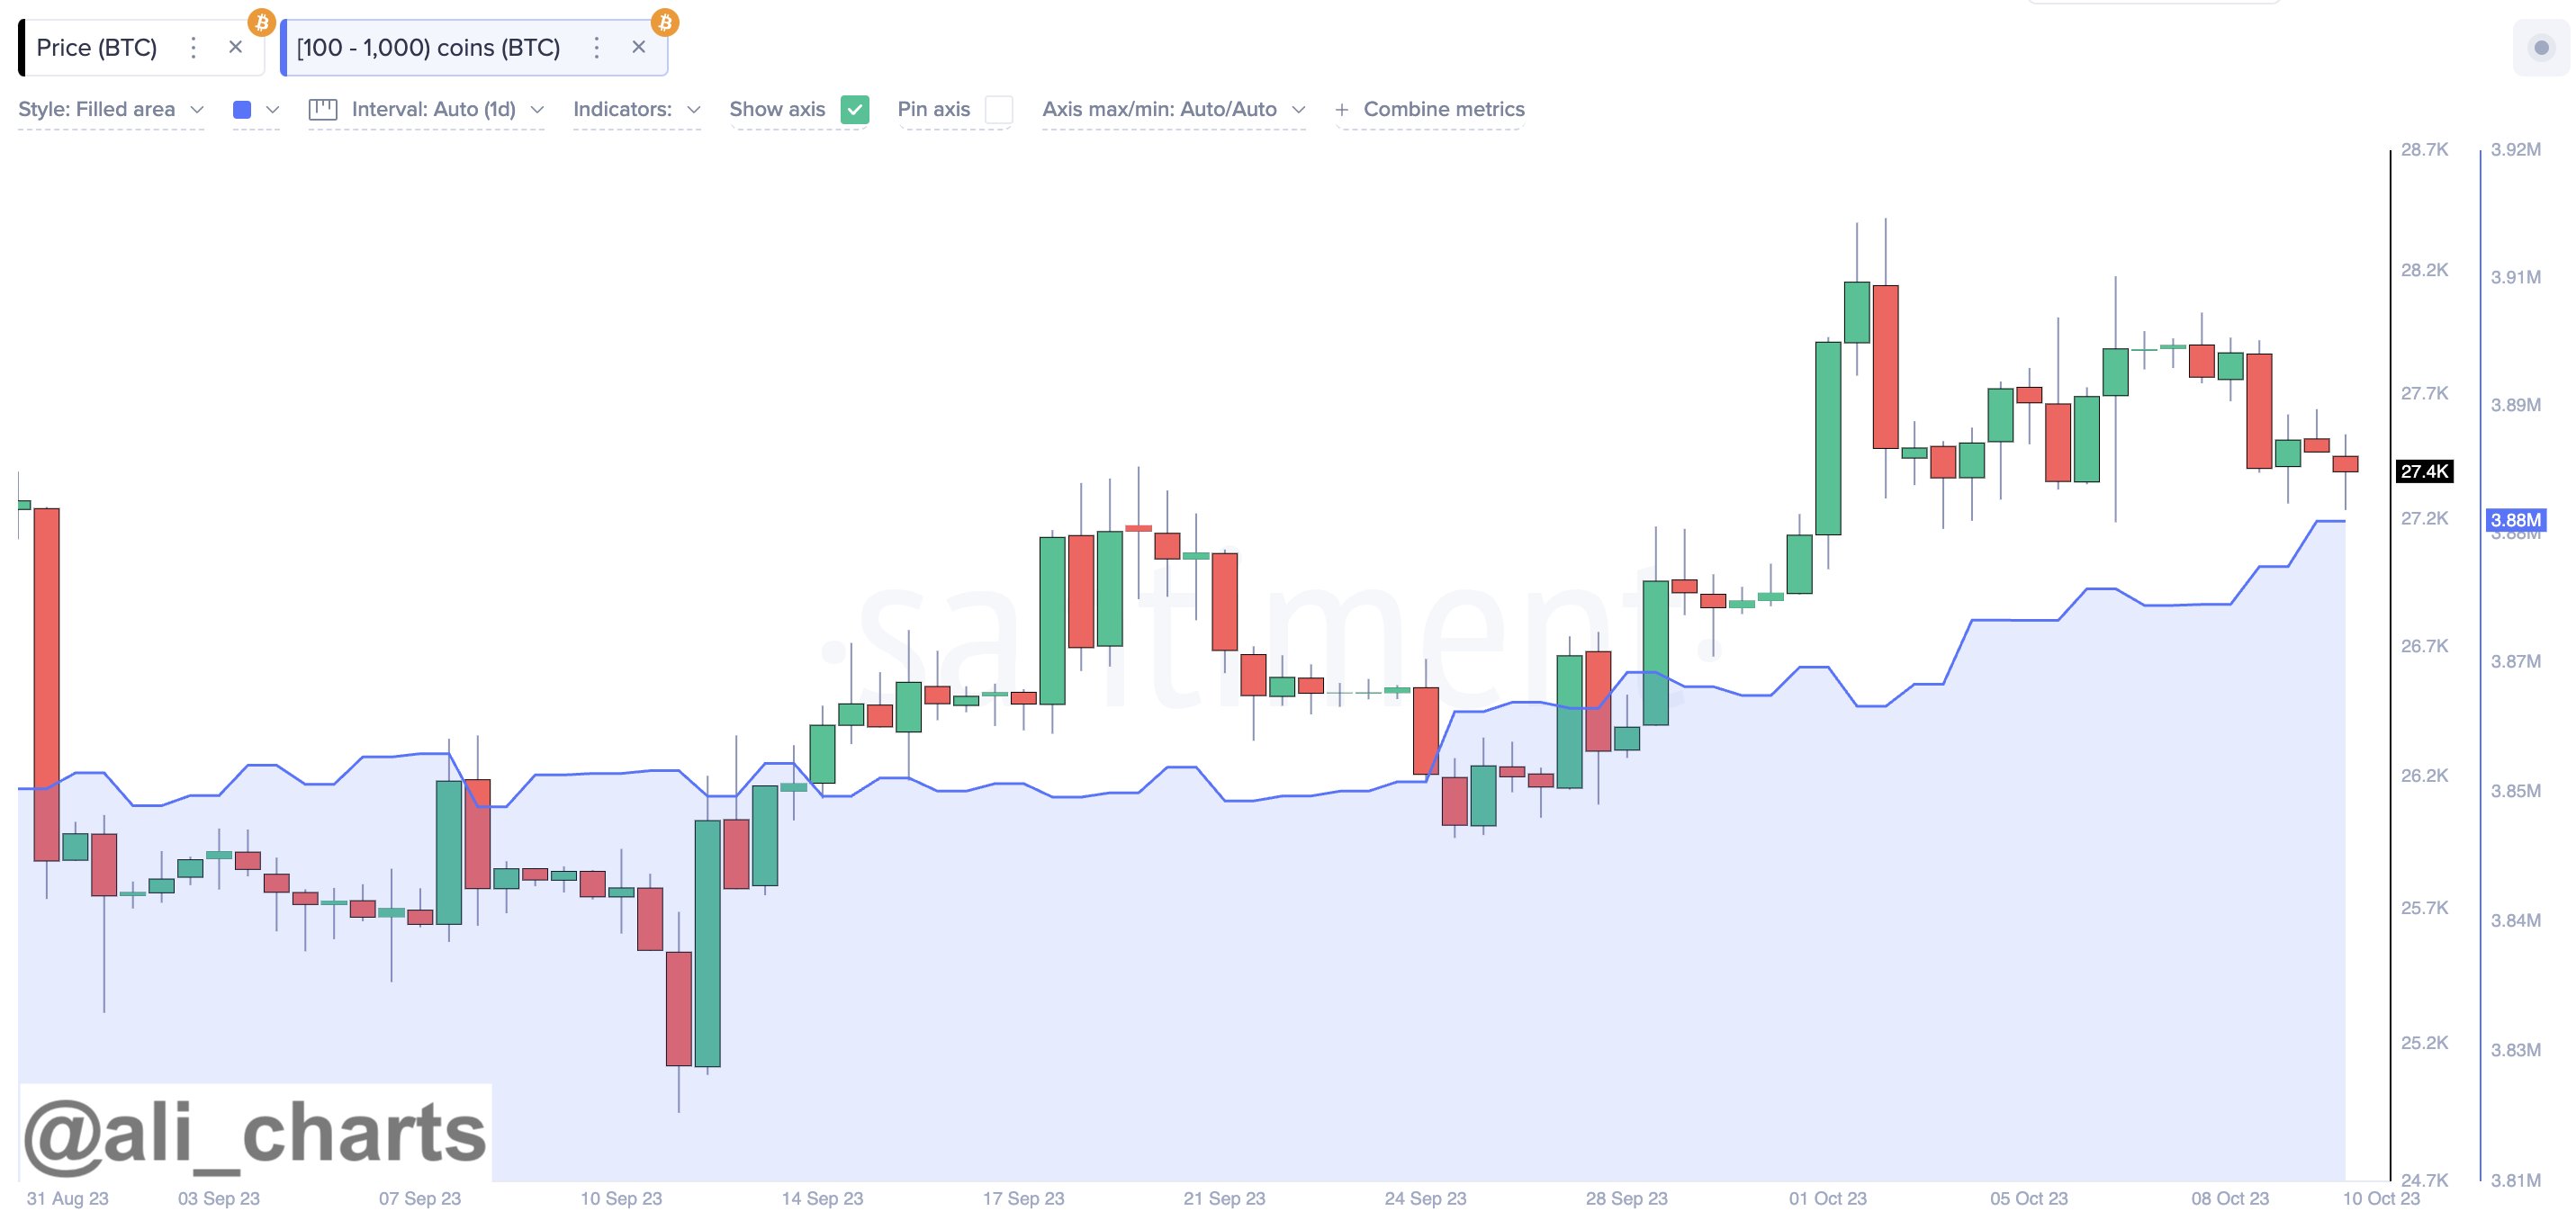
Since the start of October, Bitcoin investors holding between 100 and 1,000 coins have purchased a combined 20,000 BTC worth around $533.6 million at the current exchange rate.
BTC Price
At the time of writing, Bitcoin is trading at around $26,700, down almost 5% in the past week.
Westerners See El Salvador as a Template for a New Monetary System
Voyager Ex-CEO Charged by U.S. Regulators With Fraud, Making False Claims
U.S. regulators have targeted former Voyager Digital CEO Stephen Ehrlich with lawsuits claiming he engaged in fraud and deliberately misrepresented his customers’ government protections.
CFTC and FTC file lawsuits against former Voyager Digital CEO for fraud

The legal action followed reports staff at the CFTC had completed an investigation concluding Stephen Ehrlich violated U.S. derivatives regulations.
What To Expect This Month For XRP Price According To Historical Data
The XRP price has had a rollercoaster growth trajectory which was mostly hindered by the US Securities and Exchange Commission (SEC) filing a lawsuit against Ripple. But a lot of the altcoin’s performances over the months have been rather predictable, and with its history, we can get an idea of what to expect for the XRP price this month.
October Not Looking Good For XRP Price
In a heat map of historical XRP price data generated by NewsBTC, we can see how the month of October has usually gone in the past. The heat map shows XRP’s performance over the last eight years and the figures for October are some of the worst historically.
As shown in the image below, the month of October has historically seen more losses than gains when it comes to the XRP price. In fact, out of the last eight years, only two years have seen October record a positive return for the XRP price.
In the first four years of the altcoin’s life, we can see that the month of October was characterized by losses. Then in the fifth year in 2019, XRP saw its first profitable October with a 14.84% increase. Then from there, there is an alternating trend recorded with one year being profitable and the next being filled with losses.
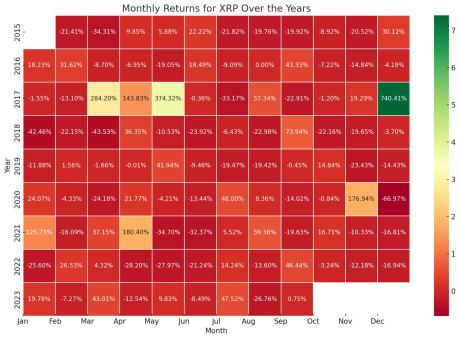
The year 2022 was no different, seeing 3.24% losses after the previous year saw October end with 16.71% gains. So if this holds, it could be that October 2023 would end on a good note. However, as the charts show, this month is already seeing XRP prices fall, so for it to finish strong, there would have to be a massive price reversal. Otherwise, October 2023 could stick to historical performance and end in the red.
October Is Not A Good Month
As shown in this report from Bitcoinist, taking an average of the XRP price performance in October over the years shows that it is not a good month for the altcoin. The chart shared in the report reveals that historically, October is the third-worst month for the cryptocurrency.
The only months that have seen worse performance than October are the months of February with slightly higher loss numbers. Meanwhile, June takes the crown for the month with the worst returns as the last 7 seven years have seen the month end with losses.
On the other hand, December presents as the best month for the XRP price. This is followed by April being the second, with May and March snagging fourth and fifth place, respectively. January, November, and September are also profitable months but to a much lesser degree.
Trezor Unveils New Hardware Wallets, Corrosion-Resistant ‘Keep Metal’ for Recovery
Trezor has produced a hardware wallet with a stripped-back design to appeal to less experienced crypto users, alongside two other new products.
Trader swaps 131k stablecoins for $0 during USDR depeg

An attempt to withdraw USDR stablecoins amid a liquidity crunch appears to have gone horribly wrong.
Crypto for Advisors: Advisors Pivot to On-Chain Support
How can advisors support client interest in digital assets? Thanks to Miguel Kudry from L1 Advisors for taking us through examples in today’s Crypto for Advisors newsletter.
Bitcoin Finds Rejection At This Historical Line, Bear Market Back On?
On-chain data shows Bitcoin has failed in its latest retest of a historically significant metric, a sign that a bearish trend might have taken over.
Bitcoin Has Been Rejected From The Short-Term Holder Cost Basis
As pointed out by an analyst in a post on X, BTC is currently facing resistance at the short-term holder’s realized price. The “realized price” here refers to the cost basis or acquisition price of the average investor in the Bitcoin market.
When the spot price of the cryptocurrency is below this level, it means that the investors as a whole are currently in a state of net loss. On the other hand, the asset being above this metric suggests that the overall market is holding some profits right now.
In the context of the current discussion, the realized price of the entire BTC sector isn’t of relevance, but of only a particular segment: the “short-term holders” (STHs).
The STHs are the investors who purchased their coins within the past 155 days. The members of this group are generally weak in their conviction, and thus, they can be quite reactive to changes in the market.
Now, here is a chart that shows the trend in the Bitcoin realized price specifically for these STHs over the past couple of years:
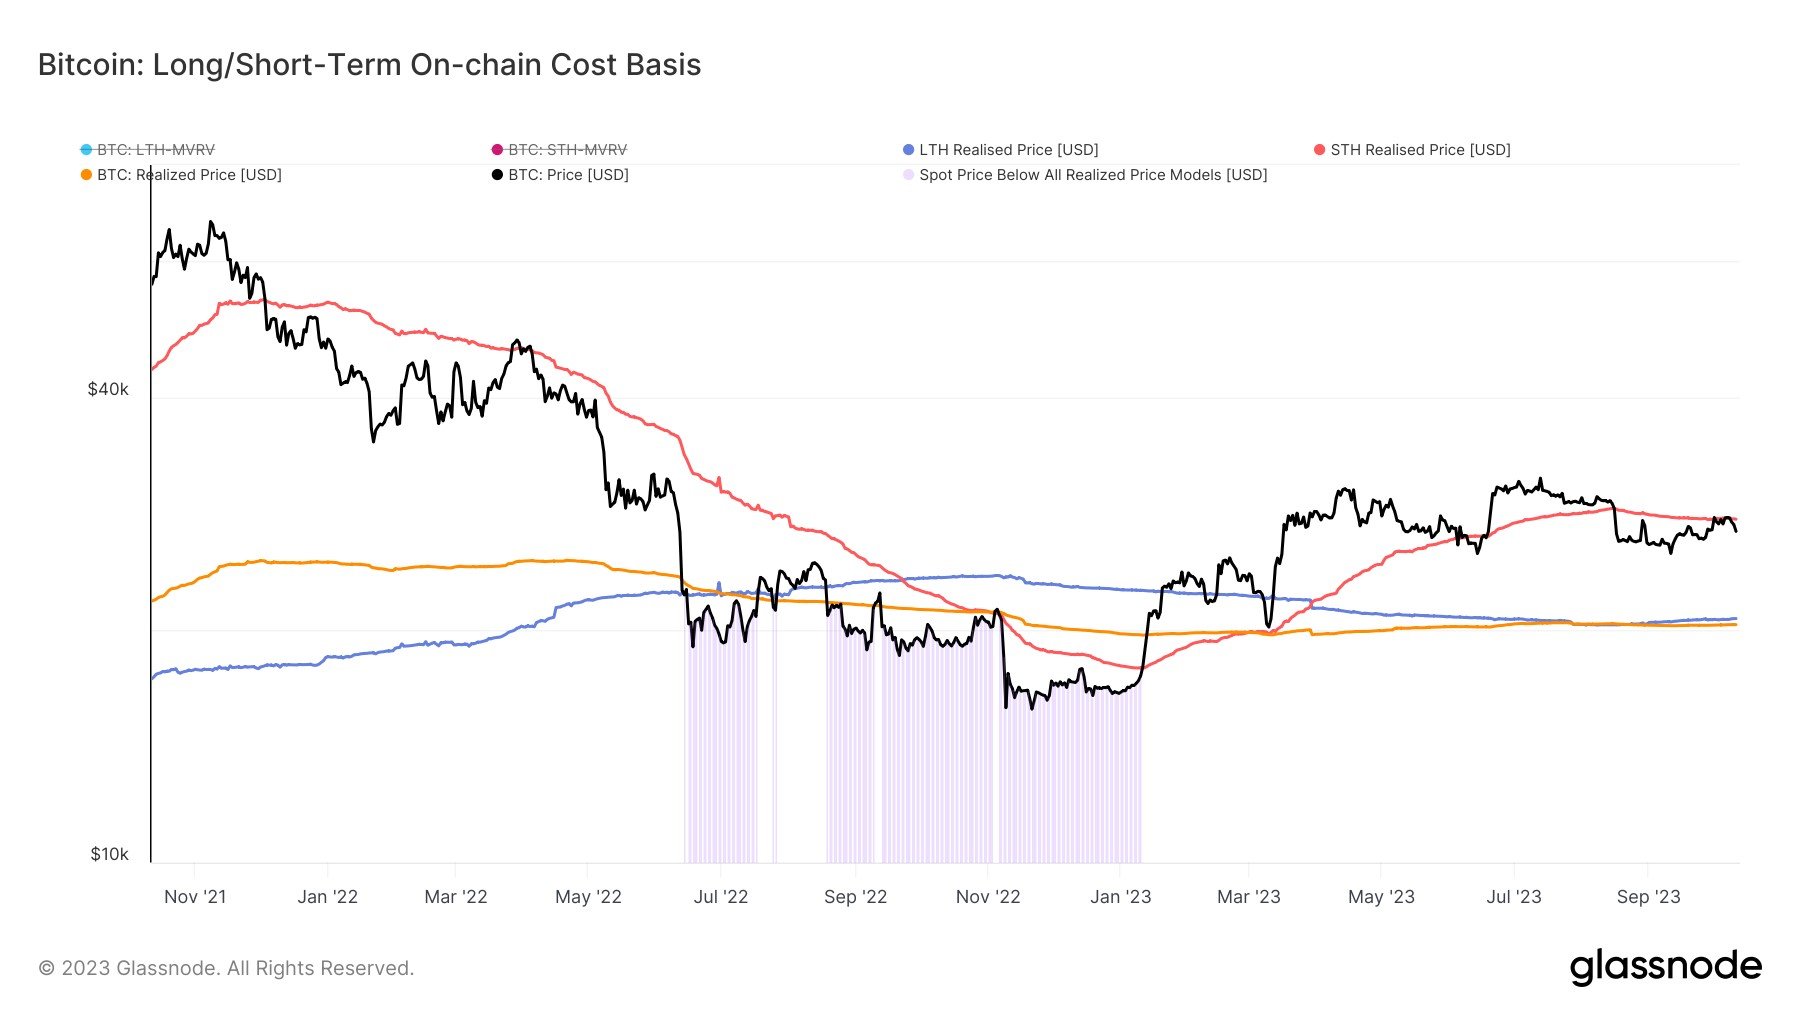
As displayed in the above graph, the Bitcoin short-term holder’s realized price is valued at about $27,800 right now. During its most recent attempt at recovery, BTC retested this line but ended up finding some major resistance at it.
The indicator actually has a lot of history of acting as both resistance and support for the spot price of the cryptocurrency. Generally, this line has helped the asset during bull rallies, while it has impeded it in bear markets.
From the chart, it’s visible that the asset’s price had found resistance at this mark and had remained under it throughout the bear market in 2022. With the rally that started in January of this year, though, the coin had finally managed to find a break.
The realized price of the STHs had then flipped towards being a support level, as it had propelled the asset during the retests in March and June. With the crash in August, however, Bitcoin once again slipped below the line and has been unable to climb back above it since.
Given the significance of the line, the latest retest of the indicator was quite important, so the fact that it ended in failure could be a worrying sign for the asset, as it may mean that a shift back towards a bearish trend might have occurred.
BTC Price
Retests like the one of the STH realized price can sometimes take a while to properly finish, but since Bitcoin has seen a steep decline towards the $26,700 level since the rejection, it may be confirmation that the asset was indeed rejected this time.
Did SBF really use FTX traders’ Bitcoin to keep BTC price under $20K?

Bitcoin sales by FTX come to light as part of the SBF trial, as one prediction suggests that they stopped the BTC price from hitting $100,000.
Mastercard announces successful wrapped CBDC trial results

The experiment demonstrated that CBDCs could be wrapped to purchase NFTs on blockchains such as Ethereum.
FTX hacker moves $120M amid Sam Bankman-Fried trial: Report

Blockchain analytics firm Elliptic didn’t rule out the possibility of the $477 million hack being an FTX inside job.
Stocks across Asia and Europe rise on Economic growth indicators

Stocks across the Asia Pacific region marked a second consecutive day of bullish growth as the European stock market reached a three-week high.
Elon Musk streams, Amazon partners with Immutable, MetalCore preview: Web3 Gamer

X’s new gaming feature, exclusive Q&A with Cronos Labs’ Ella Qiang, Immutable’s cloud titan partner.
XRP Price Could Get A Boost, Dip In This Bitcoin Metric Suggests New Rally
The XRP price continues to trade sideways on low timeframes as the crypto market faces a spike in selling pressure. While major cryptocurrencies will likely bleed into critical support, one analyst believes there is hope for the XRP Ledger native token.
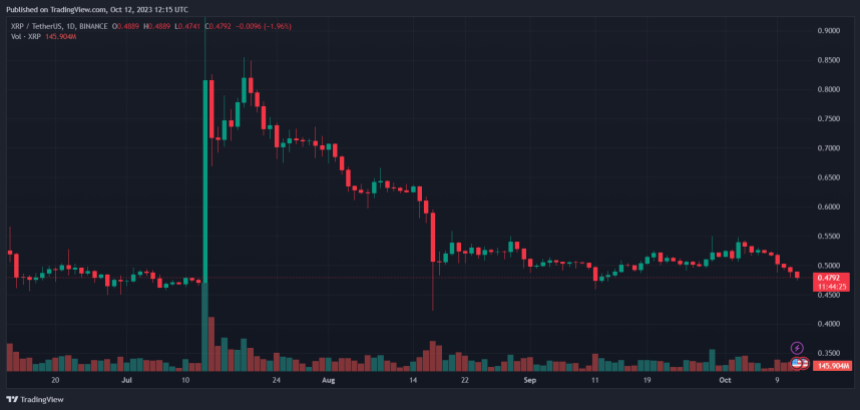
As of this writing, the XRP price trades below the critical psychological level of around $0.5 and stands at $0.47 with a 2% loss in the last 24 hours. Over the previous week, XRP was one of the worst performers, recording a 9% loss.
Bitcoin Dominance Declines, XRP Price Will Come Out On Top?
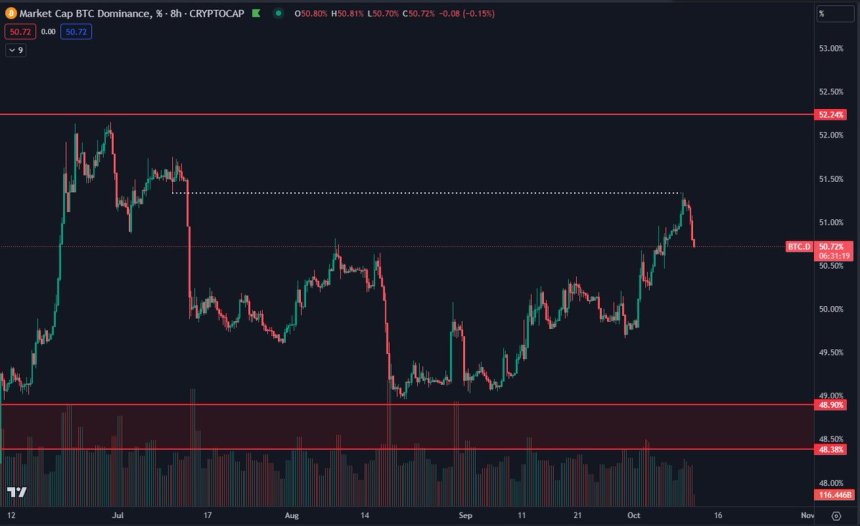
A pseudonym analyst on social media platform X recently shared a chart showing a decline in Bitcoin Dominance (BTC.D). This metric measures the amount of the total crypto market capitalization represented by BTC.
When the Bitcoin Dominance declines, the altcoin sector benefits as the metric suggests investors could move away from the number one crypto into other assets. The analyst indicated that the BTC.D stands at a critical level, facing substantial resistance.
In that sense, the metric could return below 50% of the total crypto market cap. The last time the BTC.D stood at current levels, the XRP price rallied above two major obstacles at $0.60 and then at $0.70. The analyst stated:
$BTC.D Got to the level where the $XRP Lawsuit win news came out. This caused a big altcoin rally at the time and also marked the 2023 top so far for $BTC and many other coins.
Altcoin Season Looming? But Something Needs To Get Out Of The Way
According to this analysis, an altcoin season might be on the horizon for the XRP price and other similar cryptocurrencies. However, the analyst believes the US Securities and Exchange Commission (SEC) needs to decide on the spot Bitcoin Exchange Traded Fund (ETF).
The narrative around this financial product has been gaining influence on the nascent sector, and if the SEC approves it, there will be much less uncertainty around the nascent sector. In the last 24 hours, some movement has been around the spot Bitcoin ETF applications.
This movement coincides with a spike in volatility across the board and could set the stage for fresh news that will trigger the altcoin season or push the XRP price back to critical levels. On the possibility of the SEC approving the ETF, the best scenario for XRP and other token, expert Eric Balchunas said:
(…) very poss there will be a few back and forths with SEC on these small but imp details. So I would not say approval imminent but I would say the fact that issuers are in a “back and forth” w SEC on this is hugely positive IMO.
Cover image from Unsplash, chart from Tradingview


