LINK Price Prediction: Chainlink Needs To Clear $6.25 For Hopes of a Fresh Rally

Chainlink’s LINK price is holding the $5.75 support zone. The price could start a fresh increase if it clears the $6.25 resistance zone.

  • Chainlink token price is showing positive signs above $6.0 against the US dollar.
  • The price is trading above the $6.05 level and the 100 simple moving average (4 hours).
  • There is a key bearish trend line forming with resistance near $6.10 on the 4-hour chart of the LINK/USD pair (data source from Kraken).
  • The price could gain bullish momentum above the $6.25 resistance zone.

Chainlink (LINK) Price Eyes Fresh Recovery

After a major decline, LINK price found support near the $5.75 zone against the US Dollar. A low was formed near $5.74 and the price is now attempting a recovery wave, like Bitcoin and Ethereum.

There was a decent move above the $5.85 and $6.00 levels. LINK is now trading above the $6.05 level and the 100 simple moving average (4 hours). However, there are many hurdles on the upside starting with $6.10. Besides, there is a key bearish trend line forming with resistance near $6.10 on the 4-hour chart of the LINK/USD pair.

The current price action suggests that the price is struggling near the trend line and $6.10. The first major resistance is near the $6.25 zone. It is close to the 23.6% Fib retracement level of the downward move from the $7.91 swing high to the $5.74 low.

LINK Price Prediction

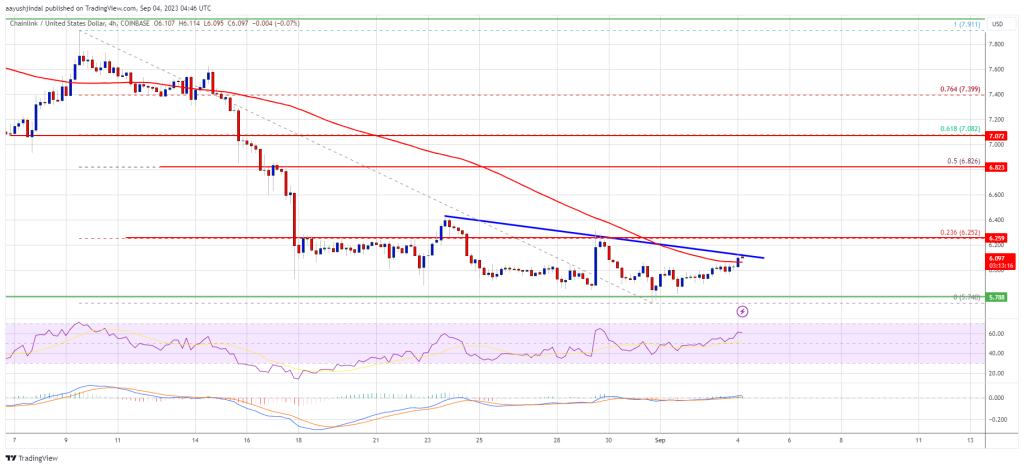
Source: LINKUSD on TradingView.com

A clear break above $6.25 may possibly start a fresh increase toward the $6.65 and $6.80 levels. The next major resistance is near the $7.10 level, above which the price could revisit $7.50.

Another Decline Losses?

If Chainlink’s price fails to climb above the $6.25 resistance level, there could be a downside extension. Initial support on the downside is near the $6.00 level.

The next major support is near the $5.75 level, below which the price might test the $5.60 level. Any more losses could lead the price toward the $5.35 level in the near term.

Technical Indicators

4 hours MACD – The MACD for LINK/USD is losing momentum in the bearish zone.

4 hours RSI (Relative Strength Index) – The RSI for LINK/USD is now above the 50 level.

Major Support Levels – $6.00 and $5.75.

Major Resistance Levels – $6.25 and $6.80.

Ethereum Bears Hold Strong – Why ETH Could Resume Downtrend Below $1,600

Ethereum price tested the $1,600 zone and is currently recovering against the US Dollar. ETH is facing many hurdles near $1,650 and $1,670.

  • Ethereum started a recovery wave from the $1,600 support level.
  • The price is trading below $1,650 and the 100-hourly Simple Moving Average.
  • There is a connecting bearish trend line forming with resistance near $1,665 on the hourly chart of ETH/USD (data feed via Kraken).
  • The pair could start a fresh increase unless there is a close above the $1,700 level.

Ethereum Price Faces Key Resistance

Ethereum’s price extended its decline below the $1,650 support zone. ETH price even spiked below the $1,620 and tested the $1,600 handle, like Bitcoin.

A low was formed near $1,600 and the price recently started an upside correction. There was a move above the $1,620 and $1,630 levels. The price climbed above the 23.6% Fib retracement level of the downward move from the $1,748 swing high to the $1,600 low.

Ether is still trading below $1,650 and the 100-hourly Simple Moving Average. Besides, there is a connecting bearish trend line forming with resistance near $1,665 on the hourly chart of ETH/USD.

On the upside, the price might face resistance near the $1,650 level and the 100 hourly SMA. The next resistance is near the $1,660 level and the trend line. It is close to the 50% Fib retracement level of the downward move from the $1,748 swing high to the $1,600 low.

Ethereum Price

Source: ETHUSD on TradingView.com

A close above the $1,665 level might send the price toward the $1,700 zone. To start a fresh increase, Ethereum must settle above the $1,700 pivot level. The next resistance might be near $1,750. Any more gains might send the price toward the $1,800 resistance.

Another Decline in ETH?

If Ethereum fails to clear the $1,665 resistance, it could start another decline. Initial support on the downside is near the $1,630 level.

The first key support is close to $1,600. The next major support is near the $1,580 level. If there is a downside break below $1,580, the price could extend its decline toward the $1,540 level. Any more losses might send the price toward the $1,480 level in the near term.

Technical Indicators

Hourly MACDThe MACD for ETH/USD is losing momentum in the bearish zone.

Hourly RSIThe RSI for ETH/USD is now above the 50 level.

Major Support Level – $1,600

Major Resistance Level – $1,665

Bitcoin Price Recovery Could Soon Fade If BTC Fails To Surpass 100 SMA

Bitcoin price tested the $25,350 zone and is currently recovering. BTC must clear the $26,200 resistance to start a decent increase in the near term.

  • Bitcoin is attempting a recovery wave from the $25,350 zone.
  • The price is trading below $26,200 and the 100 hourly Simple moving average.
  • There was a break above a major bearish trend line with resistance near $26,000 on the hourly chart of the BTC/USD pair (data feed from Kraken).
  • The pair could start a decent increase if it clears $26,200 and the 100 hourly SMA.

Bitcoin Price Faces Hurdles

Bitcoin price remained in a bearish zone below the $27,000 resistance zone. BTC extended its decline and traded below the $26,000 level. There was also a spike below $25,500 and the price tested $25,350.

A low was formed near $25,333 and the price is now attempting a recovery wave. There was a minor increase above the $25,800 resistance. The price climbed above the 23.6% Fib retracement level of the downward move from the $28,150 swing high to the $25,333 low.

Besides, there was a break above a major bearish trend line with resistance near $26,000 on the hourly chart of the BTC/USD pair. However, Bitcoin is still trading below $26,200 and the 100 hourly Simple moving average.

Immediate resistance on the upside is near the $26,200 level and the 100 hourly SMA. The first major resistance is near the $26,750 level or the 50% Fib retracement level of the downward move from the $28,150 swing high to the $25,333 low.

Bitcoin Price

Source: BTCUSD on TradingView.com

The main resistance is now forming near the $27,000 level. A clear move above the $27,000 level might send the price toward $27,500. The next major resistance is near $28,000, above which there could be a decent upward move. In the stated case, the price could test the $28,800 level.

Another Decline In BTC?

If Bitcoin fails to clear the $26,200 resistance, it could start another decline. Immediate support on the downside is near the $25,650 level.

The next major support is near the $25,350 level. A downside break below the $25,350 level might send the price further lower. In the stated case, the price could drop toward $24,800.

Technical indicators:

Hourly MACD – The MACD is now losing pace in the bearish zone.

Hourly RSI (Relative Strength Index) – The RSI for BTC/USD is now above the 50 level.

Major Support Levels – $25,650, followed by $25,350.

Major Resistance Levels – $26,200, $26,750, and $27,000.

Bitcoin Futures Frenzy Fizzles Out As Price Plunges Below $26,000

The crypto market has lost its sparkle lately, with bitcoin futures trading volume drying up as the flagship cryptocurrency struggles to stay afloat. 

Bitcoin futures open interest, which measures the buzz around upcoming contracts, has dropped to a 5-month low of $11.3 billion, according to data from Glassnode. This suggests traders are closing out positions and reducing exposure to volatile crypto assets. 

Bitcoin’s Struggles Below $26K: Is The Crypto Craze Losing Steam?

The disinterest comes as bitcoin prices dropped below $26,000 for the first time since August, dampening spirits across the crypto sphere. 

“It seems the market is running out of steam,” said Lee Reiners, professor of cryptocurrency law at Duke University. “Investors are realizing these assets don’t just go up forever.”

Analysts said that the drop in open interest appears related to the expiration of monthly and quarterly futures contracts, which drained trading activity and liquidity.

But the decline also signals fading confidence in Bitcoin’s upside potential amid mounting regulatory scrutiny, environmental backlash, and competition from alternative cryptos like ether.  

“The promise of quick riches that lured many retail investors now seems a distant dream,” said Jamie Dimon, CEO at JP Morgan. “The crypto craze appears to be losing momentum fast.”

Bitcoin has struggled to regain traction since its record high of nearly $69,000 in November 2021. Though some crypto bulls remain hopeful, continued lackluster performance could stall wider adoption.

BTCUSD

Exploring The Factors Behind Bitcoin’s Declining Fortunes

One significant factor is the regulatory scrutiny that has intensified worldwide. Governments and financial authorities are increasingly concerned about the potential risks associated with cryptocurrencies, including money laundering and tax evasion. This regulatory uncertainty has made some investors wary and hesitant to enter or remain in the market.

Bitcoin has faced backlash due to its environmental impact. Critics argue that the energy-intensive process of mining Bitcoin is unsustainable and contributes to carbon emissions. As environmental concerns take center stage, some investors and institutions may reevaluate their support for Bitcoin in favor of more environmentally friendly cryptocurrencies.

While Bitcoin pioneered, newer cryptocurrencies like Ethereum have gained traction, offering innovative features such as smart contracts and decentralized applications. These alternatives have attracted both developers and investors, diverting attention away from Bitcoin.

Bitcoin’s Future: Crossroads For The Original Crypto

For diehard believers, bitcoin’s funk may present a buying opportunity if prices continue drifting lower. But others argue that “digital gold” has lost its luster for good.

“It’s yet to be seen whether Bitcoin can reclaim its role as the crypto market’s flagship,” said Chen Alicia, a student of blockchain studies at NYU.

With futures interest shrinking, bitcoin is at a crossroads. Does the original crypto still have a bright future, or will up-and-comers displace it?

GALA Sinks 72% In 2023 Alone – Blame Internal Wrangles And Lawsuits?

GALA, the native token of Gala Games, is under immense selling pressure as of early September 2023. Trackers show that the token is down 72% from 2023 peaks when it soared to $0.062 in late January 2023. From there, the token has been edging lower, sinking to $0.017 at spot rates, unwinding over 95% of gains posted in early 2023. To illustrate, GALA is cents away from retesting all-time lows registered in late 2022 at around $0.016.

GALA price on September 3| Source: GALAUSDT on Binance, TradingView

GALA Plunging

The drawdown could be pinned to the unfavorable market-wide bear market conditions that have seen top coins, including Bitcoin and Ethereum, surge before dumping, dragging altcoins even lower. The slowdown across Bitcoin has been mirrored in GALA as the token edges lower, reversing gains posted on August 29. 

On this day, Bitcoin rose after a US Court of Appeal ruled in favor of Grayscale, the issuer of GBTC. Even though the court didn’t direct the Securities and Exchange Commission (SEC) to convert GBTC trust to an exchange-traded fund (ETF), the judge didn’t provide clear reasons why they denied Grayscale’s request. BTC prices rallied as odds of the US approving a spot Bitcoin ETF rose, lifting altcoins, including GALA. However, bears have successfully peeled back losses, as the daily chart shows.

CEO Versus Co-Founder

Beyond market factors, GALA may plunge to all-time lows primarily because of internal wrangles that could heap more pressure on the token that’s already struggling against unrelenting bears. Court documents show that CEO Eric Schiermeyer and co-founder Wright Thurston filed lawsuits against each other. 

Filings show that Schiermeyer blames the co-founder for illegally obtaining and selling $130 million of GALA. The CEO also claims the co-founder stole node licenses for operating nodes within the Gala game ecosystem. He also cites Thurston’s history of founding companies that often in bankruptcy. The CEO wants the co-founder replaced as director.

The co-founder and his investment vehicle, True North Investments, accuse the CEO of wasting millions of dollars in company assets and engaging in fraudulent practices that harmed the company. The co-founder claims the CEO misused millions, including $600 million of assets, and lending millions of dollars from Gala Games to himself. They also alleged that the CEO created entities in Switzerland and Dubai that, in reality, should belong to Gala Games. The co-founder wants to kick out the CEO, who has held the office since 2021.

XRP Whales On The Move Again, As Altcoin Records Significant Utility Spikes

In the last 48 hours, the XRP market has witnessed a significant amount of large-scale transactions, drawing much attention from the general crypto space. According to data from blockchain tracker Whale Alert, XRP whales conducted transactions involving over a billion XRP on Friday, September 1. 

Ripple Transfers 75 Million XRP To Unknown Wallet In Whale Buying Spree

Through a series of posts by Whale Alert on social media platform X (formerly Twitter), it can be inferred that the XRP market witnessed four major whale transactions. 

The biggest of these transactions was the transfer of 424,354,912 XRP – valued at $214,293,666 – from one unknown wallet to the other. In this context, unknown wallets refer to addresses with no affiliation to a crypto exchange. 

Furthermore, there was the move of XRP, 19,920,318 XRP worth $10,167,904, from another unknown wallet to the Binance exchange. It was also noted that a whale transferred 66,666,659 XRP, worth $33,065, 809 from an unknown wallet to the Binance exchange. 

However, the most notable transaction that caught most traders’ eye came from Ripple, the company behind the XRP cryptocurrency. 

Whale Alert reported that Ripple transferred 75,000,000 XRP, worth $37,058,145, from its Binance wallet to an unknown wallet. 

Following this move, some crypto enthusiasts believe that this particular unknown wallet also belongs to Ripple, as the company could be intending to soon offload those tokens on an exchange. This speculation has led to most investors predicting an incoming market dump. 

Ripple also conducted other transactions on September 1, locking about 800,000,000 XRP in escrow. 

However, this does not raise any concern as the crypto payment firm is known to release 1,000,000,000 XRP at the start of every month before proceeding to lock up about 80% of the new tokens a few hours later. 

XRP Records 7-Month Highest Transaction Volume Among Other Positives

Following the massive transactions in the XRP market, on-chain analytics firm Santiment has provided a report highlighting some of the effects of these whale movements.

According to an X post on September 1, Santiment reports an on-chain transaction volume of 4.8 billion XRP, marking the seven highest value of this metric in the XRP market over the last seven months. 

The analytics firm also noted that there are currently about 2.03 billion XRP in circulation, representing the token’s highest-circulating supply since May 31. In addition, XRP development activity was also reported to be on the high side.

At the time of writing, XRP still finds itself struggling amid a general market downturn. The fifth-largest cryptocurrency trades at $0.4983 with a 1.88% loss in the last day, according to data from CoinMarketCap.

XRP whale

Crypto Analyst’s September Warning: Bitcoin Faces A Red Month

In a recent video by renowned cryptocurrency analyst Benjamin Cowen, ominous predictions for Bitcoin performance in September have emerged. Cowen, known for his data-driven approach to cryptocurrency analysis, shared his insights regarding Bitcoin’s historical performance in September and its potential trajectory for the current year.

Cowen acknowledged that September has traditionally been a challenging month for BTC, often characterized by negative price movements. He emphasized that while historical trends suggest a red month for Bitcoin in September, there are no guarantees, and occasional green September does occur.

The analyst highlighted that Bitcoin had experienced six consecutive red September from 2017 to 2022. The average return for Bitcoin in September has historically been around -6.6%, with a standard deviation that adds to the unpredictability of the cryptocurrency’s performance.

Examining Potential Price Declines

Cowen then delved into the potential price decline for Bitcoin in September. Given Bitcoin’s opening price of just below $26,000 for the month, a 7% decrease would bring its value to approximately $24,000. He further pointed out that in the pre-halving year of 2019, Bitcoin witnessed a 14% drop in September, potentially pushing its price down to $22,000.

To bolster his argument, Cowen referred to a recent tweet in which he speculated a substantial chance of Bitcoin reaching $23,000 in September. Although he stressed that this prediction is far from a guarantee, he underscored the seasonal pattern, the downward momentum, and the recent monthly close below certain support levels as factors that make a dip to $23,000 plausible.

Moreover, Cowen discussed the average returns in all pre-halving years for the month, revealing a drop of approximately 17.7%, which could result in Bitcoin trading at around $21,500 if history repeats itself.

On August’s performance, Cowen noted that Bitcoin had already experienced a 10% drop. While August’s long-term average is approximately 21%, averaging only the last two pre-halving years (2015 and 2019) suggests a more modest -11% to -12% average drop. This highlights that Bitcoin may follow a similar pattern in September, potentially softening the blow to around $24,000.

The current price of Bitcoin (BTC) is  $25,813, with a 24-hour price change of -0.99%. As the leading cryptocurrency, Bitcoin commands a significant market cap of $502,654,681,515, securing its position as the number one cryptocurrency by market capitalization. In the past 24 hours, Bitcoin has experienced a trading volume of $17,603,174,408, making it the second most actively traded cryptocurrency by volume. This high trading volume indicates strong interest and activity within the Bitcoin market, contributing to its liquidity.

BTCUSD chart

Navigating Bitcoin’s Cyclical Nature

Cowen emphasized that despite the uncertainty, the seasonality of Bitcoin and the existing downward momentum make a test of the $23,000 level highly likely in the near future, possibly in September or October.

Cowen reflected on the cyclical nature of Bitcoin’s price movements in a broader context, stating that it often alternates between bullish and bearish phases. He stressed that during pre-halving years, Bitcoin tends to rise significantly during the first half and experience declines in the latter half. According to Cowen, this pattern is designed to “wreck” both bulls and bears before entering a period of sustained growth.

He also pointed out that while BTC may face challenges in the short term, once quantitative easing (QE) returns and the cryptocurrency market sentiment improves, altcoins could regain momentum.

In conclusion, Cowen cautioned his audience to remain vigilant in September, historically a month of red returns for Bitcoin. He urged caution, citing past data and market dynamics as indicators of a potentially challenging month ahead. While the future remains uncertain, Cowen’s data-driven analysis serves as a valuable resource for those navigating the turbulent waters of the cryptocurrency market. Investors and enthusiasts will undoubtedly watch closely to see if Bitcoin’s performance aligns with his predictions in the coming weeks and months.

Bitcoin Whales Load Up With $1.5 Billion Worth Of BTC Amidst Price Uncertainty

Bitcoin whales, entities holding a substantial portion of the Bitcoin supply, have ignited speculation within the cryptocurrency realm by amassing more than a billion worth of BTC in mere two weeks.

Data from crypto analytics firm IntoTheBlock reveals a significant uptick in the accumulation of Bitcoin by addresses holding at least 0.1% of the total BTC supply, valued at over $500 million each. These entities collectively added a staggering $1.5 billion to their holdings during the final two weeks of August. 

This surge in accumulation coincides with the excitement surrounding the potential introduction of a spot Bitcoin ETF in the United States. This substantial accumulation of Bitcoin by crypto whales serves as a clear testament to their growing confidence and heightened interest in the cryptocurrency, irrespective of recent price oscillations and regulatory ambiguities. 

Bitcoin Price Upsurge Amidst ETF Speculation

The chronology of this accumulation is particularly captivating. While Bitcoin’s price experienced a dip, it experienced a transitory resurgence subsequent to a pivotal court ruling linked to Grayscale’s pursuit of a spot Bitcoin ETF. The verdict translated into a price upswing exceeding $2,000, propelling the alpha coin to a two-week zenith, slightly exceeding the $28,000 threshold.

Nevertheless, just as the cryptocurrency community was poised for jubilation and pinned hopes on the ETF’s ratification, the US Securities and Exchange Commission (SEC) introduced an unexpected regulatory twist. A

dopting a circumspect stance, the regulatory authority deferred its verdict on all active Bitcoin ETF applications. Consequently, Bitcoin relinquished all its gains stemming from the brief rally triggered by the Grayscale ruling, regressing below the $26,000 mark.

Institutional Optimism Amidst Ambiguity

The current BTC price is $25,808.30 according to CoinGecko, with a 24-hour decline of 0.8% and a seven-day loss of 0.9%.

Despite the recent tumultuous price fluctuations and the ambiguity clouding the cryptocurrency market’s regulatory landscape, the continual accumulation of Bitcoin by crypto whales implies that institutional investors are cultivating an increasingly sanguine outlook regarding Bitcoin’s long-term prospects.

The prospect of a Bitcoin ETF, promising a regulated and accessible entryway for mainstream investors, persists as a game-changing possibility that could significantly reshape the crypto outlook in the United States and beyond.

While the cryptocurrency community anticipates further developments and regulatory determinations, the conduct of these crypto whales functions as a tangible gauge of swelling institutional interest in Bitcoin, fortifying the belief in its enduring value and pertinence. 

These crypto whales wield not only the power to sway the market but also reflect the sentiment and perspective of dominant participants within the dynamic domain of cryptocurrencies.

Featured image from VOI