SOL Price Prediction: Solana Could Soon Surge Past $25

Solana is attempting a fresh increase above the $25 resistance against the US Dollar. SOL price rally toward $30 if there is a close above $25.65.

  • SOL price is showing positive signs above the $23.80 level against the US Dollar.
  • The price is now trading above $24 and the 100 simple moving average (4 hours).
  • There was a break above a major bearish trend line with resistance near $23.10 on the 4-hour chart of the SOL/USD pair (data source from Kraken).
  • The pair could continue to move up if it clears the $25.65 resistance zone.

Solana Price Starts Fresh Increase

After a steady decline, Solana’s price found support near the $22.20 zone. SOL traded as low as $22.22 and recently started a fresh increase, unlike Bitcoin and Ethereum.

The price climbed above the $23.20 and $24.00 resistance levels. There was a break above a major bearish trend line with resistance near $23.10 on the 4-hour chart of the SOL/USD pair. The pair climbed above the 50% Fib retracement level of the downward move from the $25.65 swing high to the $22.22 low.

SOL is now trading above $24 and the 100 simple moving average (4 hours). On the upside, immediate resistance is near the $24.85 level. It is near the 76.4% Fib retracement level of the downward move from the $25.65 swing high to the $22.22 low.

SOL Price Prediction

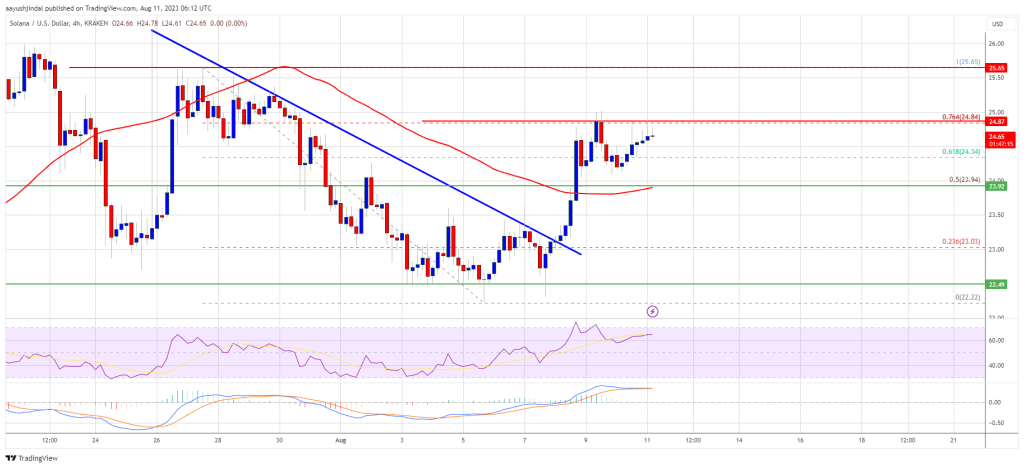
Source: SOLUSD on TradingView.com

The first major resistance is near the $25.65 level. A clear move above the $25.65 resistance might send the price toward the $28.80 resistance. Any more gains might send the price toward the $30 level.

Are Dips Limited in SOL?

If SOL fails to clear the $25.65 resistance, it could start a fresh decline. Initial support on the downside is near the $24.00 level and the 100 SMA.

The first major support is near the $23.50 level. If there is a close below the $23.50 support, the price could decline toward the $22.50 support. In the stated case, there is a risk of more downsides toward the $21.20 support in the near term.

Technical Indicators

4-Hours MACD – The MACD for SOL/USD is gaining pace in the bullish zone.

4-Hours RSI (Relative Strength Index) – The RSI for SOL/USD is above the 50 level.

Major Support Levels – $24.00, and $23.50.

Major Resistance Levels – $24.85, $25.65, and $30.00.

Ethereum Price Could See Downside Thrust Before Fresh Increase

Ethereum price is correcting gains from the $1,880 zone against the US Dollar. ETH could spike toward $1,820 before the bulls attempt a fresh increase.

  • Ethereum is moving lower from the $1,875 and $1,880 resistance levels.
  • The price is trading below $1,850 and the 100-hourly Simple Moving Average.
  • There is a bullish flag pattern forming with resistance near $1,855 on the hourly chart of ETH/USD (data feed via Kraken).
  • The pair could drop toward the $1,820 support where the bulls might take a stand.

Ethereum Price Dips Again

Ethereum’s price struggled to clear the $1,880 resistance zone and started a downside correction. ETH slowly moved lower below the $1,850 pivot level, similar to Bitcoin.

There was a drop below the 23.6% Fib retracement level of the key increase from the $1,800 swing low to the $1,876 high. The bears even pushed the price below the 100-hourly Simple Moving Average. Besides, there is a bullish flag pattern forming with resistance near $1,855 on the hourly chart of ETH/USD.

Ether is now trading below $1,850 and the 100-hourly Simple Moving Average. On the upside, immediate resistance is near the $1,855 level and the channel zone.

Ethereum Price

Source: ETHUSD on TradingView.com

The first major resistance is near the $1,872 level. The next key resistance is near the $1,880 level. A close above the $1,880 level could increase the chances of a steady increase toward $1,920. Any more gains might send the price toward the $2,000 hurdle, above which the price could rise toward the $2,040 level or even $2,120.

Downside Break in ETH?

If Ethereum fails to clear the $1,855 resistance, it could continue to move down. Initial support on the downside is near the $1,840 level or the 50% Fib retracement level of the key increase from the $1,800 swing low to the $1,876 high.

The first major support is near the $1,830 zone or the channel lower trend line. If the bulls fail to protect the $1,820 support, there could be a sharp decline. The next major support is near the $1,800 support level. Any more losses might send the price toward the $1,720 level in the near term.

Technical Indicators

Hourly MACDThe MACD for ETH/USD is losing momentum in the bullish zone.

Hourly RSIThe RSI for ETH/USD is now below the 50 level.

Major Support Level – $1,820

Major Resistance Level – $1,880

Circle Strategic Defense: $1 Billion War Chest Shields Against Shrinking Market Share

According to a Bloomberg report, Circle, a prominent player in the stablecoin market, strategically leverages its substantial cash reserves of over $1 billion to weather fresh competition from non-crypto giants like PayPal. 

The company’s market share of the second-largest stablecoin, USD Coin (USDC), has been declining, mainly due to factors such as Binance’s decision to reduce its usage of USDC. 

However, per the report, Circle remains optimistic about the future of stablecoins and aims to stem the decline while exploring new revenue streams and global expansion.

Circle Relies On $1 Billion Cash Cushion

The circulation of Circle’s USDC has witnessed a significant drop from $45 billion to approximately $26 billion this year, while Tether, the leading stablecoin, has experienced growth during the same period. 

Circle attributes part of this decline to Binance’s reduced utilization of USDC to promote its native token. Increasing competition from non-crypto companies like PayPal further intensifies the challenges for Circle.

The company’s over $1 billion cash cushion provides a significant hedge against market headwinds. The company generates revenue primarily from interest income on assets backing the USDC, including dollar deposits and short-term Treasuries. 

According to Bloomberg, Circle’s strong financial performance is “evident,” with revenues exceeding $779 million in the year’s first half. 

Adjusted earnings before interest, taxes, depreciation, and amortization (EBITDA) reached $219 million in the same period, exceeding the 2022 full-year figure of $150 million.

Circle’s CEO Remains Bullish On Stablecoins

 While acknowledging the impact of “tail-risk events” on USDC adoption, Circle’s CEO, Jeremy Allaire, remains optimistic about stablecoins’ mainstream potential. Allaire believes that increasing competition, such as PayPal’s recent entry into the market, will drive more financial services and internet payment firms to embrace stablecoins. 

Circle is actively pursuing partnerships to promote the broader adoption of USDC and plans to enhance transparency by regularly sharing financial reports. Moreover, the company has engaged Deloitte as its auditor.

Allaire anticipates that stablecoin issuers will face greater scrutiny and regulatory standards in the coming years. With regulators tightening control over stablecoins globally, he predicts that entities unable to meet these standards will be crowded out of the mainstream market. 

Nevertheless, Circle remains confident in its ability to adapt and benefit from the evolving regulatory environment. Despite potential interest rate declines, Circle expects increased crypto activity, positioning the company for further growth.

Circle is leveraging its substantial cash reserves to navigate market challenges and competition from non-crypto players. Despite declining market share, Circle remains focused on expanding revenue streams, promoting wider adoption of USDC, and embracing transparent financial reporting. 

With the regulatory landscape evolving, Circle aims to meet the highest standards and thrive in the stablecoin market, positioning itself for long-term success.

Circle

Conversely, USDC currently boasts a market capitalization of approximately $26.17 billion, securing its place as the sixth-largest cryptocurrency by market cap, according to CoinMarketCap data

This figure represents a minute 0.37% of the total cryptocurrency market, indicating the stablecoin’s steady performance despite the highly dynamic nature of the crypto space. With a circulating supply of 26.17 billion USDC tokens, the stablecoin has established a robust presence in the market.

Furthermore, USDC’s trading volume has surged, reaching an impressive $3.03 billion in the past 24 hours. This substantial trading activity positions USDC as the fourth most actively traded cryptocurrency, evidencing its liquidity and attractiveness to market participants. 

The 24-hour trading volume to market cap ratio stands at 11.59%, reflecting the strong liquidity and market depth of USDC, which further contributes to its stability and utility.

Featured image from Unsplash, chart from TradingView.com

Bitcoin Price Next Leg Lower Underway And At Risk for Key Reasons

Bitcoin price is moving lower from the $30,200 zone. BTC is signaling a fresh decline and there is a risk of a drop toward the $28,500 support.

  • Bitcoin is struggling to remain in a positive zone above $29,200.
  • The price is trading below $29,500 and the 100 hourly Simple moving average.
  • There is a connecting bearish trend line forming with resistance near $29,450 on the hourly chart of the BTC/USD pair (data feed from Kraken).
  • The pair could continue to move down if it breaks the $29,200 support zone.

Bitcoin Price Trims Gains

Bitcoin price faced another rejection above the $30,000 resistance zone. A high was formed near $30,190 and BTC reacted to the downside. There was a move below the $30,000 and $29,800 levels.

The price declined below the 50% Fib retracement level of the key increase from the $28,628 swing low to the $30,190 high. It seems like the bulls are now putting up some fight near the $29,300 zone. Bitcoin is now trading below $29,500 and the 100 hourly Simple moving average.

There is also a connecting bearish trend line forming with resistance near $29,450 on the hourly chart of the BTC/USD pair. If there is a fresh increase, the pair could face resistance near the 100 hourly Simple moving average at $29,400.

Bitcoin Price

Source: BTCUSD on TradingView.com

The next major resistance is near the trend line and $29,500. A close above the trend line could start a decent increase toward $30,000. To spark a steady uptrend, the price must settle above the $30,000 resistance. In the stated case, the price could rise toward $31,200 or even $32,000 in the coming days.

More Losses In BTC?

If Bitcoin fails to clear the $29,500 resistance, it could continue to move down. Immediate support on the downside is near the $29,320 level.

The next major support is near the $29,220 level or the 61.8% Fib retracement level of the key increase from the $28,628 swing low to the $30,190 high. A downside break below the $29,220 level might spark bearish moves. In the stated case, the price could revisit $29,000. Any more losses might call for a move toward the $28,500 level in the near term.

Technical indicators:

Hourly MACD – The MACD is now gaining pace in the bearish zone.

Hourly RSI (Relative Strength Index) – The RSI for BTC/USD is now below the 50 level.

Major Support Levels – $29,220, followed by $29,000.

Major Resistance Levels – $29,400, $29,500, and $30,000.

Curve DAO Scores $5 Million Boost From Binance, Eyes BNB Chain Expansion

In a strategic move to bolster the decentralized finance (DeFi) sector, Binance Labs, the venture capital and incubation arm of Binance, has committed a substantial $5 million investment in Curve DAO Token (CRV). 

The Ethereum-based CRV token is the backbone of the Curve ecosystem, which has established itself as the largest stable swap and second-largest decentralized exchange (DEX).

Curve and Binance’s BNB Chain Forge Strategic Alliance

As part of the partnership, Curve will explore the deployment of its protocol on the BNB Chain, the thriving ecosystem powered by its native token, BNB. This strategic alignment aims to leverage the strengths of both platforms, further fueling the growth of DeFi on the BNB Chain.

Yi He, Co-Founder of Binance and Head of Binance Labs, expressed enthusiasm about the collaboration, stating: 

Curve is the largest stableswap, and as a key protocol in DeFi, it has contributed to the steady growth of the space in 2023. Given the recent events that have impacted the protocol, Binance Labs has offered our full support to Curve through our investment and strategic collaboration. We view this cooperation as a starting point and look forward to working together to further propel the growth of the DeFi ecosystem.

Curve Founder, Michael Egorov, acknowledged the significance of the collaboration, stating:

BNB Chain has earned a significant presence in DeFi and is well-positioned to deploy Curve’s current and future products on its chain. We look forward to collaboratively fostering innovation and growth across the DeFi ecosystem.

According to Binance Labs’ announcement, Curve’s Automated Market Maker (AMM) platform has revolutionized liquidity provision in DeFi, offering hundreds of incentivized liquidity pools with low slippage and transaction fees. 

With the support and strategic investment of Binance Labs, the protocol seems poised to accelerate its mission to transform DeFi by increasing liquidity, reducing transaction friction, and expanding its ecosystem. 

Is Cross-Chain Interoperability The Key To Curve’s Success On BNB Chain?

Deploying Curve to BNB Chain brings numerous advantages to both Curve and the BNB Chain ecosystem. One key benefit is enhanced scalability, as BNB Chain offers high throughput and low latency, providing a robust infrastructure for DeFi protocols like Curve.

By deploying on BNB Chain, Curve can leverage the network’s capabilities to handle more transactions and accommodate the growing user demand.

Another advantage is the lower transaction fees offered by BNB Chain. This cost-efficiency appeals to users seeking to minimize expenses when interacting with Curve. By deploying on BNB Chain, Curve users can enjoy reduced transaction fees, enhancing the overall affordability of using the Curve protocol.

The cross-chain interoperability of BNB Chain also enables seamless integration of assets and protocols from different blockchains, creating opportunities for Curve to collaborate with other projects and protocols within the BNB Chain ecosystem. 

Deploying Curve to BNB Chain can expose the protocol to the extensive Binance ecosystem. Binance, one of the world’s largest cryptocurrency exchanges, operates its ecosystem on BNB Chain. 

This exposure opens doors to potential partnerships, collaborations, and increased visibility among Binance users, further strengthening Curve’s position in the market.

Overall, deploying the platform to BNB Chain aligns with its goal of expanding its presence across multiple chains and reaching a broader user base. 

By leveraging the advantages of BNB Chain, such as enhanced scalability, lower transaction fees, access to a large user base, cross-chain interoperability, and exposure to the Binance ecosystem, the protocol can contribute to the growth and development of the DeFi ecosystem.

Curve

Featured image from iStock, chart from TradingView.com 

Dogecoin Rally Ahead? This Positive Correlation Data Points To A Potential 20% Jump For DOGE

Dogecoin has been one of the cryptocurrencies to watch in the past few weeks. However, the token’s price appears to be slowing down after recording significant bullish momentum.

Interestingly, there might be renewed optimism around the DOGE price, as a crypto analyst has offered insight on what to expect from the meme coin in the coming weeks.

Dogecoin To Experience A 20% Price Rally?  

On Thursday, August 10, crypto analyst Ali Martinez shared data from IntoTheBlock, suggesting that DOGE might witness a positive price movement soon. This suggestion is based on the similarities in the price history of both Shiba Inu (SHIB) and Dogecoin. 

According to his post on X (formerly Twitter), there is a “strong” positive correlation of 0.74 between the two meme coins over the past two months. This indicates that when SHIB’s price shifts, the price of DOGE often moves in the same direction. 

Dogecoin

Interestingly, this hasn’t happened in the past few days, as the DOGE price has not taken significant action. The value of SHIB, on the other hand, has surged by 22% in the last seven days.

However, Ali Martinez noted that “given their high correlation coefficient,” a bullish price movement might still be on the horizon for DOGE. So, investors might want to keep a keen eye on the token’s performance in the coming days.

DOGE Price Stuck In A Range – Price Overview

Dogecoin has struggled to maintain the momentum garnered from Elon Musk’s support a few weeks ago. The meme coin has been trading mainly within a range since then, recording a mere 3.1% gain in the past week.

After reaching a 7-day high of $0.07658 on Saturday, August 5, the DOGE price shed all its gain to trade below $0.073. However, the token’s price is back up, hovering around its weekly high.

This price action underscores the meme coin’s unsuccessful attempts at breaking the $0.08 resistance level. DOGE trades about 5.5% down from the significant $0.08 zone after failing to breach it on July 31.

As of this writing, the Dogecoin price is $0.075739,  having leaped by 0.3% in the last 24 hours. With a nearly $10.7 billion market cap, DOGE ranks as the 8th-largest cryptocurrency.

CoinGecko data reveals that there has been a substantial boost in DOGE’s market activity, with a 17.6% increase in its daily trading volume. The cryptocurrency currently has a 24-hour trading volume of over $430.2 million.

Dogecoin

Bitcoin Bears Ran Out Of Coins? What This Analyst Forecast For BTC At Around $30,000

Despite today’s macroeconomic developments, the price of Bitcoin continues to move sideways and seems likely to stay on this path. The number one crypto by market cap has seen its volatility drop to fresh lows as its price is trapped at current levels.

At the time of writing, Bitcoin trades at $26,600 with sideways movement in the last 24 hours. Over the past seven days, the cryptocurrency has recorded some profits but has been unable to break above or below the $28,000 to $30,500 range.

Bitcoin BTC BTCUSDT

A New Normal For Bitcoin? Volatility Likely To Decline Until This Changes

Analyst Dylan LeClair pointed out that operators in the derivatives sector have dominated the current Bitcoin price action. In that sense, the BTC spot-to-derivative trading volume ratio followed volatility and declined to all-time lows.

As seen in the chart below, this ratio shows that the spot market has been suppressed by the derivatives sector, with traders “chopping each other to oblivion.” LeClair stated the following:

(…) spot bears have mostly run out of coins & spot bulls are either fully deployed or are sidelined TradFi waiting for ETF approval.

Bitcoin BTC BTCUSDT Chart 2

With the U.S. Federal Reserve (Fed) out of session until September and low uncertainty in the short term, the price of Bitcoin seems poised to keep chopping around its current levels.

In this environment, derivatives traders will likely profit from selling volatility via different financial instruments. Data from the derivatives platform Deribit shows an uptick in call (buy) contracts on the options sectors for October to December expiry.

A report posted by this platform from Rogue Trader Academy highlights the need for a catalyst to push BTC out of its current range. The market is positioning itself for a Bitcoin spot Exchange Traded Fund (ETF) approval in Q4, 2023, thus why players on the options markets are accumulating calls.

Selling volatility has been a profitable strategy in July. Still, as the metric hovers around historical lows, traders become more resilient to dump their contracts on the derivatives sector, further suppressing BTC’s price. Rogue Trader Academy stated:

(…) those selling volatility (gamma sellers) are growing hesitant to offload at such historically low implied vol levels, especially with significant economic data like the US Consumer Price Index (CPI) on the horizon for this week.

In this low volatility, low liquidity environment, only a catalyst will push BTC beyond $30,000 and beyond $40,000 by the end of the year. Something seems apparent in this context: Bitcoin seems ahead of any bullish narrative and likely to outperform in the sector for the remainder of 2023.

Cover image from Unsplash, chart from Tradingview

Terra Classic (LUNC) Chances Of Revival Grow Slimmer, Here’s Why

Terra Classic (LUNC) has suffered persistent declines since the network’s collapse back in 2022. These declines have ranged from its price through to the network’s Total Value Locked (TVL). And even while development abounds among its community members to try to restore it to its past glory, the numbers point to a low possibility of recovery.

Terra Classic TVL Falls To All-Time Low

After Terra’s crash in 2022, the network lost a significant chunk of its TVL due to investors pulling out their funds as well as developers moving their decentralized applications and protocols to other networks. Over time, there seemed to be a stable trend but once again, the network has lost out against its better counterparts.

Data from the on-chain tracker DeFiLlama shows that as of Thursday, the total Terra Classic (LUNC) TVL is sitting at $2.11 million. This is notable because this is the lowest that the network’s TVL has ever been. It is also a long way from the over $20 billion all-time high TVL of the Terra blockchain before its tragic collapse.

Terra Classic (LUNC) TVL

The vast majority of its meager TVL is spread across just two DeFi protocols: Terraswap and Astroport Classic, with $1.07 million and $933,527 in TVL, respectively. The highest that Terra’s TVL has been in 2023 is $12 million back in April 2023.

Terra’s TVL has now declined by over 83% from its 2023 peaks. In the same vein, DeFiLlama shows $0 decentralized exchange (DEX) volumes over the last week, meaning that trading activity on the network has grounded to a halt.

The Road To Recovery For LUNC

Over the last year, the Terra community has been consistent about trying to help the network recover. However, the kind of decline that the cryptocurrency suffered as a result of the crash is not easy and near impossible to recover from.

Throwing in the fact that the network’s activities are almost non-existent, the chances of recovery have become even slimmer. But perhaps the biggest hindrance to its recovery is the fact that LUNC’s supply ballooned to over 6 trillion coins. Given this, even a surge to the $1 mark is out of reach for the token, unless there is a significant reduction in its supply.

LUNC’s price continues to struggle at this time, trading at $0.00007746 at the time of writing. Its market cap is currently sitting at $450 million, making it the 80th-largest cryptocurrency by market cap.

Terra Classic (LUNC) price chart from Tradingview.com

Bitcoin Futures Fakeout: The Price Divergence That Predicts A Phony

This week, Bitcoin traders braced for a breakout as an important technical buy signal triggered and BTCUSD shot up over $30,000 temporarily.

They came up short-handed, however, as the market took an immediate turn back down. Interestingly, the fakeout could have possibly been predicted by a divergence between two BTCUSD price charts.

Why Price Patterns And Technical Signals Can Fail

Price patterns are tough to trade in cryptocurrencies. Because so many eyes are on the same pattern meeting precise parameters, the market has a way of making people pay for acting on the obvious. For example, a rising wedge pattern is typically bearish, but could breakout to the upside.

The same is true for technical signals that a large portion of traders are paying attention to, such as notable crossovers and changes in momentum. This is exactly the case recently with a bullish crossover of the daily BTCUSD Moving Average Convergence Divergence (MACD).

The MACD is a momentum indicator that gives a buy signal when the MACD line crosses the signal line from below. This signal not only has appeared in Bitcoin, but it confirmed on BTCUSD spot exchanges, so what gives? It was a phony signal from the “future.”

Bitcoin futures

Spot Possible Divergences With Bitcoin Futures

By “future” we mean BTC CME Futures, also known as Chicago Mercantile Exchange’s Bitcoin derivatives product, which institutions use to speculate on the underlying price of BTCUSD. The BTC CME Futures chart doesn’t always reflect spot BTCUSD charts 1:1. Any divergences between the two platforms, has historically led to fakeouts and phony breakouts.

Part of the reason for this is due to the platform shutting down for a short period each day, and for the entire weekend starting at Friday afternoon. The result is a Bitcoin chart with more traditional market traits, such as gaps. The missing price data also changes the calculation of many technical indicators. For example, moving averages are in slightly different locations from chart to chart.

This is precisely how the recent “fakeout” higher was able to be predicted with a degree of accuracy. This discrepancy and divergence leading to false signals is nothing new and has been happening for years. When BTC CME finally participates in the same signal, the expected results often then arrive.

Is this a situation similar to Dow Theory, where the DJIA and DJTA must confirm one another for a trend to be valid? Or is there some more at play? Whatever the case may be, there’s enough historical evidence at this point to pay attention to any divergences between spot and CME Futures.